Understanding sentiment analysis in the stock market is vital for the CMT Exam, as it reveals the emotions and perceptions driving market behavior. By analyzing sentiment indicators, traders can gauge investor mood, identify market trends, and anticipate reversals. Mastering sentiment analysis helps refine strategies for trading success and market timing precision.
Learning Objective
In studying “Analyzing Sentiment in the Stock Market” for the CMT Exam within “Section III: Topics in Behavioral Finance,” you should learn to assess how emotions and perceptions drive market behavior. Understand tools and indicators used to gauge sentiment, such as put/call ratios, sentiment surveys, and news sentiment analysis. Evaluate how market sentiment influences trends, reversals, and volatility. Analyze the impact of bullish or bearish sentiment on asset prices and apply this knowledge to develop sentiment-driven trading strategies. Additionally, explore case studies demonstrating sentiment’s role in market dynamics and apply these insights to CMT Level 2 market scenarios.
Introduction to Market Sentiment Analysis

Market sentiment analysis is the study of overall investor attitude toward a specific market or asset. It reflects the emotions and perceptions driving market behavior, often influencing price movements and trends beyond fundamental or technical factors. Understanding market sentiment is critical for Chartered Market Technicians (CMTs), as it helps in assessing the psychological aspects of market dynamics, identifying potential trends, and anticipating reversals.
1. Definition and Importance of Market Sentiment
Market sentiment represents the prevailing mood among investors, whether optimistic (bullish) or pessimistic (bearish), and has a profound impact on price behavior. It is crucial for identifying short-term market trends, as emotions often lead to price movements that fundamentals alone cannot explain.
2. Role of Sentiment in Market Trends and Price Movements
Sentiment can drive trends by reinforcing positive or negative feedback loops. For example, bullish sentiment can push prices higher as more investors buy, while bearish sentiment can accelerate sell-offs. These trends often persist as long as the prevailing sentiment remains strong, highlighting how emotion-driven trading can influence markets.
3. Behavioral Finance Context and Relevance
Market sentiment is deeply rooted in behavioral finance, which studies the psychological factors influencing financial decisions. Biases like fear, greed, overconfidence, and herd behavior can create price anomalies, leading to bubbles and crashes. Recognizing the behavioral aspects of sentiment analysis helps CMTs to better anticipate and navigate these irrational price movements.
4. Key Sentiment Indicators Used by Traders
Several tools are used to gauge market sentiment, including:
- Put/Call Ratios: Measures the balance between bullish and bearish options trades, providing insights into overall market mood.
- Sentiment Surveys: Surveys of investor sentiment, like the AAII Sentiment Survey, gauge investor outlook and predict potential trend shifts.
- VIX (Volatility Index): Often called the “fear gauge,” the VIX measures market volatility and investor anxiety, reflecting pessimistic or optimistic sentiment.
Tools and Indicators for Gauging Sentiment
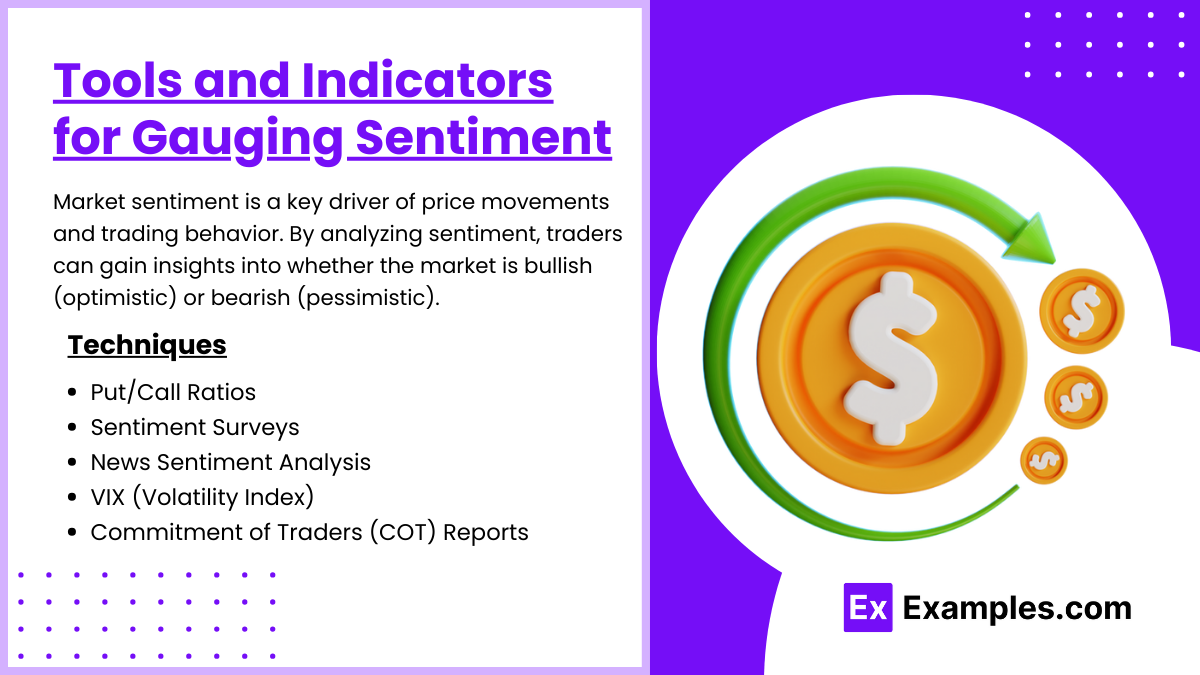
Market sentiment is a key driver of price movements and trading behavior. By analyzing sentiment, traders can gain insights into whether the market is bullish (optimistic) or bearish (pessimistic). Various tools and indicators are available to gauge sentiment, helping traders make more informed decisions based on the prevailing mood of the market. Here are some of the most widely used tools and indicators:
1. Put/Call Ratios
The put/call ratio measures the number of put options (bearish bets) relative to call options (bullish bets) traded in the market. A high put/call ratio indicates a bearish sentiment, as more traders are buying puts, anticipating price declines. Conversely, a low ratio suggests bullish sentiment, as more traders are buying calls. This indicator helps gauge the overall market mood and can signal potential reversals when extreme levels are reached.
2. Sentiment Surveys
Sentiment surveys, such as the American Association of Individual Investors (AAII) Sentiment Survey and the Investors Intelligence Survey, capture the opinions and outlooks of investors. By measuring how many investors are bullish, bearish, or neutral, these surveys provide a snapshot of market sentiment at a given time. Extreme bullish or bearish readings often indicate potential turning points, as markets tend to reverse when sentiment becomes overly one-sided.
3. News Sentiment Analysis
News sentiment analysis involves evaluating media coverage and social media activity to gauge the market’s emotional state. Tools that analyze sentiment from financial news outlets, blogs, and social media platforms can help determine whether public sentiment is positive, negative, or neutral. This approach helps traders understand how news events impact investor sentiment and how sentiment may influence market reactions.
4. VIX (Volatility Index)
The VIX, often referred to as the “fear gauge,” measures the expected volatility in the stock market over the next 30 days, based on options prices. When the VIX is high, it indicates heightened fear and uncertainty among investors, reflecting a bearish or risk-averse sentiment. Conversely, a low VIX suggests complacency and a bullish sentiment. Traders use the VIX to assess market risk and anticipate potential market moves.
5. Commitment of Traders (COT) Report
The COT report, published weekly by the Commodity Futures Trading Commission (CFTC), provides insights into the positions of different market participants, including commercial hedgers, large speculators, and retail traders. By analyzing the positions of these groups, traders can gauge sentiment and identify when market positioning becomes extreme, signaling potential reversals or shifts in market dynamics.
6. Bullish Percent Index (BPI)
The Bullish Percent Index tracks the percentage of stocks in a given market or sector that are showing a bullish signal on a point-and-figure chart. When the BPI reaches extreme levels, it can indicate that sentiment is either overly bullish or overly bearish, suggesting a potential change in trend direction.
Impact of Sentiment on Market Behavior

Market sentiment plays a crucial role in influencing market behavior, often driving trends, volatility, and price movements in ways that can deviate from fundamental values. Understanding the impact of sentiment allows traders and market analysts to anticipate market reactions, identify opportunities, and mitigate risk. Here’s how sentiment shapes market behavior:
1. How Bullish and Bearish Sentiment Influence Price Trends
Positive (bullish) sentiment generally leads to increased buying activity, driving prices higher. When a large number of investors are optimistic about market conditions or a specific asset, their collective buying can create upward momentum and extend market rallies. Conversely, negative (bearish) sentiment leads to increased selling, pushing prices lower as pessimism and fear dominate market behavior. The strength and persistence of trends are often fueled by prevailing sentiment.
2. Sentiment-Driven Market Reversals and Trend Exhaustion
Extreme sentiment levels can often signal potential reversals in market trends. For example, when sentiment becomes excessively bullish, it may indicate that most buyers are already in the market, leaving fewer participants to sustain the rally. Similarly, extreme bearish sentiment can suggest a market bottom, as excessive pessimism can lead to capitulation selling. Identifying these extremes is critical for timing trades and anticipating reversals.
3. Case Studies of Market Bubbles and Crashes Driven by Sentiment
Historical market events demonstrate how sentiment can drive bubbles and crashes. During the dot-com bubble of the late 1990s, exuberant sentiment and unrealistic expectations for technology stocks led to overvaluation and a subsequent crash when sentiment shifted. Similarly, the 2008 financial crisis was fueled by widespread fear and panic, leading to sharp declines as bearish sentiment dominated. These examples illustrate how collective emotions can amplify market movements.
4. Relationship Between Sentiment and Market Volatility
Sentiment is closely linked to market volatility. When sentiment shifts rapidly—due to unexpected news, economic data, or geopolitical events—volatility often spikes as investors react quickly to changing conditions. High levels of uncertainty and fear can lead to large price swings, while low sentiment volatility often coincides with more stable markets. Tools like the Volatility Index (VIX) measure this relationship, providing insights into market mood and potential risk.
5. Herd Behavior and Market Sentiment
Sentiment often drives herd behavior, where individuals follow the actions of the majority rather than making independent decisions. This behavior can lead to self-reinforcing trends, as rising prices attract more buyers, and falling prices trigger additional selling. Herd behavior magnifies price movements, creating trends that may extend well beyond what fundamentals alone would justify.
6. Emotional Triggers and Investor Reactions
Sentiment is heavily influenced by emotional triggers, such as economic reports, corporate earnings, geopolitical tensions, or major news events. Positive triggers can lead to a surge in optimism, while negative triggers can fuel fear and panic. The way investors collectively interpret and react to these events shapes market trends and behavior, sometimes creating irrational exuberance or fear.
Developing Sentiment-Based Trading Strategies
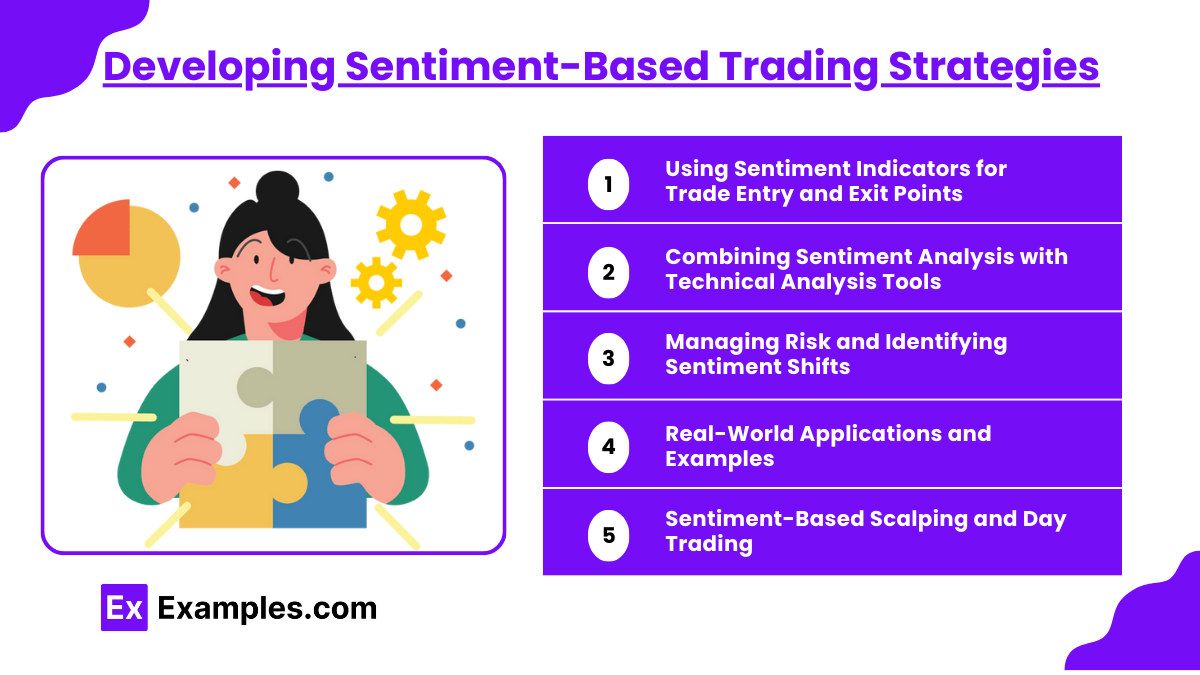
Sentiment-based trading strategies leverage the collective mood and emotions of market participants to make informed decisions about entering, exiting, or managing trades. Since market sentiment often drives price movements beyond fundamental values, understanding and applying sentiment analysis can help traders anticipate trends, identify turning points, and capitalize on market inefficiencies. Here are key components of developing sentiment-based trading strategies:
1. Using Sentiment Indicators for Trade Entry and Exit Points
Sentiment indicators such as the put/call ratio, sentiment surveys, and the Volatility Index (VIX) help gauge the prevailing mood of the market. Traders can use these indicators to determine when sentiment is overly bullish or bearish, signaling potential trend exhaustion or reversals. For example, extreme bullish sentiment may indicate a market top, prompting traders to exit or consider short positions, while extreme bearish sentiment may suggest a market bottom, signaling a buying opportunity.
2. Combining Sentiment Analysis with Technical Analysis Tools
Sentiment-based strategies become more effective when combined with technical analysis. For instance, a bullish sentiment reading that aligns with a technical breakout provides stronger confirmation of a potential upward move. Similarly, bearish sentiment combined with a bearish chart pattern can validate a short trade. By aligning sentiment signals with technical indicators like moving averages, trendlines, and oscillators, traders increase the probability of success.
3. Managing Risk and Identifying Sentiment Shifts
Sentiment-driven strategies require careful risk management due to the unpredictable nature of market psychology. Rapid shifts in sentiment can lead to sudden reversals and heightened volatility. To manage this risk, traders can use stop-loss orders, position sizing, and diversification to protect their capital. Additionally, continuously monitoring sentiment indicators helps traders recognize early signs of changing sentiment, allowing them to adjust their positions accordingly.
4. Practical Examples of Sentiment-Driven Trades
- Contrarian Strategies: Contrarian traders often bet against the prevailing market sentiment. For example, when sentiment indicators show extreme optimism, contrarian traders may short the market, anticipating a correction. Conversely, they may buy when sentiment is extremely bearish, expecting a rebound.
- Trend-Following Strategies: When sentiment supports a strong trend, traders can use it as a basis for entering long positions in uptrends or short positions in downtrends. Positive sentiment can drive momentum, while negative sentiment can reinforce sell-offs.
5. Real-World Applications and Examples
Historical market movements, such as the 2008 financial crisis and subsequent recovery, illustrate how sentiment-driven strategies can be applied. During the crisis, extreme fear (as measured by the VIX) led to oversold conditions and presented buying opportunities for those who anticipated a market rebound. Similarly, the dot-com bubble showed how euphoric sentiment drove prices to unsustainable levels, providing shorting opportunities for traders who recognized the speculative excess.
6. Sentiment-Based Scalping and Day Trading
Short-term traders can use real-time sentiment data from social media, news headlines, and sentiment-driven market movements to make quick trades. For example, positive news about a company may create a surge in buying sentiment, leading to a rapid price spike. Traders who capitalize on this momentum can profit from quick, sentiment-driven moves.
Examples
Example 1: Contrarian Trading Based on Sentiment Surveys
When sentiment surveys, such as the AAII Investor Sentiment Survey, show extreme bullishness, contrarian traders may interpret it as a signal that the market is overheated and due for a correction. Conversely, extreme bearish readings often indicate potential market bottoms, presenting buying opportunities for those willing to go against the crowd.
Example 2: Using the VIX (Volatility Index) to Gauge Fear
The VIX, commonly known as the “fear gauge,” spikes during times of market uncertainty and panic. Traders use this indicator to measure investor fear and gauge market sentiment. High VIX levels may signal oversold conditions and a potential market rebound, while low VIX levels indicate complacency and potential overvaluation.
Example 3: Put/Call Ratio for Sentiment Analysis
A high put/call ratio, indicating more puts than calls are being traded, suggests bearish sentiment, as traders are hedging against or betting on declines. Conversely, a low put/call ratio suggests bullish sentiment. When these ratios reach extremes, it often signals potential market reversals or trend shifts.
Example 4: News Sentiment Analysis and Market Impact
Traders analyze news sentiment, including headlines and social media mentions, to gauge market reactions. Positive news about a major economic policy or a company’s earnings can drive bullish sentiment, leading to a rally, while negative news can create fear and sell-offs. Monitoring news sentiment helps traders anticipate short-term market moves.
Example 5: Sentiment Divergence and Trend Confirmation
When market sentiment diverges from price action, it can signal a potential reversal. For example, if sentiment remains overly bullish while the market fails to make new highs, it may indicate weakening momentum and a pending correction. Similarly, bearish sentiment during stable or rising prices can signal hidden strength, offering a buying opportunity.
Practice Questions
Question 1:
Which of the following best describes the function of the VIX (Volatility Index) in market sentiment analysis?
A. It measures the number of call options traded
B. It indicates the level of investor fear and market volatility
C. It tracks the movement of blue-chip stocks
D. It assesses the impact of earnings reports
Answer: B) It indicates the level of investor fear and market volatility
Explanation:
The VIX, often referred to as the “fear gauge,” measures expected market volatility based on options prices. A high VIX indicates heightened investor fear and uncertainty, while a low VIX suggests complacency. It is a key tool for understanding market sentiment and gauging potential risk or stability in the market.
Question 2:
A high put/call ratio in the market typically indicates:
A. Bullish sentiment, as more call options are being purchased
B. Bearish sentiment, as more put options are being purchased
C. Neutral sentiment, with equal put and call options traded
D. No correlation with market sentiment
Answer: B) Bearish sentiment, as more put options are being purchased
Explanation:
A high put/call ratio indicates that more put options (typically used to hedge against or bet on declines) are being traded compared to call options, suggesting bearish sentiment among traders. This often reflects increased caution or pessimism about market conditions.
Question 3:
What can be inferred when sentiment surveys show extreme levels of bullishness?
A. The market is highly undervalued and due for growth
B. Sentiment-driven momentum will continue indefinitely
C. A market correction or reversal may be imminent
D. There is no connection between sentiment and price trends
Answer: C) A market correction or reversal may be imminent
Explanation:
Extreme bullishness in sentiment surveys can indicate that most investors are already fully invested, leaving little room for additional buying pressure. This saturation often precedes a market correction or reversal, as sentiment extremes frequently mark turning points in market trends.

