Preparing for the CMT Exam requires a solid understanding of Applied Cycle Analysis, a vital aspect of technical analysis. Mastery of cyclical patterns, time frames, and market rhythms is essential, as this knowledge aids in identifying potential market trends and reversals. Proficiency in cycle analysis is key for effective trading decisions.
Learning Objective
In studying “Applied Cycle Analysis” for the CMT Exam, you should learn to understand and identify cyclical patterns within financial markets. Explore how time cycles, such as seasonal, weekly, and intraday cycles, influence price movements and market trends. Analyze key principles and techniques, including Fourier analysis and spectral analysis, to measure cycle length, amplitude, and phase. Evaluate the use of cycle analysis in forecasting market reversals and trend changes. Additionally, apply your understanding to interpret and predict market behavior in real-world scenarios, utilizing historical cycle data to enhance trading strategies and manage investment risks effectively.
Introduction to Cycle Analysis in Financial Markets

Cycle analysis is a key component in technical analysis, focusing on identifying repeating patterns and rhythms in financial markets. It examines how cycles, such as time-based or price cycles, affect market trends, aiming to anticipate future price movements by understanding past behaviors. Cycles can range from very short-term intraday cycles to long-term economic cycles spanning years.
The concept originates from the idea that markets are influenced by a combination of psychological, economic, and external forces that often manifest in predictable patterns. Seasonal cycles, for example, reflect periodic shifts due to events like fiscal reporting periods or consumer spending patterns. By identifying these cycles, analysts attempt to determine when markets may experience highs and lows, helping traders time their entry and exit points more effectively.
Cycle analysis also aids in understanding economic indicators such as business cycles, which follow a general pattern of expansion, peak, contraction, and trough. These cycles can influence market trends by impacting investor sentiment and economic policy, thereby affecting asset prices. Overall, mastering cycle analysis equips traders and investors with a framework to make informed predictions, enhancing their ability to manage risk and optimize returns.
Types of Cycles and Their Characteristics

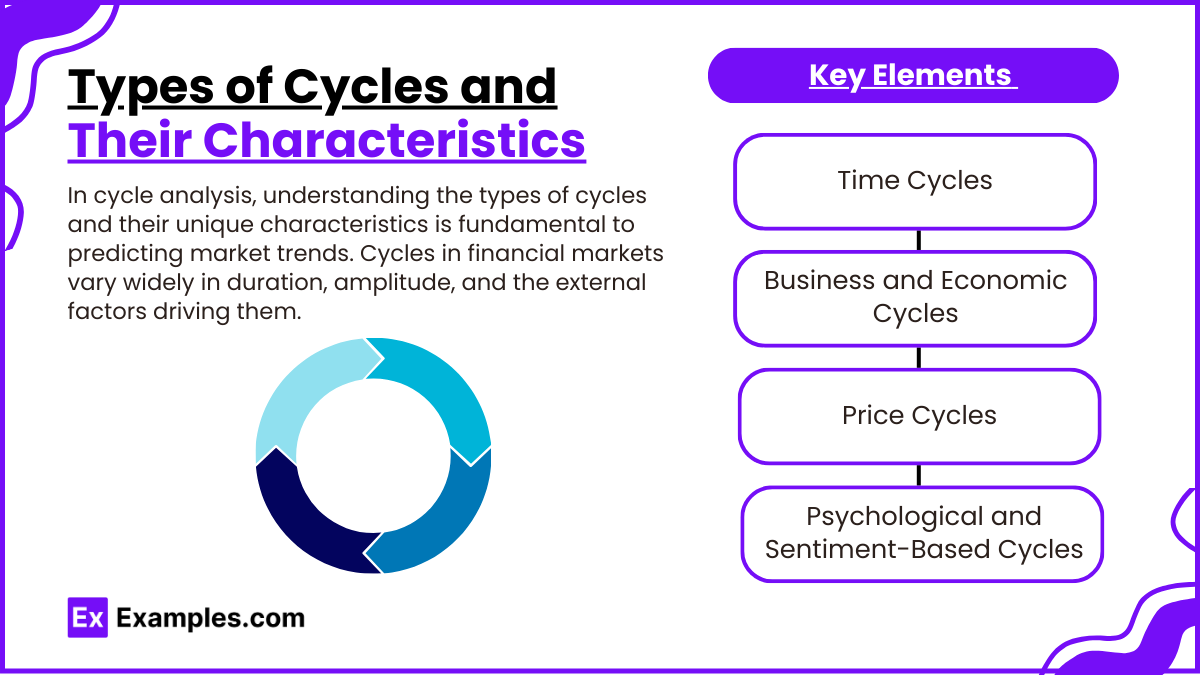
In cycle analysis, understanding the types of cycles and their unique characteristics is fundamental to predicting market trends. Cycles in financial markets vary widely in duration, amplitude, and the external factors driving them. Here are some of the key types of cycles analysts observe:
1. Time Cycles
- Daily and Intraday Cycles: These cycles are seen within a single trading day and are often driven by factors like market open and close, lunch hours, and high-volume trading periods. Intraday cycles help day traders in identifying the best moments to buy or sell.
- Weekly Cycles: Weekly patterns reflect the rhythm of trading across each week, often influenced by predictable events such as economic reports and institutional trading activities that tend to peak at certain days.
- Monthly and Seasonal Cycles: These cycles are seen over longer periods and often correlate with predictable events, such as fiscal quarters, tax periods, and holiday seasons. For example, the “January Effect” describes a trend where stock prices tend to rise during January due to investment inflows at the start of the year.
2. Business and Economic Cycles
- Expansion: This phase is characterized by growing economic activity, rising employment, and increased consumer spending, which tends to lift asset prices.
- Peak: Following a period of growth, the economy reaches its peak, often resulting in elevated asset prices, but also signaling a potential turning point.
- Contraction: Economic activity starts to slow down, leading to declining asset prices and a cautious investment environment.
- Trough: The cycle bottoms out, often characterized by reduced economic activity and lower asset prices, after which recovery typically begins, and a new expansion phase starts.
3. Price Cycles
- Amplitude: The amplitude of a price cycle reflects the height or depth of a price move within a cycle. High amplitude cycles often indicate strong market sentiment or significant external events.
- Frequency: This characteristic refers to how often a cycle occurs within a specific time frame. High-frequency cycles, for example, may indicate short-term price volatility.
- Duration: The length of each cycle, whether it’s a short, medium, or long-term cycle, determines the time frame within which price patterns repeat. Long-duration cycles are often observed in major market trends, while short-duration cycles may indicate quick, temporary price changes.
4. Psychological and Sentiment-Based Cycles
- These cycles reflect patterns in investor behavior, often influenced by emotional factors like fear and greed. Psychological cycles are sometimes cyclical themselves, as market sentiment tends to follow a repetitive path from optimism to euphoria, then fear, and eventually recovery.
- Behavioral Patterns: Recognizing the cyclical nature of collective investor psychology can help traders anticipate market shifts based on prevailing sentiment.
Each cycle type has unique indicators and characteristics, allowing traders to use them as predictive tools for various time horizons. Mastering the different types and their characteristics enhances an analyst’s ability to forecast price movements and make informed trading decisions based on anticipated market trends.
Analytical Techniques for Cycle Identification

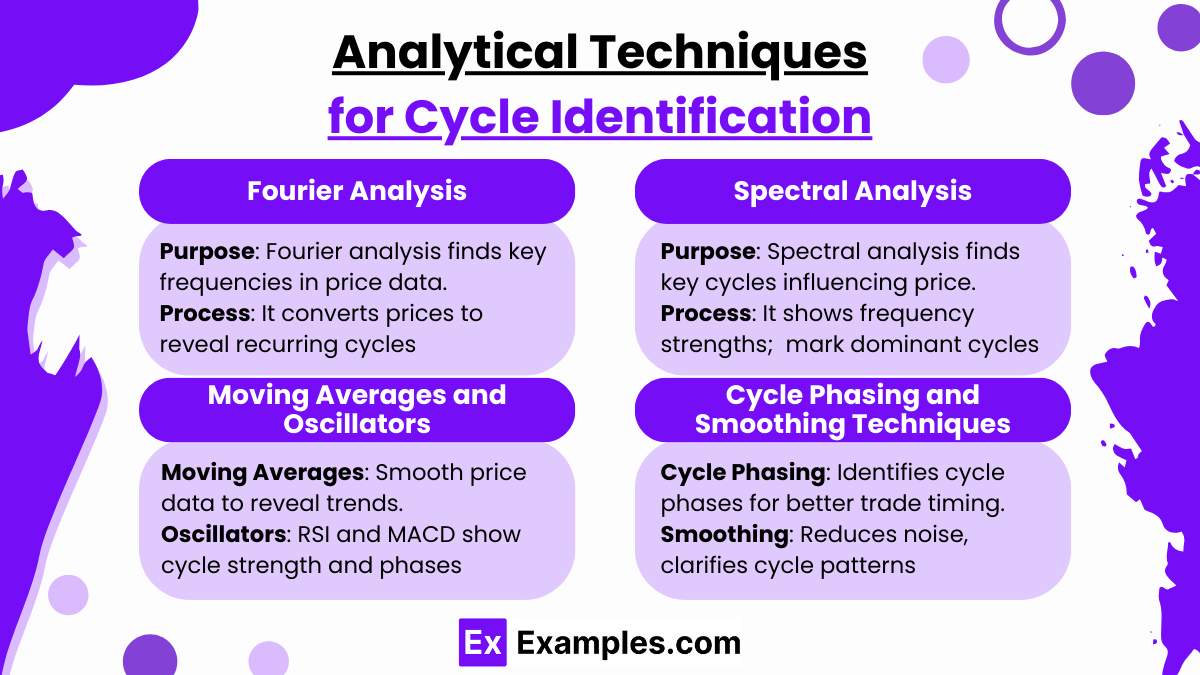
Identifying cycles in financial markets requires specialized analytical techniques designed to detect and measure the repeating patterns in price movements and time intervals. Analysts use these techniques to quantify cycle characteristics like frequency, amplitude, and phase, enabling more accurate predictions of future market behaviors. Here are the primary analytical techniques for cycle identification:
1. Fourier Analysis
- Purpose: Fourier analysis is a mathematical tool that breaks down complex waveforms into simpler sinusoidal components, allowing analysts to detect the dominant frequencies within a price series.
- Process: By transforming price data into a series of frequencies, analysts can identify cycles hidden within price trends and fluctuations. This decomposition helps pinpoint regular intervals at which price patterns tend to repeat, providing insights into underlying cycle lengths.
- Application: Fourier analysis is valuable for uncovering cycles within noisy data, where patterns may not be immediately apparent. It’s commonly used in conjunction with other time series analysis tools to enhance the accuracy of cycle detection.
2. Spectral Analysis
- Purpose: Spectral analysis is used to identify the prominent cycles or periodicities within a dataset, helping analysts understand which cycles have the strongest influence on price movements.
- Process: By applying spectral analysis, analysts create a spectrum showing the strength (power) of different frequencies within the data. The peaks in this spectrum represent the most significant cycles, providing clues about the market’s dominant rhythms.
- Application: Spectral analysis is particularly useful for filtering out less relevant or “weak” cycles, allowing analysts to focus on the most impactful patterns. It is often used to supplement Fourier analysis, as it provides a visual representation of the cycle strengths.
3. Moving Averages and Oscillators
- Moving Averages: Moving averages smooth out price data, helping to reduce noise and reveal clearer cyclical trends. Analysts use moving averages to observe the general direction of the market over a specified time frame, making it easier to spot turning points in cycles.
- Oscillators: Oscillators like the Relative Strength Index (RSI) and Moving Average Convergence Divergence (MACD) measure the strength and momentum of price cycles. These indicators help analysts detect overbought or oversold conditions, which can signal the end of one cycle phase and the start of another.
- Application: By combining moving averages and oscillators, analysts gain a clearer view of cyclical patterns and potential reversal points, especially in short- to medium-term cycles.
4. Cycle Phasing and Smoothing Techniques
- Cycle Phasing: This technique helps analysts align different cycles in a market to determine where each is in its current phase (e.g., uptrend, peak, downtrend, trough). Knowing the phase of a cycle allows traders to better time their trades, as each phase corresponds to specific market behaviors.
- Smoothing Techniques: Techniques such as exponential smoothing help to filter out random fluctuations, enhancing the clarity of observed cycles. Smoothing is crucial for visualizing the underlying cycle pattern without interference from short-term volatility.
- Application: Cycle phasing and smoothing techniques are often used in tandem to make complex or overlapping cycles more interpretable, improving the precision of cycle-based trading strategies.
Practical Applications of Cycle Analysis in Trading

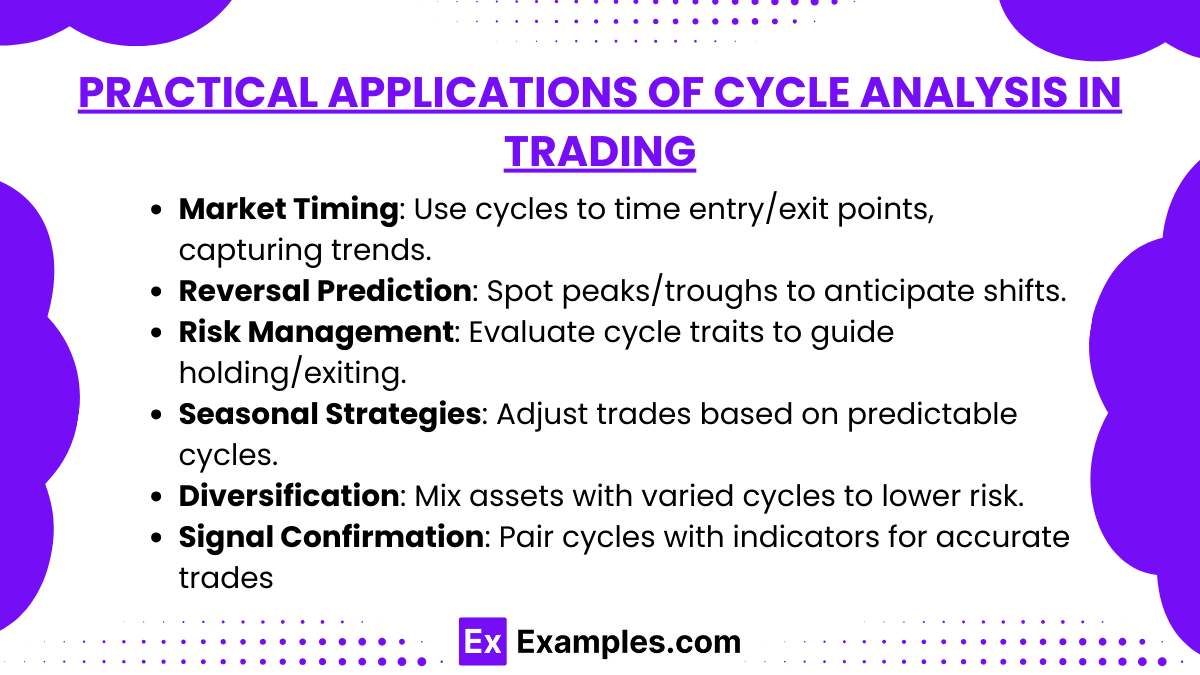
- Market Timing: Use cycle analysis to determine optimal entry and exit points based on cycle phases, helping traders capitalize on price trends.
- Trend Reversal Prediction: Identify potential reversals by observing cyclical peaks and troughs, allowing traders to anticipate market shifts.
- Risk Management: Assess cycle duration and amplitude to gauge risk levels, supporting decisions to hold or exit positions based on expected cycle behavior.
- Seasonal Trading Strategies: Leverage predictable seasonal cycles, such as the “January Effect,” to adjust trading strategies based on expected market behavior.
- Portfolio Diversification: Incorporate assets with differing cycle patterns to reduce overall portfolio risk by balancing various cycle influences.
- Confirmation of Technical Signals: Use cycle analysis alongside other indicators to confirm buy/sell signals, enhancing trade accuracy.
Examples
Example 1
Analyzing a weekly cycle in a stock’s price to identify common patterns in trading volume and price movement, often finding that the stock shows increased buying activity toward the end of the week. This insight can help traders anticipate potential price upticks and time their trades accordingly.
Example 2
Observing the seasonal cycle in retail stocks, where prices tend to rise during the holiday shopping season. A trader might buy retail stocks at the beginning of Q4 and sell after the holiday season to benefit from cyclical price increases driven by seasonal consumer demand.
Example 3
Using business cycles to trade sector-based ETFs, such as buying industrial sector ETFs during an economic expansion phase and shifting to defensive sector ETFs (like utilities) during a contraction phase. This strategy leverages cyclical economic shifts to optimize returns.
Example 4
Applying Fourier analysis to decompose long-term price data of a commodity, identifying a dominant multi-year cycle that correlates with economic indicators. Traders use this insight to predict when the commodity might hit peaks and troughs in the coming years, aiding in strategic investment decisions.
Example 5
Utilizing oscillators like MACD to detect the end of a price cycle in a currency pair. As MACD indicates an overbought condition, a trader might interpret this as the peak of a cycle and prepare to sell, anticipating a cyclical downturn based on past performance patterns.
Practice Questions
Question 1
Which of the following is an example of a seasonal cycle that traders might consider in applied cycle analysis?
A) Weekly fluctuations in trading volume
B) Price increases in retail stocks during the holiday season
C) Long-term business cycles of economic expansion and contraction
D) Intraday price movements during peak trading hours
Answer: B
Explanation: Seasonal cycles refer to patterns associated with specific times of the year. In this case, retail stocks often experience price increases during the holiday season due to increased consumer demand, making option B the correct answer. Weekly fluctuations, business cycles, and intraday movements do not fit the seasonal cycle category.
Question 2
In applied cycle analysis, Fourier analysis is primarily used to:
A) Smooth out short-term price volatility
B) Identify overbought or oversold conditions
C) Decompose price data into component frequencies
D) Track long-term economic cycles
Answer: C
Explanation: Fourier analysis is a mathematical technique used to break down complex waveforms, like price data, into simpler frequencies, allowing analysts to identify underlying cycles. Options A and B are functions of smoothing and oscillators, while option D describes economic cycle tracking.
Question 3
A trader notices that a certain stock tends to reach its peak near the end of each month. This pattern is best described as:
A) A daily cycle
B) A weekly cycle
C) A monthly cycle
D) A seasonal cycle
Answer: C
Explanation: The observation that the stock peaks at the end of each month aligns with a monthly cycle. Daily and weekly cycles would involve more frequent patterns, while a seasonal cycle typically spans a year or more. Thus, option C is the correct answer.


