Bar chart patterns are essential tools in technical analysis, revealing market sentiment and signaling potential reversals, continuations, and breakout points. Each bar represents a specific time period’s open, high, low, and close prices, offering insights into price movement strength and direction. Patterns like inside bars, outside bars, reversal bars, and exhaustion bars help traders anticipate market behavior. By understanding these patterns within broader trends and with volume confirmation, analysts can make informed decisions about entry and exit points, aligning strategies with market dynamics effectively.
Learning Objectives
In studying “Bar Chart Patterns” for the CMT Exam, you should learn to identify and interpret various bar chart patterns, including inside bars, outside bars, reversal bars, and exhaustion bars. Analyze how these patterns reveal market sentiment, potential trend reversals, and continuations. Evaluate the implications of volume in confirming bar chart signals and understand the importance of context, such as trend direction and support or resistance levels. Additionally, explore how bar chart patterns can be used to anticipate price movements, identify entry and exit points, and apply these insights to trading strategies in technical analysis practice.
Bar Chart Patterns Overview
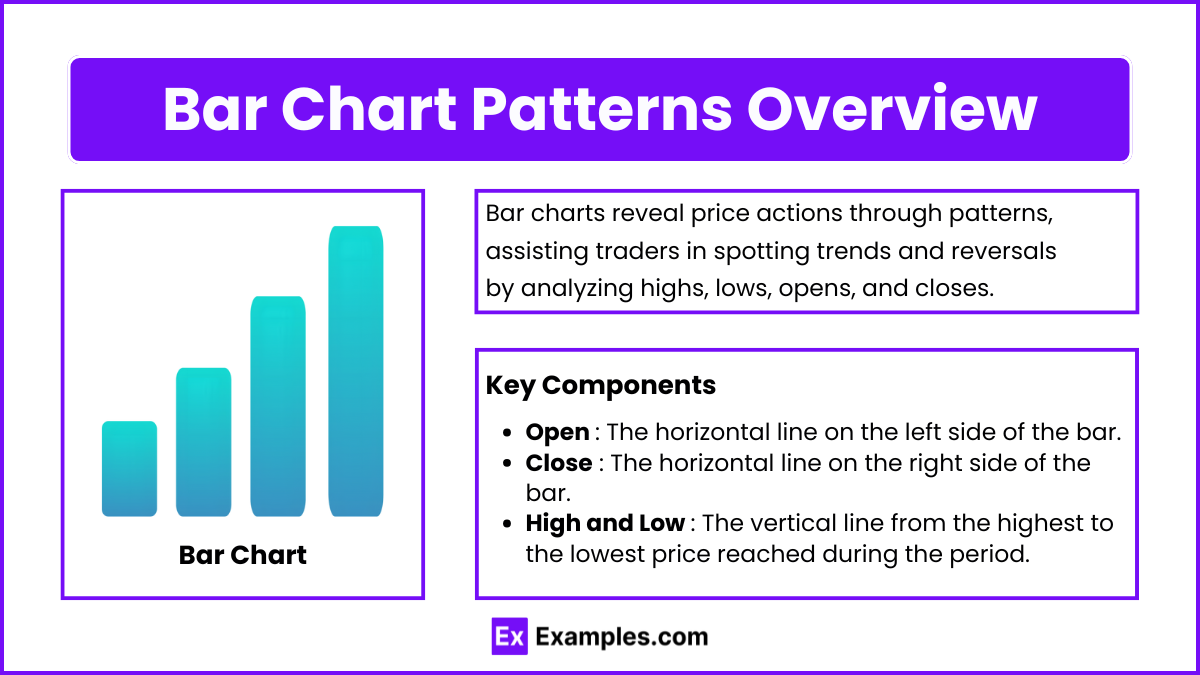
Bar charts are essential in technical analysis, displaying the opening, high, low, and closing prices for a specific period. Bar chart patterns help traders identify potential trend continuations or reversals based on price actions within these bars. They offer insight into market sentiment, volatility, and momentum.
Key Components of a Bar Chart
- Open: The horizontal line on the left side of the bar.
- Close: The horizontal line on the right side of the bar.
- High and Low: The vertical line from the highest to the lowest price reached during the period.
Understanding these elements provides a foundation for analyzing bar chart patterns.
Common Bar Chart Patterns
- Inside Bars
An inside bar is one where the price range is entirely contained within the previous bar’s high and low. This pattern signals consolidation or indecision in the market, often preceding a breakout. Traders watch for the next bar’s breakout direction to determine potential entry points. - Outside Bars
Also known as engulfing bars, outside bars occur when the current bar’s range completely engulfs the previous bar’s range. This pattern signifies a shift in market sentiment, often indicating a reversal when it appears after a strong trend. Outside bars suggest volatility and can lead to a directional change. - Reversal Bars
Reversal bars show a potential trend reversal. Bullish reversals have a low that’s below the previous bar’s low and a close near the high. Bearish reversals show the opposite, with a high above the previous bar’s high and a close near the low. These patterns are watched closely after prolonged trends as they hint at trend exhaustion. - Key Reversal Bars
Key reversal bars indicate a powerful trend shift. A bullish key reversal opens below the previous bar’s low and closes above the high, while a bearish key reversal opens above and closes below. These patterns are potent indicators of potential reversals. - Exhaustion Bars
This pattern shows a price spike followed by a reversal. The long bar indicates an intense buying or selling climax, followed by a strong counter-move. Exhaustion bars suggest that momentum has likely peaked, and a reversal is near.
Analyzing Bar Chart Patterns
- Trend Context: Patterns should be analyzed within the broader trend context. For instance, a bullish reversal bar is more significant in a downtrend, suggesting a potential trend change.
- Volume: Higher volume during these patterns often strengthens the signal, confirming the sentiment shift.
- Confirmation: Following up on the next few bars for confirmation helps validate whether the pattern signifies a real trend shift or is just market noise.
Trade Strategy Development with Bar Patterns
Bar chart patterns provide traders with visual cues about potential price movements, helping formulate strategic entry and exit points. By understanding how to set these points and manage risk effectively, traders can increase the likelihood of profitable outcomes while minimizing potential losses.
Entry and Exit Strategies Based on Bar Patterns
- Reversal Bars: Enter on trend break above/below reversal bar, exit if reversal falters.
- Inside Bars: Enter on breakout direction, exit if breakout fails.
- Outside Bars: Enter at high/low of the outside bar, exit on reversal weakness.
Examples
Example 1 : Inside Bar in a Consolidating Market
An inside bar forms when the price range of the current bar is entirely within the high and low of the previous bar. This pattern represents market indecision or consolidation, as neither buyers nor sellers are fully in control. Inside bars often precede a breakout in either direction, making them a valuable pattern for anticipating a significant price movement. Traders may look to enter a position when the price breaks above or below the inside bar’s range, using it as an entry signal.
Example 2 : Outside Bar as a Trend Reversal Signal
An outside bar, or engulfing bar, occurs when the price range of the current bar completely engulfs the previous bar’s range. This pattern suggests a reversal in market sentiment and is often seen at the end of strong trends. For example, a bullish outside bar in a downtrend may indicate an upcoming reversal to the upside, as buyers regain control. Traders use this pattern as a reversal signal, especially when it appears after a prolonged trend, often combining it with volume for confirmation.
Example 3 : Bullish Reversal Bar after a Downtrend
A bullish reversal bar appears when the current bar’s low is lower than the previous bar’s low, but the close is near the high. This indicates that, although sellers initially drove the price lower, buyers stepped in to push the price up, showing a potential reversal to the upside. This pattern is particularly useful at support levels, as it signifies that buying interest is strong enough to halt the downtrend. Traders view it as a signal to enter long positions, especially when it aligns with other support indicators.
Example 4 : Bearish Key Reversal Bar in an Uptrend
A bearish key reversal bar occurs when a bar opens above the previous bar’s high and closes below its low, signaling a potential trend reversal to the downside. This pattern typically forms at the peak of an uptrend, indicating that the buying pressure has weakened, and selling pressure has increased. Traders often see this as a strong bearish signal, using it to exit long positions or consider short positions, especially when the pattern is accompanied by high volume, which strengthens its validity.
Example 5 : Exhaustion Bar Indicating Trend Climax
An exhaustion bar forms when there’s a large spike in price, followed by a rapid reversal, suggesting that a trend is potentially ending. This bar often appears after a strong, prolonged trend, either upward or downward, showing a final push in one direction before the trend reverses. For example, an exhaustion bar in an uptrend might display a long high, followed by a close near the low, indicating that buyers are losing momentum. Traders use exhaustion bars as signals to prepare for a possible reversal or to tighten stop-losses on existing positions.
Practice Questions
Question 1
What does an “inside bar” pattern typically indicate in market analysis?
A. Continuation of the current trend
B. A market reversal signal
C. Market indecision or consolidation
D. Increased buying pressure
Answer: C. Market indecision or consolidation.
Explanation : An inside bar forms when the price range of the current bar is entirely within the high and low of the previous bar. This pattern represents a period of consolidation or indecision, as neither buyers nor sellers are in full control. Inside bars often precede a breakout, as market participants await confirmation of the next directional move. Traders closely monitor the breakout from this range to identify potential entry or exit points.
Question 2
Which of the following best describes an “outside bar” pattern?
A. The bar has a close that is below the open of the previous bar.
B. The bar’s range engulfs the previous bar’s range, indicating a potential reversal.
C. The bar has a higher high and a higher low than the previous bar.
D. The bar’s close is within the range of the previous bar, showing a continuation pattern.
Answer: B. The bar’s range engulfs the previous bar’s range, indicating a potential reversal.
Explanation: An outside bar, also known as an engulfing bar, occurs when the current bar’s range completely engulfs the previous bar’s range. This pattern often indicates a shift in market sentiment and signals a potential reversal in the trend. An outside bar at the top of an uptrend, for example, might suggest that sellers are taking control, hinting at a possible downward reversal. Traders use this pattern as a reversal signal, especially when supported by increased volume.
Question 3
What characteristic of a “key reversal bar” strengthens its validity as a trend reversal signal?
A. It appears after a series of inside bars.
B. It occurs with low trading volume.
C. It opens above or below the previous bar’s range and closes beyond the previous bar’s high or low.
D. It forms in the middle of a sideways trend.
Answer: C. It opens above or below the previous bar’s range and closes beyond the previous bar’s high or low.
Explanation : A key reversal bar is characterized by a significant shift in price action, where the bar opens outside the previous bar’s range and closes on the opposite side of the previous bar’s high or low. This pattern suggests a strong reversal signal, particularly when it occurs after a pronounced trend. For instance, a bearish key reversal bar in an uptrend that opens above and closes below the previous bar’s range indicates increased selling pressure, signaling that a potential trend reversal is likely. High volume accompanying this pattern further validates its reversal indication.

