Preparing for the CMT Exam requires a comprehensive understanding of “Basics of Cycle Analysis,” a crucial component of technical analysis. Mastery of identifying and understanding market cycles and their phases is essential. This knowledge provides insights into timing market entries and exits, crucial for achieving high accuracy in trading decisions.
Learning Objective
In studying “Basics of Cycle Analysis” for the CMT Exam, you should learn to understand the fundamental concepts and tools used to analyze market cycles. Analyze how identifying cycles can help determine optimal timing for entering and exiting trades. Evaluate the principles behind different cycle theories, including the time cycles and price cycles that influence market trends. Additionally, explore how these analytical methods are applied in real-world trading to forecast market movements and manage risk. Apply this knowledge to interpret and capitalize on repetitive patterns in financial markets, enhancing your ability to make informed trading decisions based on cycle analysis.
Introduction to Cycle Analysis

Cycle Analysis is the examination of recurring patterns and periodic trends within financial markets and economies. It helps investors and analysts anticipate market movements by identifying phases of growth and decline. Understanding cycle analysis allows for better decision-making and risk management in investment and business strategies.
Types of Cycles in Analysis
- Economic Cycles:
- Involve periods of growth (expansion) and decline (recession), affecting GDP, employment, and industrial production.
- Stock Market Cycles:
- Shorter cycles that reflect market trends driven by investor sentiment, earnings, and economic data.
- Credit Cycles:
- Reflect fluctuations in borrowing, lending, and credit availability, impacting financial stability and economic growth.
- Sector and Industry Cycles:
- Individual sectors may have their unique cycles due to specific influences like technological advancements or commodity prices.
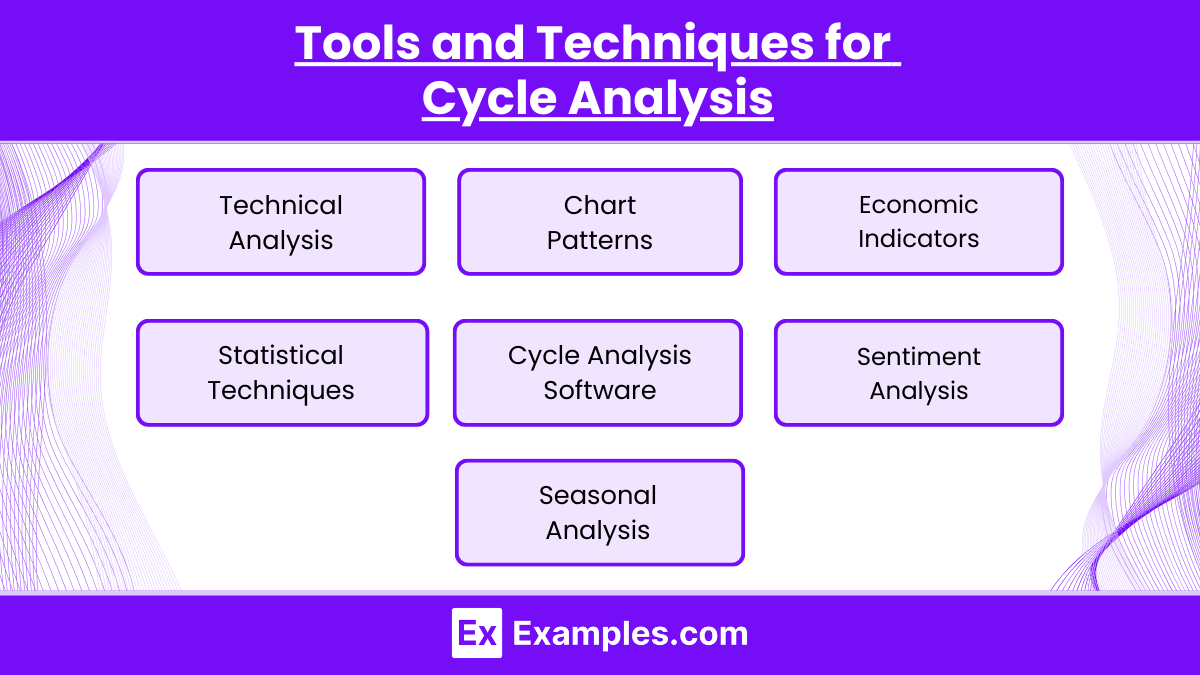
Tools and Techniques for Cycle Analysis

- Technical Analysis
- Moving Averages (MA): Smooths price data to identify trends.
- RSI (Relative Strength Index): Detects overbought/oversold conditions, indicating potential cycle reversals.
- MACD (Moving Average Convergence Divergence): Shows trend strength and direction changes.
- Chart Patterns
- Head and Shoulders, Double Tops/Bottoms: Identify phase changes, signaling market tops or bottoms.
- Elliott Wave Theory: Analyzes market movements as predictable wave patterns.
- Economic Indicators
- Leading Indicators: Predict future economic cycles (e.g., new orders, stock market performance).
- Lagging Indicators: Confirm trends after they occur (e.g., unemployment rate).
- Coincident Indicators: Reflect the current state of the economy (e.g., GDP).
- Statistical Techniques
- Fourier Analysis: Decomposes data into periodic functions to identify cycle lengths.
- Regression Analysis: Examines relationships between cycles and external economic variables.
- Cycle Analysis Software
- Specialized Tools: Visualize and detect time cycles, helping identify cycle timing and turning points.
- Sentiment Analysis
- Investor Surveys: Gauge market sentiment for potential phase shifts.
- VIX (Volatility Index): Measures market volatility, signaling potential cycle bottoms (high VIX) or complacency (low VIX).
- Seasonal Analysis
- Historical Data: Identifies recurring patterns tied to specific times of the year, useful for markets with predictable seasonality.
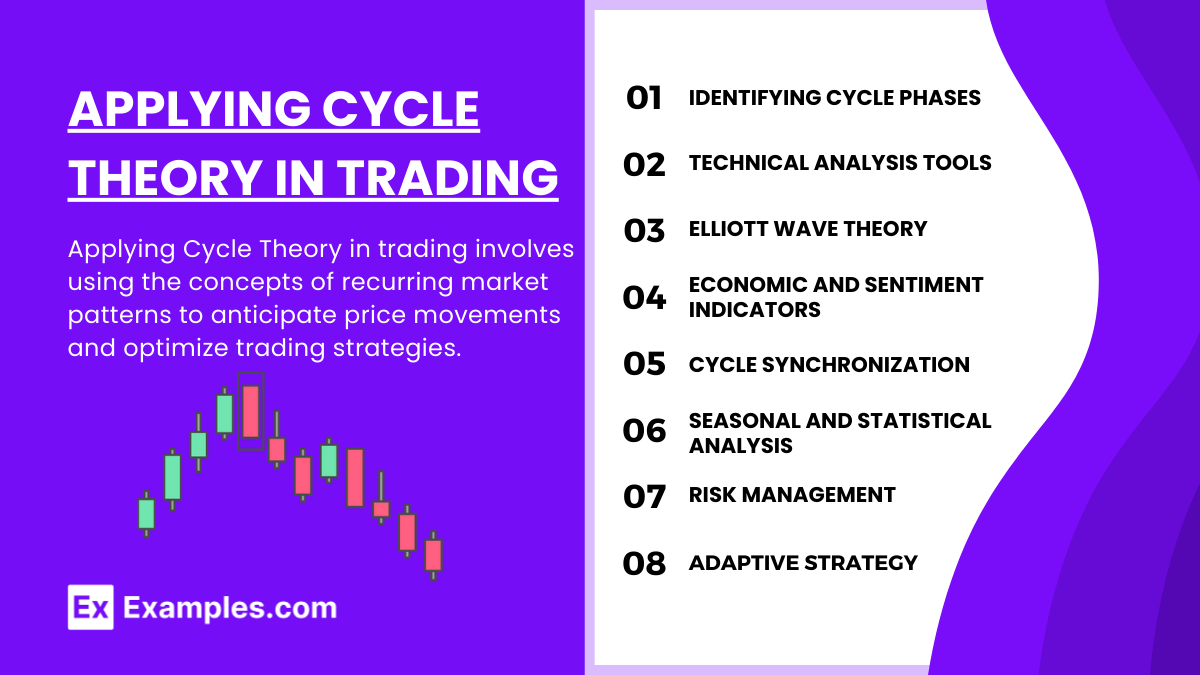
Applying Cycle Theory in Trading

Applying Cycle Theory in trading involves using the concepts of recurring market patterns to anticipate price movements and optimize trading strategies. Here’s how traders can leverage cycle theory effectively:
- Identifying Cycle Phases
- Expansion: Look for rising prices; take long positions.
- Peak: Watch for overbought signals (e.g., RSI, MACD).
- Contraction: Spot declining trends; consider short-selling.
- Trough: Identify potential buying opportunities at market lows.
- Technical Analysis Tools
- Moving Averages: Confirm trends and spot entry points.
- Oscillators (RSI, MACD): Detect overbought/oversold conditions.
- Chart Patterns: Use head and shoulders or double tops/bottoms for cycle reversals.
- Elliott Wave Theory
- Wave Patterns: Predict upcoming bullish/bearish movements.
- Wave Count: Identify 5-wave uptrends and 3-wave corrections for trade timing.
- Economic and Sentiment Indicators
- Leading Indicators: Use economic data to anticipate cycle changes.
- Sentiment (VIX): Gauge market sentiment for potential turning points.
- Cycle Synchronization
- Align Cycles: Combine different cycles (e.g., market and economic) for stronger signals.
- Confluence: Use multiple analyses for higher accuracy.
- Seasonal and Statistical Analysis
- Seasonal Trends: Identify recurring patterns in specific months.
- Fourier Analysis: Detect dominant cycle periods for better timing.
- Risk Management
- Stop-Loss Orders: Protect against unexpected cycle reversals.
- Diversification: Combine various cycle analysis methods to reduce risk.
- Adaptive Strategy
- Flexible Trading: Adjust strategies based on cycle phases.
- Continuous Monitoring: Update strategies as cycles evolve.
Examples
Example 1: Stock Market Index Cycles
Analysis of the S&P 500 over a 10-year period to identify major economic cycles and their impact on stock market performance. By overlaying the business cycle data (expansion, peak, recession, recovery) with S&P 500 price movements, traders can better understand when to anticipate bullish or bearish trends.
Example 2: Currency Exchange Rate Fluctuations
Using cycle analysis to predict turning points in the USD/EUR exchange rate. By applying Fourier analysis, traders can isolate the dominant cycles influencing exchange rate movements, assisting in strategic entry and exit decisions for currency trades.
Example 3: Commodity Price Cycles
Studying the price cycles in the crude oil market, particularly focusing on the impact of geopolitical events, supply-demand imbalances, and seasonal trends. Oscillators such as the RSI or Stochastic can be used to pinpoint cycle lows and highs, offering trade setups during oversold or overbought conditions.
Example 4: Real Estate Cycles
Examination of historical real estate market data to identify long-term price cycles influenced by interest rate changes, economic growth, and demographic shifts. Understanding these cycles helps real estate investors make informed decisions about the timing of property purchases and sales.
Example 5: Bond Yield Cycles
Analyzing the yield cycles of U.S. Treasury bonds to forecast interest rate movements. By understanding the typical duration and amplitude of interest rate cycles, bond investors can optimize their portfolio’s duration and convexity to maximize returns or minimize interest rate risk.
Practice Questions
Question 1
What is a primary characteristic of a market cycle in technical analysis?
A. Constant amplitude
B. Predictable economic indicators
C. Repetitive patterns of price movements
D. Fixed duration between cycles
Answer:
C. Repetitive patterns of price movements
Explanation:
A fundamental aspect of market cycles in technical analysis is the identification of repetitive patterns of price movements. These patterns help analysts predict future market behavior based on historical trends. Unlike the options suggesting constant amplitude and fixed duration, cycles can vary in these characteristics, making the recognition of repetitive patterns crucial.
Question 2
Which tool is commonly used to smooth out price data and help identify cycles in financial markets?
A. Bollinger Bands
B. Moving averages
C. Economic calendars
D. Balance sheets
Answer:
B. Moving averages
Explanation:
Moving averages are widely used in technical analysis to smooth out price data, which helps to identify underlying trends and cycles by filtering out the noise of short-term price fluctuations. This makes it easier to see cycles and trends in market data compared to other tools like Bollinger Bands, which are more often used for measuring volatility.
Question 3
How does cycle analysis primarily benefit traders and investors?
A. By providing exact dates for future market crashes
B. By identifying potential trend reversals and continuations
C. By guaranteeing returns on investments
D. By eliminating market risk
Answer:
B. By identifying potential trend reversals and continuations
Explanation:
Cycle analysis benefits traders and investors by helping them identify potential trend reversals and continuations, which can guide their trading decisions. It aids in understanding when markets might turn, allowing for strategic entries and exits in positions. This analytical approach does not provide exact dates for market events nor guarantee returns, nor does it eliminate market risk, making option B the most accurate description of its benefits.


