Preparing for the CMT Exam requires a comprehensive understanding of “Candle Pattern Forecasting and Trading Techniques,” a crucial component of technical analysis. Mastery of various candlestick patterns aids in predicting future market movements. This knowledge provides insights into market sentiment, potential reversals, and trend continuations, critical for achieving a high CMT score.
Learning Objective
In studying “Candle Pattern Forecasting and Trading Techniques” for the CMT Exam, you should learn to understand the various candlestick patterns and their predictive abilities in financial markets. Analyze how specific patterns, such as dojis, hammers, engulfing patterns, and morning stars, indicate potential market movements, reversals, or continuations. Evaluate the psychological and market sentiment principles that underpin these candle formations. Additionally, explore how these candlestick patterns can be effectively combined with other technical indicators like moving averages, volume, and RSI to refine trading strategies and improve predictive accuracy. Apply this knowledge to real-world trading scenarios to enhance market entry and exit decisions.
Introduction to Candlestick Patterns
Candlestick patterns are an essential tool in the arsenal of any trader involved in technical analysis, providing deep insights into market sentiment and potential price movements. These patterns, which originated in Japan over 300 years ago, are used widely in the trading of stocks, currencies, commodities, and other financial instruments. Understanding candlestick patterns can help traders make informed decisions by revealing potential market reversals, continuations, and momentum shifts.
Basic Candlestick Patterns
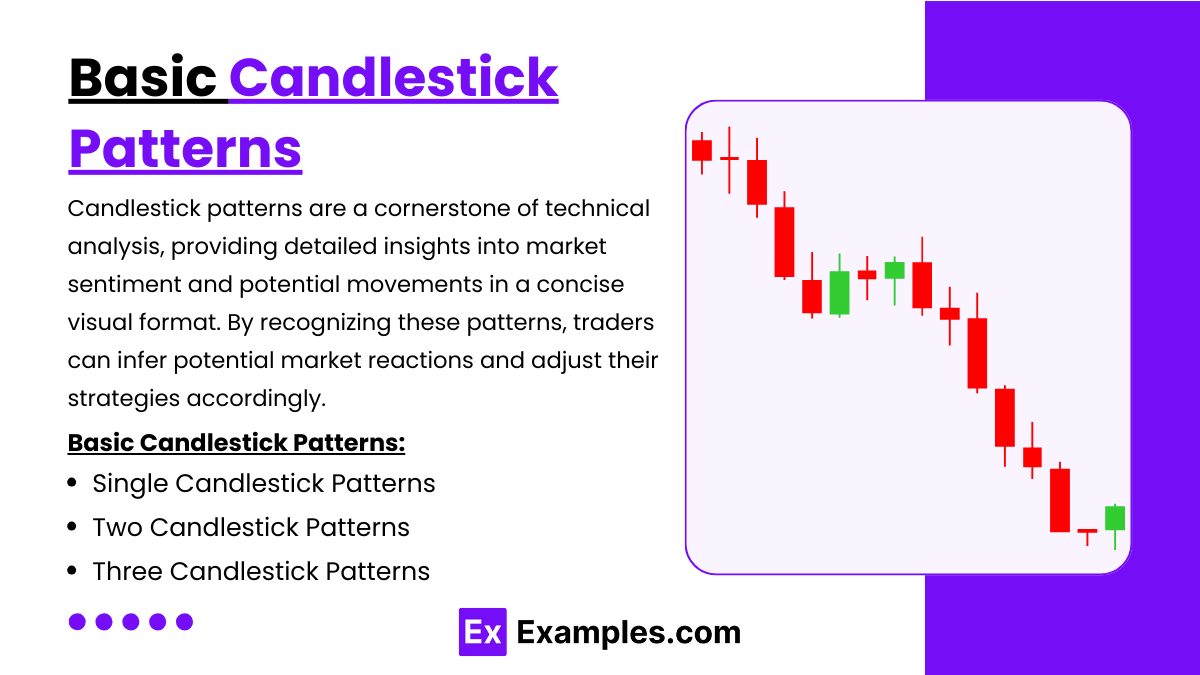
Candlestick patterns are a cornerstone of technical analysis, providing detailed insights into market sentiment and potential movements in a concise visual format. By recognizing these patterns, traders can infer potential market reactions and adjust their strategies accordingly. Here’s an overview of some basic candlestick patterns that are vital for traders at all levels:
Single Candlestick Patterns
- Doji: Indicates indecision in the market; the open and close prices are virtually the same.
- Hammer/Inverted Hammer: Signals potential bullish reversals. The Hammer has a small body and long lower shadow, suggesting buying pressure. The Inverted Hammer, similar in shape but appearing at the bottom of downtrends, suggests potential upside reversal.
- Shooting Star/Hanging Man: Both are reversal indicators. The Shooting Star, appearing after a price increase, has a small lower body and long upper shadow, indicating selling pressure. The Hanging Man appears similar but occurs after a price decline, signaling a potential bearish reversal.
Two Candlestick Patterns
- Bullish/Bearish Engulfing: A two-candle pattern where the first candle is smaller and is completely engulfed by the second, larger candle. A Bullish Engulfing pattern suggests a shift from bearish to bullish sentiment, while a Bearish Engulfing indicates the opposite.
- Tweezer Tops and Bottoms: Tweezer Tops feature two consecutive candles touching the same high point, indicating resistance and a potential bearish reversal. Tweezer Bottoms touch the same low point, signaling support and a potential bullish reversal.
Three Candlestick Patterns
- Morning Star/Evening Star: Indicate reversals. The Morning Star, a bullish pattern, consists of a long bearish candle, a short candle, and a long bullish candle. The Evening Star, the bearish counterpart, features a long bullish candle, a short candle, and a long bearish candle.
Complex Candlestick Patterns
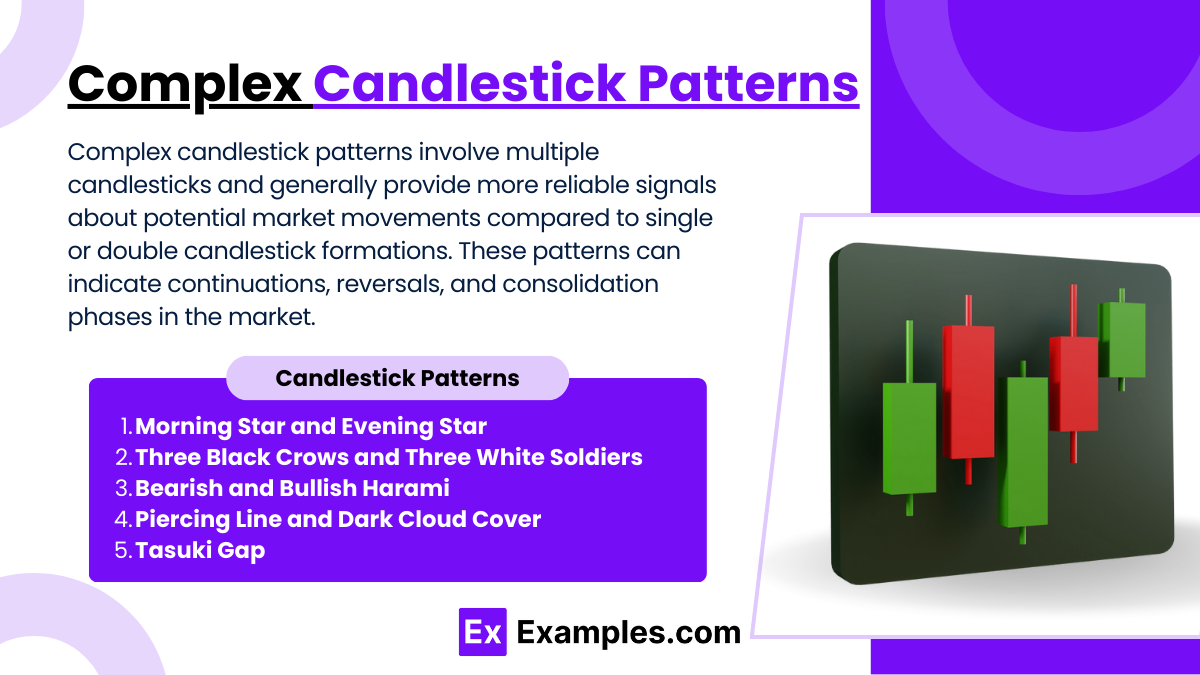
Complex candlestick patterns involve multiple candlesticks and generally provide more reliable signals about potential market movements compared to single or double candlestick formations. These patterns can indicate continuations, reversals, and consolidation phases in the market. Here’s an overview of some of the more intricate candlestick patterns that traders look for:
Key Complex Candlestick Patterns:
- Morning Star and Evening Star:
- Morning Star: A bullish reversal pattern consisting of three candles: a long bearish candle, a short-bodied or Doji candle that gaps lower, and a long bullish candle that closes into the body of the first candle.
- Evening Star: A bearish reversal pattern mirroring the Morning Star, featuring a long bullish candle, a short-bodied or Doji candle that gaps higher, and a long bearish candle that closes into the body of the first candle.
- Three Black Crows and Three White Soldiers:
- Three Black Crows: Indicates a strong bearish reversal, consisting of three long, consecutive bearish candles that close near their lows.
- Three White Soldiers: Suggests a strong bullish reversal, featuring three long, consecutive bullish candles that close near their highs.
- Bearish and Bullish Harami:
- Bearish Harami: A potential bearish reversal pattern occurring in an uptrend, marked by a large bullish candle followed by a small bearish candle entirely contained within the first candle’s body.
- Bullish Harami: A potential bullish reversal pattern occurring in a downtrend, consisting of a large bearish candle followed by a small bullish candle entirely contained within the first candle’s body.
- Piercing Line and Dark Cloud Cover:
- Piercing Line: A bullish reversal pattern featuring a long bearish candle followed by a bullish candle that opens at new lows but closes above the midpoint of the first candle’s body.
- Dark Cloud Cover: A bearish reversal pattern consisting of a long bullish candle followed by a bearish candle that opens at new highs but closes below the midpoint of the first candle’s body.
- Tasuki Gap:
- Bullish Tasuki Gap: A continuation pattern in an uptrend where two bullish candles with a gap between them are followed by a bearish candle that does not close the gap.
- Bearish Tasuki Gap: A continuation pattern in a downtrend where two bearish candles with a gap between them are followed by a bullish candle that does not close the gap.
Advanced Candlestick Trading Techniques
Advanced candlestick trading techniques involve the integration of complex candlestick patterns with other technical analysis tools to create robust trading strategies. These techniques help traders capitalize on nuanced market signals and better manage their risk. Here’s a look at how to elevate your candlestick trading by incorporating additional analytical tools and strategic approaches:
- Candlesticks and Trend Lines
- Combine candlestick patterns with trend lines to identify potential reversals or continuation signals at support or resistance levels.
- Candlesticks and Moving Averages
- Use candlestick patterns near moving averages to determine trend strength and potential reversal points. Patterns like Inverted Hammers near moving average lines can signal trend reversals.
- Candlesticks with Volume Analysis
- Confirm the strength of candlestick signals with volume analysis. High volume associated with candlestick formations like Three White Soldiers confirms bullish momentum.
- Candlesticks and Fibonacci Retracement
- Leverage Fibonacci retracement levels to find potential support or resistance areas where candlestick patterns may indicate reversals, such as a bearish Evening Star at a key Fibonacci level.
- Candlesticks with RSI and Stochastic Oscillators
- Use RSI and Stochastic indicators to identify overbought or oversold conditions. Candlestick patterns under these conditions can suggest imminent reversals, enhancing entry or exit strategies.
- Candlesticks and Bollinger Bands
- Interpret candlestick patterns in conjunction with Bollinger Bands to assess market volatility and potential price reversals, especially when patterns form near the bands’ edges.
Examples
Example 1: Bullish Engulfing Pattern in Forex Trading
In the EUR/USD currency pair, a smaller bearish candle is followed by a larger bullish candle that completely engulfs the previous day’s range. This bullish engulfing pattern suggests a reversal from a downtrend to an uptrend. Traders might use this as a signal to initiate long positions, anticipating further appreciation of the Euro against the Dollar.
Example 2: Bearish Harami at Stock Resistance Levels
A tech stock trading at a known resistance level forms a bearish harami, where a small bearish candle follows a larger bullish candle within its range. This pattern indicates potential exhaustion of the current uptrend and a possible reversal, prompting traders to consider taking profits or entering short positions.
Example 3: Doji at the Top of an Uptrend in Indices
In the S&P 500 index, a Doji forms after a prolonged uptrend, characterized by its small body with similar open and close prices, signaling indecision. The appearance of a Doji at peak levels can be a precursor to a trend reversal, making it a critical moment for traders to reassess their positions and potentially brace for a downturn.
Example 4: Morning Star Pattern in Commodity Markets
In the gold futures market, a three-candle morning star pattern develops at the end of a bearish trend. The setup includes a long bearish candle, a small-bodied candle that gaps down, and a long bullish candle that closes above the midpoint of the first day’s body. This pattern suggests a bullish reversal, indicating it might be time to consider buying gold.
Example 5: Piercing Line Pattern in Cryptocurrency
Bitcoin, after experiencing a sharp decline, forms a piercing line pattern where the second day’s price opens below the previous day’s low and closes more than halfway into the body of the first day’s bearish candle. This pattern suggests a strong buying pressure and potential reversal from bearish to bullish momentum, serving as a buy signal for cryptocurrency traders.
Practice Questions
Question 1
What does a bullish engulfing pattern typically indicate in a candlestick chart?
A. Continuation of the current downtrend
B. A potential bullish reversal following a downtrend
C. Confirmation of the ongoing bullish trend
D. Indecision between buyers and sellers
Answer:
B. A potential bullish reversal following a downtrend
Explanation:
A bullish engulfing pattern is characterized by a smaller bearish candle completely engulfed by a larger bullish candle. This pattern typically appears at the end of a downtrend and signals a potential reversal to an uptrend, as buyers have overtaken sellers and pushed the price beyond the previous session’s open.
Question 2
Which candlestick pattern is identified by a small body between long upper and lower shadows and indicates market indecision?
A. Marubozu
B. Doji
C. Engulfing
D. Hammer
Answer:
B. Doji
Explanation:
A Doji candlestick is characterized by having a very small body, showing that the opening and closing prices are almost the same, with long shadows that indicate significant price movement above and below the body. This pattern is indicative of indecision in the market as neither the bulls nor the bears can gain control.
Question 3
What does the appearance of a “Three Black Crows” pattern suggest in a market that was previously in an uptrend?
A. The market will likely experience a continuation of the uptrend.
B. There is immediate potential for a bullish reversal.
C. It signals a strong bearish reversal.
D. It confirms the stability of the current price level.
Answer:
C. It signals a strong bearish reversal.
Explanation:
The “Three Black Crows” pattern consists of three consecutive long-bodied bearish candles that open within the previous candle’s body and close lower, suggesting a strong reversal from a bullish to a bearish trend. This pattern indicates that sellers have taken control and that the uptrend could be ending, leading to a new bearish phase.

