Preparing for the CMT Exam requires a comprehensive understanding of “Candlestick Charting Essentials,” a crucial component of technical analysis. Mastery of candlestick patterns helps interpret market sentiment and price movements. This knowledge provides insights into trend reversals, continuations, and potential market dynamics, critical for achieving a high CMT score.
Learning Objective
In studying “Candlestick Charting Essentials” for the CMT Exam, you should learn to understand the various candlestick patterns and their implications in market analysis, including single, dual, and complex formations. Analyze how these patterns can indicate potential market movements, reversals, and continuations. Evaluate the psychological dynamics reflected by candlestick formations and the significance of candlestick placement in broader price trends. Additionally, explore how candlestick patterns can be combined with other technical analysis tools to enhance trade entry, exit strategies, and risk management. Apply this knowledge to real-world trading scenarios to improve your ability to predict market movements and develop strategic trading decisions.
Introduction to Candlestick Charting
Candlestick charting is a popular tool used in technical analysis of financial markets, providing a detailed and nuanced view of price movements over time. Originating from Japan over 300 years ago, candlestick charts were first used by rice traders and have since become a fundamental part of trading strategies across various asset classes including stocks, forex, and commodities. Here’s an introduction to candlestick charting, explaining its basics and how traders utilize these charts:
Basics of Candlestick Charting
Components of a Candlestick: Each candlestick represents trading activity for a specific period, such as a day, hour, or minute. A candlestick typically consists of four main components:
- Open: The price at the beginning of the trading period.
- Close: The price at the end of the trading period.
- High: The highest price during the trading period.
- Low: The lowest price during the trading period.
The body of the candlestick shows the open and close prices, while the lines extending above and below the body, known as “wicks” or “shadows,” indicate the high and low prices. If the close is above the open, the candlestick is often filled or colored (commonly green), indicating a net price gain. Conversely, if the close is below the open, the candlestick is typically hollow or colored differently (often red), indicating a net price loss.
Basic Candlestick Patterns
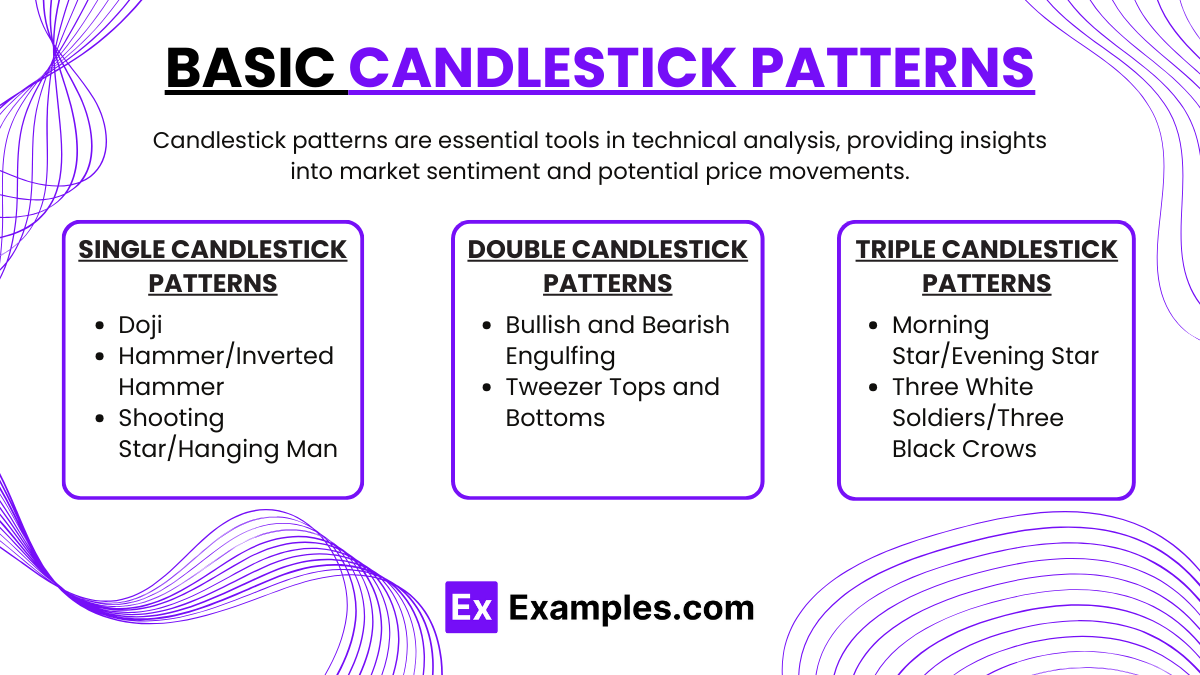
Candlestick patterns are essential tools in technical analysis, providing insights into market sentiment and potential price movements. Here’s a guide to some basic candlestick patterns that traders often use to gauge market direction and make trading decisions:
1.Single Candlestick Patterns
- Doji: Indicates market indecision. The open and close are the same, suggesting a struggle between buyers and sellers with no clear winner.
- Hammer/Inverted Hammer: Signals potential bullish reversals if they appear during a downtrend. The Hammer has a long lower shadow and small upper body, while the Inverted Hammer features a long upper shadow.
- Shooting Star/Hanging Man: These indicate potential bearish reversals. The Shooting Star appears at the end of an uptrend with a long upper shadow, while the Hanging Man appears at the end of a downtrend.
2.Double Candlestick Patterns
- Bullish and Bearish Engulfing: A Bullish Engulfing pattern features a small red candle completely covered by a larger green candle, suggesting a shift to bullish momentum. Conversely, a Bearish Engulfing pattern has a small green candle fully engulfed by a larger red candle, indicating growing bearish sentiment.
- Tweezer Tops and Bottoms: Tweezer Tops occur at the peak of an uptrend where two consecutive candlesticks have almost the same high point, signaling a potential bearish reversal. Tweezer Bottoms occur at a low point with similar lows, indicating a bullish reversal.
3.Triple Candlestick Patterns
- Morning Star/Evening Star: These three-candle patterns signal reversals. A Morning Star, indicating a bullish reversal, appears after a downtrend and features a setup of a large red candle, a smaller candle, and then a large green candle. An Evening Star, suggesting a bearish reversal, is the opposite configuration after an uptrend.
- Three White Soldiers/Three Black Crows: Three White Soldiers consist of three consecutive long green candles, each closing higher than the last, suggesting strong bullish momentum. Three Black Crows, consisting of three long red candles closing progressively lower, indicate a robust bearish trend.
Complex Candlestick Patterns
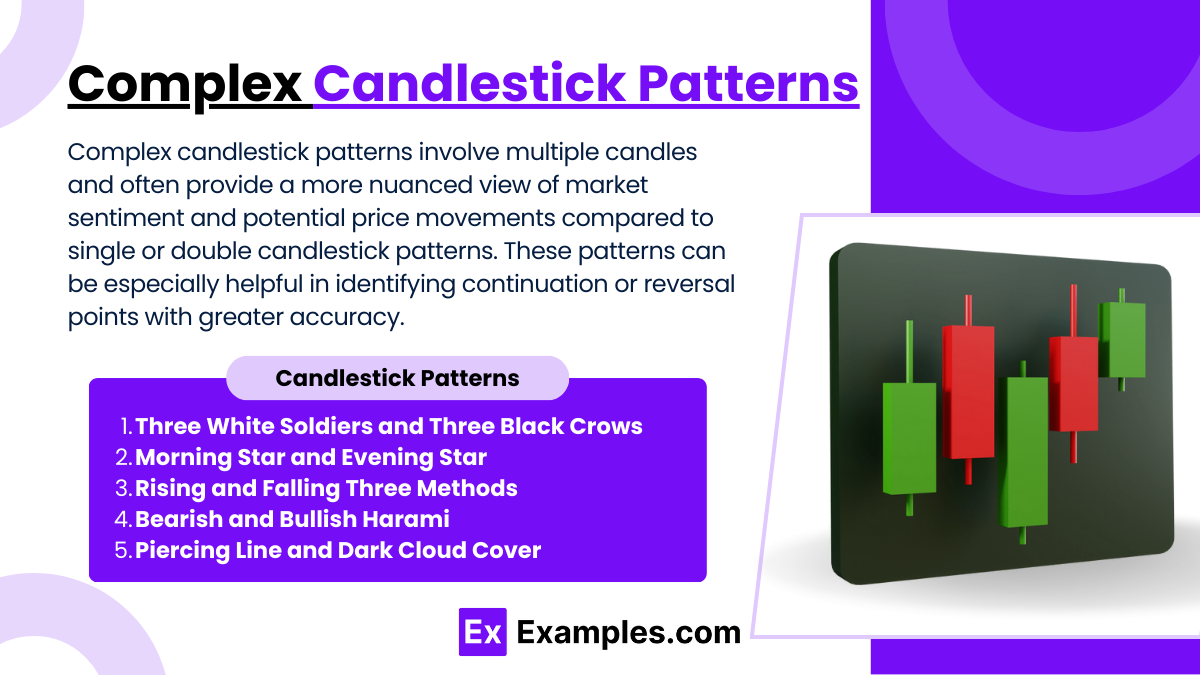
Complex candlestick patterns involve multiple candles and often provide a more nuanced view of market sentiment and potential price movements compared to single or double candlestick patterns. These patterns can be especially helpful in identifying continuation or reversal points with greater accuracy. Here’s a look at some advanced complex candlestick patterns:
- Three White Soldiers and Three Black Crows
- Three White Soldiers: A bullish pattern featuring three consecutive long green candles, each closing higher than the last, indicating a strong reversal from a downtrend.
- Three Black Crows: A bearish pattern with three consecutive long red candles, each closing lower than the previous, signaling a potential downtrend.
- Morning Star and Evening Star
- Morning Star: A bullish reversal pattern at the end of a downtrend, consisting of a long red candle, a small-bodied candle, and a large green candle closing into the first candle’s body.
- Evening Star: A bearish reversal pattern at the end of an uptrend, mirrored by a long green candle, a small-bodied candle, and a large red candle closing into the first candle’s body.
- Rising and Falling Three Methods
- Rising Three Methods: A bullish continuation pattern in an uptrend showing a long green candle, followed by three small red candles, and another long green candle surpassing the first.
- Falling Three Methods: A bearish continuation pattern in a downtrend consisting of a long red candle, three small green candles, and another long red candle breaking below the first.
- Bearish and Bullish Harami
- Bullish Harami: A potential bullish reversal pattern featuring a large red candle followed by a small green candle entirely within the first candle’s body.
- Bearish Harami: A potential bearish reversal pattern with a large green candle followed by a small red candle entirely within the first candle’s body.
- Piercing Line and Dark Cloud Cover
- Piercing Line: A bullish reversal pattern in downtrends, beginning with a long red candle and followed by a green candle that closes above the midpoint of the first candle’s body.
- Dark Cloud Cover: A bearish reversal pattern in uptrends, starting with a long green candle and followed by a red candle closing below the midpoint of the first candle’s body.
Combining Candlestick Patterns with Other Technical Tools
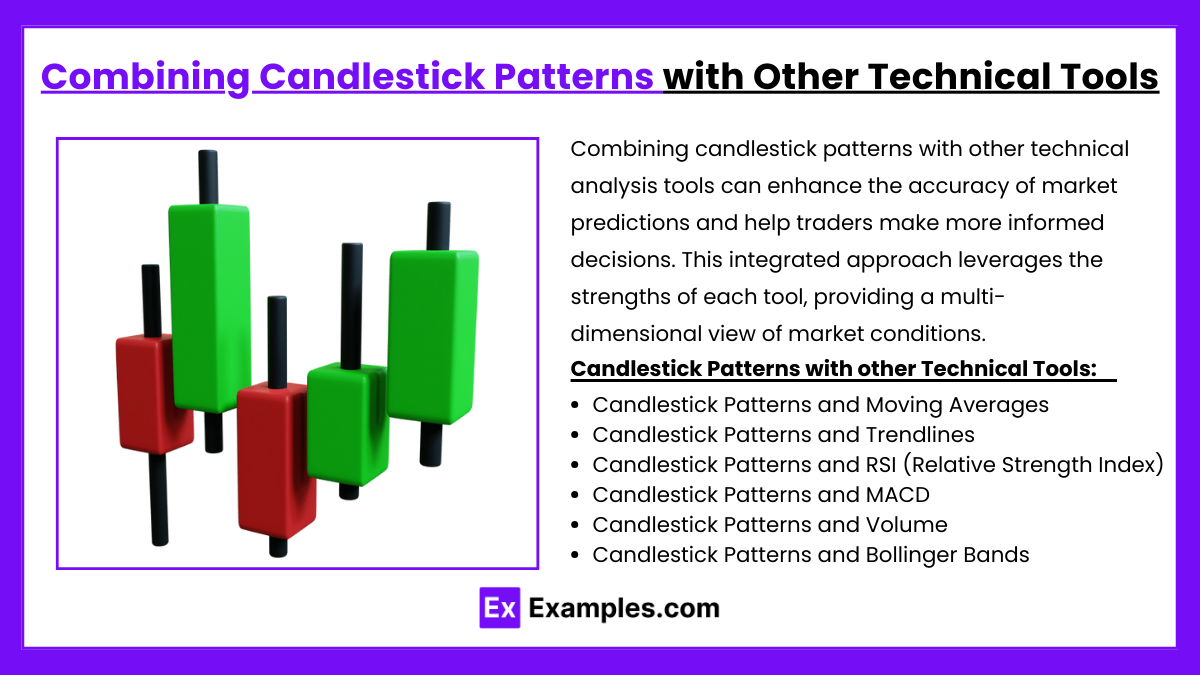
Combining candlestick patterns with other technical analysis tools can enhance the accuracy of market predictions and help traders make more informed decisions. This integrated approach leverages the strengths of each tool, providing a multi-dimensional view of market conditions. Here are some effective ways to combine candlestick patterns with other technical tools:
- Candlestick Patterns and Moving Averages
- Application: Use moving averages to establish the trend context. Bullish candlestick patterns near a rising moving average suggest a continuation of the uptrend, while bearish patterns near a declining moving average indicate a potential downtrend continuation.
- Candlestick Patterns and Trendlines
- Application: Apply trendlines to identify potential support and resistance levels. Candlestick reversal patterns at these points can signal entry or exit opportunities.
- Candlestick Patterns and RSI (Relative Strength Index)
- Application: Combine RSI readings with candlestick patterns to confirm overbought or oversold conditions. A reversal candlestick pattern near overbought or oversold levels suggests a potential price reversal.
- Candlestick Patterns and MACD (Moving Average Convergence Divergence)
- Application: Use MACD to confirm momentum changes suggested by candlestick patterns. A bullish crossover in MACD coupled with a bullish candlestick pattern can reinforce a buy signal.
- Candlestick Patterns and Volume
- Application: Check volume to validate candlestick patterns. An increase in volume during a candlestick formation like an engulfing pattern strengthens the signal.
- Candlestick Patterns and Bollinger Bands
- Application: Use Bollinger Bands to measure market volatility. Reversal patterns near the bands’ edges can indicate potential turning points, especially when combined with other indicators.
Examples
Example 1: Bullish Engulfing Pattern
A bullish engulfing pattern appears at the end of a downtrend on a daily chart of an S&P 500 ETF. This pattern, where a large white candle completely engulfs the previous day’s smaller black candle, signals a potential bullish reversal. Traders might consider this a buying opportunity, expecting a reversal of the prior downtrend.
Example 2: Bearish Harami
In the context of an uptrend, a bearish harami forms on the NASDAQ composite index, where a small black candle is nestled inside the previous larger white candle. This pattern suggests a potential hesitation in bulls, indicating that a reversal or a significant pullback might be imminent.
Example 3: Doji at Resistance
A Doji candlestick forms right at a key resistance level on the Dow Jones Industrial Average chart. The Doji, characterized by its cross-like appearance indicating a close near its open, reflects indecision. This occurring at resistance might suggest a pause or a reversal in the upward momentum, useful for traders considering short positions.’
Example 4: Three Black Crows
A sequence of “Three Black Crows” appears on a weekly chart of a technology stock, indicating a strong bearish reversal. This pattern, consisting of three long, consecutive, bearish candles, suggests that bears have taken control from the bulls, which could be an indicator to sell or short-sell.
Example 5: Morning Star in a Forex Pair
A morning star pattern emerges on the EUR/USD currency pair chart during a sustained downtrend. This three-candle bullish reversal pattern, starting with a long bearish candle, followed by a short candle that gaps down, and concluding with a long bullish candle that closes in the top half of the first candle’s body, suggests that a reversal to an uptrend may occur. Forex traders might use this pattern to initiate long positions.
Practice Questions
Question 1
What does a Doji candlestick typically indicate about market conditions?
A. Strong continuation of the current trend
B. High volatility in the market
C. Market indecision and potential reversal
D. Rapid price increase
Answer:
C. Market indecision and potential reversal
Explanation:
A Doji candlestick, characterized by its cross-like appearance where the opening and closing prices are nearly identical, typically indicates market indecision. This pattern suggests that neither buyers nor sellers could gain the upper hand during the trading period, and it often occurs near market turning points, signaling a potential reversal.
Question 2
Which candlestick pattern is considered a bullish reversal indicator and consists of three consecutive long-bodied candles?
A. Three Black Crows
B. Three White Soldiers
C. Bullish Engulfing
D. Bearish Harami
Answer:
B. Three White Soldiers
Explanation:
The Three White Soldiers pattern, which consists of three consecutive long-bodied white (or green) candles, each closing higher than the previous day, is considered a bullish reversal indicator. This pattern typically emerges at the end of a downtrend, signaling a strong shift from bearish to bullish market sentiment.
Question 3
What does a Bearish Engulfing pattern typically signify in a chart?
A. Continuation of the current bullish trend
B. The end of a bearish trend and the start of a bullish trend
C. A potential bearish reversal after a bullish trend
D. Increased market volatility without a clear trend
Answer:
C. A potential bearish reversal after a bullish trend
Explanation:
A Bearish Engulfing pattern occurs when a small bullish candle is followed by a large bearish candle that completely engulfs the body of the previous candle. This pattern typically signifies that selling pressure has overwhelmed buying pressure, suggesting a potential bearish reversal after a period of bullish trend. This is a critical signal for traders to consider taking profits or preparing for a potential downward movement.

