De-Bubbling for Alpha Generation focuses on identifying and navigating speculative bubbles to optimize returns while managing risk. This topic explores methods to detect overinflated market conditions and analyze price anomalies, enabling technical analysts to make strategic decisions that capture alpha. Emphasis is placed on recognizing bubble patterns, timing exits, and applying risk-adjusted strategies to maximize returns. Understanding de-bubbling techniques is essential for generating sustainable alpha, as it helps avoid the pitfalls of market exuberance and positions analysts to capitalize on undervalued opportunities within volatile markets.
Learning Objectives
In studying “De-Bubbling: Alpha Generation” for the CMT, you should learn to identify the concept of “de-bubbling” in financial markets and its role in generating alpha, or excess returns. Understand the process of analyzing and interpreting market bubbles, including the identification of inflated asset prices and market euphoria phases. Analyze strategies for de-risking portfolios by recognizing and mitigating bubble-related risks, focusing on timing exits and entry points to enhance alpha generation. Evaluate quantitative and technical indicators used in spotting bubbles and de-bubbling opportunities, such as price-volume trends, sentiment analysis, and fundamental divergences. Additionally, explore case studies of historical bubbles to gain insights into de-bubbling techniques that can be applied to optimize returns while managing risk in contemporary markets.
Understanding the Concept of De-Bubbling in Financial Markets
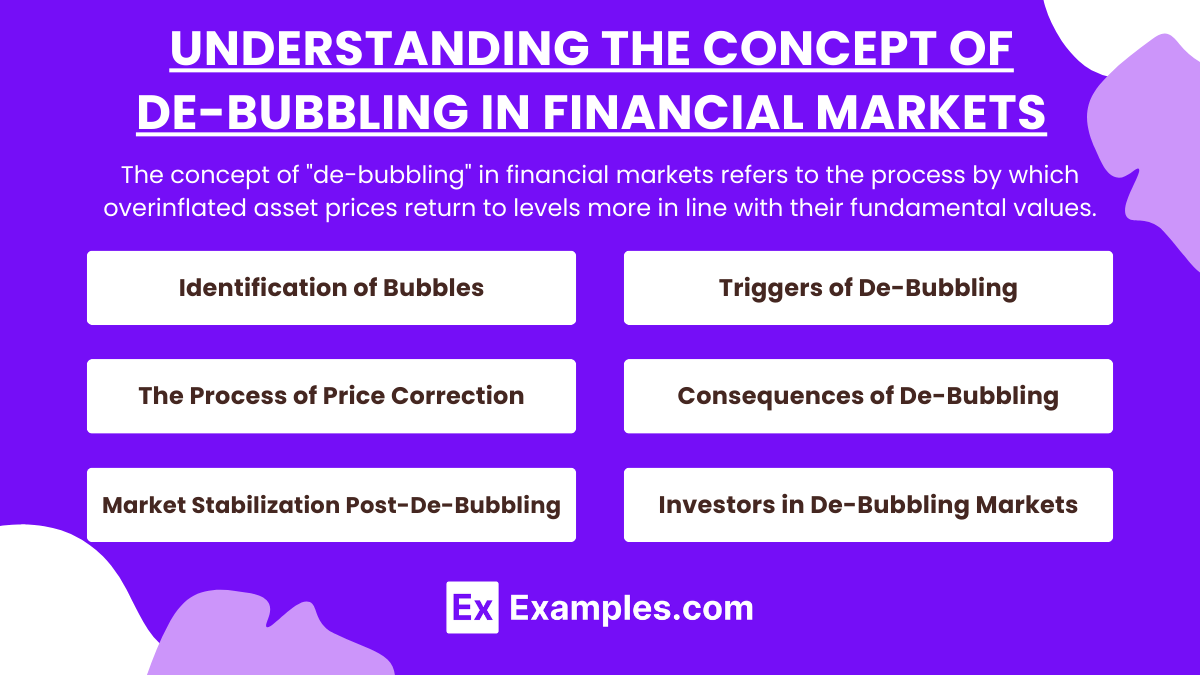
The concept of “de-bubbling” in financial markets refers to the process by which overinflated asset prices return to levels more in line with their fundamental values. This adjustment typically happens after a period of excessive speculation, where asset prices become disconnected from intrinsic worth, creating a financial bubble. When markets “de-bubble,” they undergo a correction or crash, bringing prices back to sustainable levels and restoring market stability over time. Here’s a closer look at how de-bubbling occurs and its implications:
1. Identification of Bubbles
- Bubbles often arise when there’s widespread investor enthusiasm, leading to rapid price increases fueled by speculation rather than fundamentals.
- Indicators like skyrocketing valuations, unusually high price-to-earnings (P/E) ratios, and herd behavior signal that an asset may be in a bubble.
- Economic cycles or shifts, such as low interest rates encouraging risk-taking, also contribute to the formation of bubbles.
2. Triggers of De-Bubbling
- Interest Rate Changes: Central banks may raise interest rates to cool overheated markets, making borrowing more expensive and slowing down speculative investments.
- Regulatory Interventions: Governments may impose new regulations to curb excessive speculation and stabilize the market.
- Market Corrections: A single event, such as a large-scale sell-off or a change in economic conditions, can trigger a sell-off, creating a snowball effect as more investors rush to sell.
3. The Process of Price Correction
- Rapid Decline in Prices: As the bubble bursts, asset prices fall sharply as supply exceeds demand, with investors eager to exit their positions.
- Return to Fundamental Values: Once speculative investments exit the market, asset prices generally stabilize closer to their fundamental values.
- Market Volatility: De-bubbling periods are often highly volatile as investors react to ongoing price changes, seeking to minimize losses or capitalize on emerging opportunities.
4. Consequences of De-Bubbling
- Investor Losses: Sharp declines in prices lead to significant losses for those heavily invested at bubble peaks.
- Economic Impact: If the bubble was large enough (e.g., housing in 2008), the correction can lead to economic slowdowns, affecting jobs, consumer spending, and even global markets.
- Psychological Shift: De-bubbling often results in a more cautious investor sentiment, reducing speculative investments and reinforcing more disciplined market behavior.
5. Market Stabilization Post-De-Bubbling
- After prices reach sustainable levels, markets typically enter a recovery phase where valuations align with economic fundamentals, such as earnings and growth rates.
- Regulatory or structural changes may emerge post-bubble to prevent future speculative excesses, adding new rules or oversight mechanisms.
- Historical cycles show that while de-bubbling can be painful in the short term, it often paves the way for more stable and sustainable growth in the long term.
6. Investors in De-Bubbling Markets
- Risk Management: Diversifying portfolios, limiting leverage, and setting stop-loss orders can protect investors during a de-bubbling phase.
- Focus on Fundamentals: Prioritizing investments in fundamentally strong assets can mitigate the risks associated with speculative bubbles.
- Long-Term Perspective: By focusing on long-term goals rather than short-term market trends, investors can weather market corrections and benefit from eventual recoveries.
Analyzing and Interpreting Market Bubbles
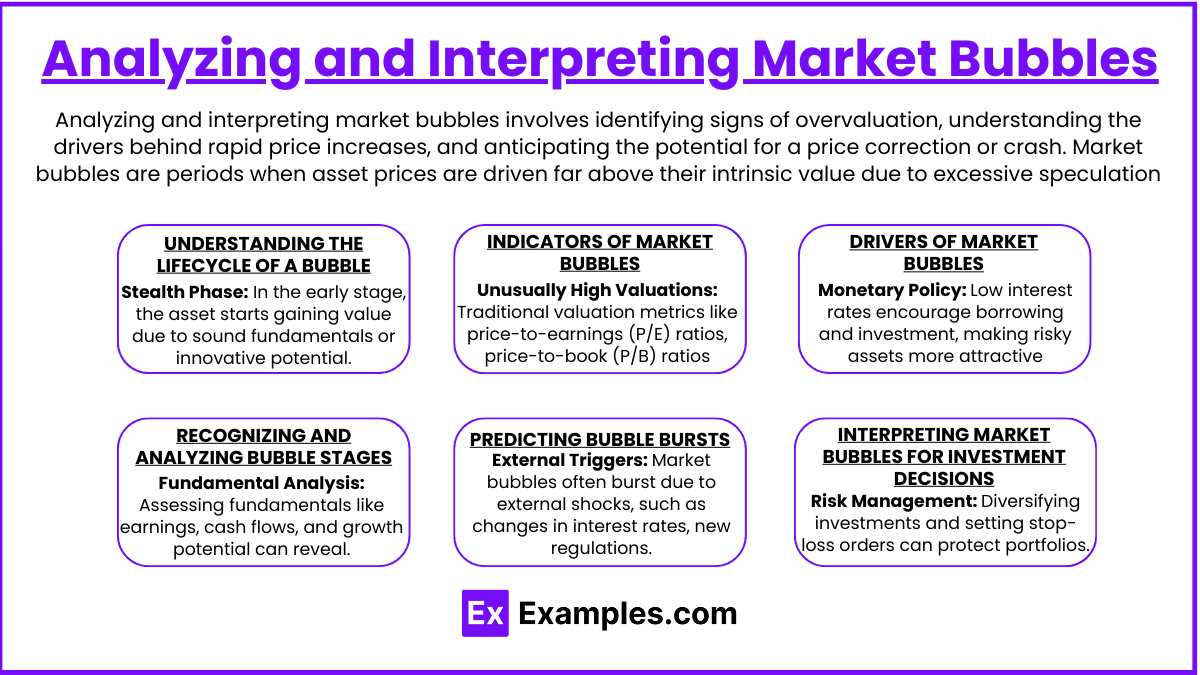
Analyzing and interpreting market bubbles involves identifying signs of overvaluation, understanding the drivers behind rapid price increases, and anticipating the potential for a price correction or crash. Market bubbles are periods when asset prices are driven far above their intrinsic value due to excessive speculation, exuberant investor sentiment, and often unsustainable economic conditions. Here’s a detailed look at the key aspects involved in analyzing and interpreting market bubbles:
1. Understanding the Lifecycle of a Bubble
- Stealth Phase: In the early stage, the asset starts gaining value due to sound fundamentals or innovative potential, often attracting informed investors and insiders.
- Awareness Phase: As prices rise, more investors notice the trend, and positive news or analysis drives wider interest, attracting more buyers.
- Mania Phase: Prices escalate rapidly as speculation grows, with media coverage and “get-rich-quick” stories fueling a frenzy. Prices now far exceed the asset’s intrinsic value.
- Blow-Off Phase: Eventually, prices reach unsustainable highs. A trigger event (e.g., policy changes or negative news) sparks a sell-off, causing a rapid decline as investors rush to exit, leading to a collapse in prices.
2. Indicators of Market Bubbles
- Unusually High Valuations: Traditional valuation metrics like price-to-earnings (P/E) ratios, price-to-book (P/B) ratios, or dividend yields indicate excessive overpricing.
- Herd Behavior: When investors collectively buy into a particular asset or asset class, often disregarding fundamentals, it may signal irrational exuberance.
- Leverage and Margin Levels: Excessive borrowing and high margin levels often accompany bubbles, as investors increase exposure to take advantage of rising prices.
- High Trading Volumes and Volatility: Bubbles often feature a sharp increase in trading volume and price volatility as speculators enter and exit positions rapidly.
3. Drivers of Market Bubbles
- Monetary Policy: Low interest rates encourage borrowing and investment, making risky assets more attractive and often leading to increased speculation.
- Technological or Financial Innovation: Innovations, such as the internet in the 1990s or cryptocurrencies more recently, can attract investment based on future growth potential, even when profits are uncertain.
- Psychological Factors: Greed, fear of missing out (FOMO), and overconfidence play significant roles as investors bid prices higher with unrealistic expectations of returns.
- Media Influence: Coverage from news outlets and social media amplifies interest in the asset, often exaggerating potential gains and creating hype.
4. Recognizing and Analyzing Bubble Stages
- Fundamental Analysis: Assessing fundamentals like earnings, cash flows, and growth potential can reveal if prices are unjustifiably high. If valuation metrics reach historical highs, it could indicate a bubble.
- Sentiment Analysis: Tracking investor sentiment through surveys, news trends, and online forums can help gauge market enthusiasm and detect excessive optimism.
- Technical Analysis: Price charts often show parabolic price increases during a bubble. Technical indicators like the Relative Strength Index (RSI) can highlight overbought conditions.
5. Predicting Bubble Bursts
- External Triggers: Market bubbles often burst due to external shocks, such as changes in interest rates, new regulations, or economic downturns. Monitoring macroeconomic conditions can provide warning signs.
- Liquidity Issues: Bubbles can also burst when liquidity tightens. If investors find it harder to buy or sell assets easily, it may signal an impending correction.
- Valuation Corrections: When investors begin recognizing that prices are unsustainable, a slow revaluation can begin, eventually snowballing as selling pressure grows.
6. Interpreting Market Bubbles for Investment Decisions
- Risk Management: Diversifying investments and setting stop-loss orders can help protect portfolios in case of a bubble burst.
- Timing Market Exits: It’s challenging to time exits perfectly, but taking profits gradually when valuations peak can lock in gains without fully exiting an asset.
- Avoiding Panic Selling: Understanding that bubbles are temporary phenomena can help investors avoid panic selling during corrections, especially if they hold fundamentally strong assets.
- Long-Term Focus: While bubbles are typically unsustainable, quality assets with strong fundamentals can recover over the long term.
Strategies for De-Risking Portfolios Through De-Bubbling
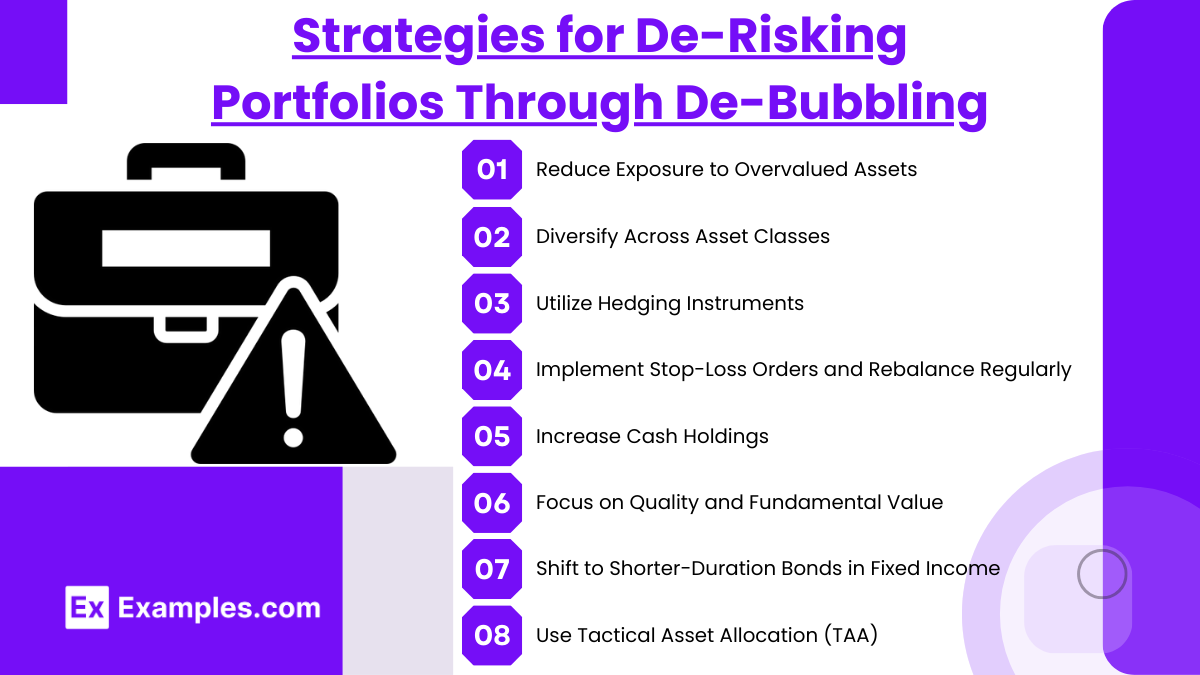
De-risking portfolios during a market bubble involves implementing strategies to protect capital and reduce exposure to overvalued assets. “De-bubbling” a portfolio refers to intentionally lowering risk by reallocating or exiting assets that may be prone to sharp declines if the bubble bursts. Here are some effective strategies for de-risking portfolios through de-bubbling:
1. Reduce Exposure to Overvalued Assets
- Identify Overpriced Sectors: Focus on sectors experiencing rapid price increases and high valuations, such as technology stocks during the dot-com bubble or real estate during the 2008 housing bubble.
- Gradual Divestment: Sell assets incrementally rather than all at once to lock in gains without disrupting the portfolio’s stability.
- Reallocate to Undervalued Sectors: Shift investments into sectors or asset classes that are less speculative and exhibit stronger fundamental value, such as utilities or consumer staples.
2. Diversify Across Asset Classes
- Increase Allocation in Stable Assets: Consider increasing exposure to bonds, commodities (e.g., gold), and other traditionally less volatile assets, which can provide stability and counterbalance riskier investments.
- Invest in Non-Correlated Assets: Assets like precious metals, real estate investment trusts (REITs), or international securities tend to have lower correlations with the bubble sector, reducing portfolio volatility.
- Incorporate Defensive Stocks: Allocate a portion of the portfolio to defensive stocks that are less sensitive to economic cycles, such as healthcare and utility companies, which tend to perform relatively well during downturns.
3. Utilize Hedging Instruments
- Put Options: Purchase put options on overvalued assets or sectors to hedge against potential declines. Put options provide the right to sell an asset at a set price, limiting losses if prices fall.
- Inverse ETFs and Short Positions: Consider using inverse ETFs or short positions on sectors with bubble-like characteristics to hedge portfolio risk. However, this approach requires careful management due to the high risk associated with shorting.
- Volatility Hedging: Use volatility-based instruments, such as options on the VIX (Volatility Index), which tend to increase in value during market downturns, providing a cushion against losses.
4. Implement Stop-Loss Orders and Rebalance Regularly
- Set Stop-Loss Levels: Place stop-loss orders on speculative assets to automatically sell if prices fall below a specific threshold. This ensures that losses are limited and profits are protected.
- Periodic Rebalancing: Regularly rebalance the portfolio to bring asset allocation back to target levels, reducing exposure to overvalued positions and aligning with risk tolerance.
- Dynamic Rebalancing: Adjust the portfolio more frequently when prices are highly volatile, selling overvalued assets and reinvesting in undervalued ones to maintain stability.
5. Increase Cash Holdings
- Maintain a Cash Reserve: Building cash reserves can provide liquidity to capitalize on buying opportunities post-correction while also reducing risk exposure during bubble phases.
- Invest in Short-Term Bonds or Money Market Funds: Consider allocating funds to short-term bonds or money market accounts to earn interest on cash holdings while retaining liquidity.
- Reduce Dependency on Margin: Lowering leverage by reducing margin debt minimizes the risk of forced liquidation and helps keep cash on hand for future opportunities.
6. Focus on Quality and Fundamental Value
- Prioritize High-Quality Assets: Invest in companies with strong fundamentals, such as consistent cash flows, low debt levels, and competitive advantages, which are generally better positioned to withstand downturns.
- Avoid Highly Speculative Assets: Minimize exposure to assets with high valuations but weak fundamentals, such as stocks with high P/E ratios or speculative cryptocurrencies.
- Dividend-Paying Stocks: Allocate more to dividend-paying stocks, which can provide steady income and are often more resilient during market corrections.
7. Shift to Shorter-Duration Bonds in Fixed Income
- Limit Duration Risk: Shorter-duration bonds are less sensitive to interest rate changes, providing stability and reducing risk during periods of economic uncertainty.
- Focus on High-Quality Bonds: Increase allocation to high-quality bonds (e.g., government or investment-grade bonds) over high-yield or junk bonds, which tend to be riskier during downturns.
- Consider Treasury Inflation-Protected Securities (TIPS): TIPS provide a hedge against inflation while offering lower volatility, serving as a safer fixed-income option during de-bubbling periods.
8. Use Tactical Asset Allocation (TAA)
- Adopt a Tactical Approach: Tactical asset allocation allows for dynamic shifts in asset weights based on market conditions, increasing flexibility to respond to changing valuations and risks.
- Adjust Based on Market Signals: Tactical moves to de-risk the portfolio during bubble conditions might involve overweighting defensive assets and underweighting speculative ones.
- Scenario Analysis: Use scenario analysis to understand how the portfolio might perform under different market conditions, helping guide tactical adjustments.
Quantitative and Technical Indicators for Spotting Bubbles and De-Bubbling Opportunities
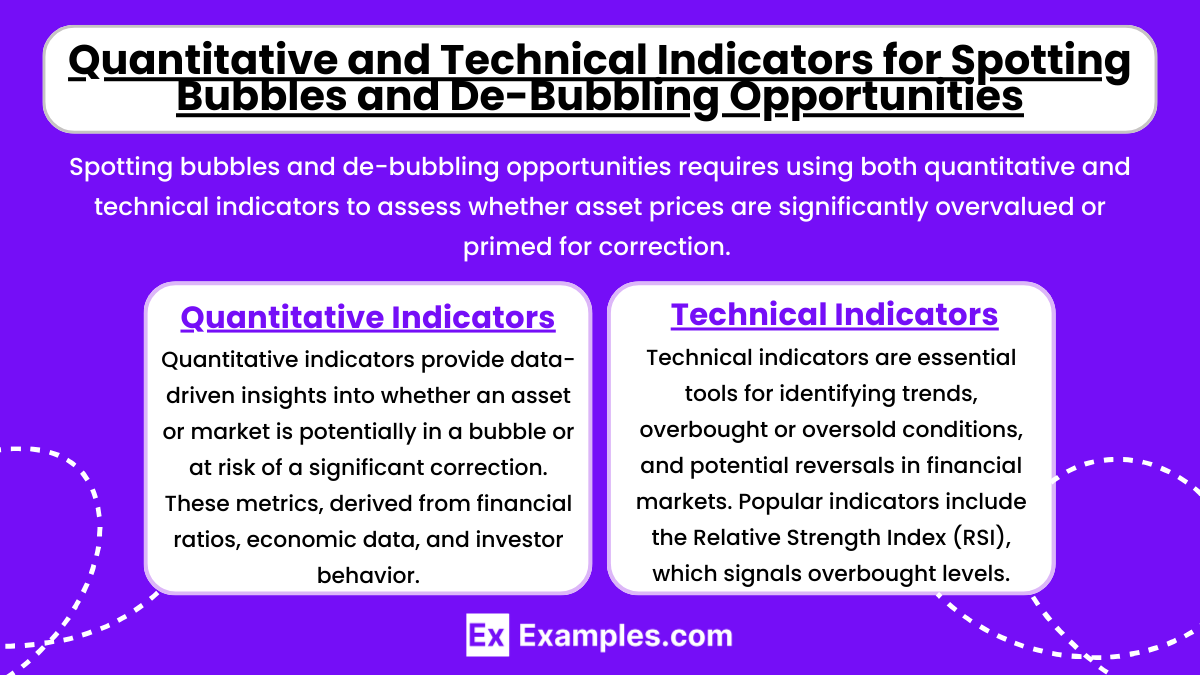
Spotting bubbles and de-bubbling opportunities requires using both quantitative and technical indicators to assess whether asset prices are significantly overvalued or primed for correction. These indicators help investors identify speculative excesses and signals that prices may revert to more sustainable levels. Here’s a guide to effective quantitative and technical indicators for detecting bubbles and de-bubbling opportunities:
Quantitative Indicators
Quantitative indicators provide data-driven insights into whether an asset or market is potentially in a bubble or at risk of a significant correction. These metrics, derived from financial ratios, economic data, and investor behavior, offer a more objective perspective on valuations compared to market sentiment alone.
- Price-to-Earnings (P/E) Ratio
- Sign of a Bubble: A very high or rapidly increasing P/E ratio suggests overvaluation, with asset prices rising far above earnings.
- Interpretation: When P/E ratios significantly exceed historical norms or industry averages, it may indicate a bubble. Comparisons with long-term averages, such as the historical average P/E of the S&P 500, provide perspective on potential overvaluation.
- Shiller P/E (Cyclically Adjusted P/E) Ratio
- Sign of a Bubble: Shiller P/E adjusts earnings for inflation over a 10-year period, smoothing out temporary fluctuations.
- Interpretation: A Shiller P/E ratio well above historical averages can indicate that prices are significantly overinflated, potentially signaling a bubble. During the 2000 dot-com bubble, for example, the Shiller P/E hit unprecedented highs.
- Price-to-Sales (P/S) Ratio
- Sign of a Bubble: A high P/S ratio indicates investors are paying a premium for each dollar of revenue, often due to speculative expectations rather than fundamental value.
- Interpretation: P/S ratios above historical levels or sector benchmarks can signal overvaluation. For instance, tech stocks during the 2021-2022 period exhibited high P/S ratios, despite limited earnings.
- Dividend Yield Compression
- Sign of a Bubble: Lower dividend yields can signal inflated prices, as investors bid up prices relative to dividends.
- Interpretation: Yields falling below historical averages in dividend-paying sectors, like utilities or real estate, may reflect overvaluation. Historically low yields can often indicate excessive investor optimism.
- Margin Debt Levels
- Sign of a Bubble: Increased borrowing signals leveraged speculation, a common behavior during bubbles.
- Interpretation: Rising levels of margin debt often indicate investors are highly leveraged, which amplifies risk if prices drop. Margin debt at record highs, as seen before the 2008 crash, can indicate a highly speculative market.
- Household Equity Allocation
- Sign of a Bubble: A large portion of household portfolios allocated to equities indicates high market exposure and speculative interest.
- Interpretation: Historically, high household equity allocations precede market corrections, as seen in 2000 and 2007. This metric provides a gauge of retail investor risk appetite.
- Credit Spreads
- Sign of a Bubble: Narrow credit spreads between high-yield and government bonds indicate high risk tolerance and speculative optimism.
- Interpretation: Tight spreads suggest investors are underpricing credit risk, often a feature of late-stage bubbles. Widening spreads may indicate a de-bubbling phase as risk aversion returns.
Technical Indicators
Technical indicators are essential tools for identifying trends, overbought or oversold conditions, and potential reversals in financial markets. Popular indicators include the Relative Strength Index (RSI), which signals overbought levels above 70 and oversold levels below 30, helping spot likely corrections. Moving Average Convergence Divergence (MACD) highlights momentum changes, with crossovers suggesting potential trend shifts. Bollinger Bands measure price volatility, with prices repeatedly hitting the upper band signaling potential overvaluation.
- Relative Strength Index (RSI)
- Sign of a Bubble: RSI values above 70 signal overbought conditions, often indicating speculative excess.
- Interpretation: Overbought RSI (above 70) often precedes a correction. RSI below 30, conversely, may indicate oversold conditions, presenting a de-bubbling opportunity.
- Moving Average Convergence Divergence (MACD)
- Sign of a Bubble: A positive divergence between short-term and long-term moving averages indicates upward momentum.
- Interpretation: In bubbles, MACD often remains well above zero. A negative crossover or MACD drop below zero may signal a reversal or de-bubbling phase.
- Bollinger Bands
- Sign of a Bubble: When prices move consistently above the upper Bollinger Band, it indicates strong buying pressure and potential overvaluation.
- Interpretation: Persistent moves beyond the upper band can signal bubble conditions. A return to the middle or lower band often marks the start of a de-bubbling phase.
- Parabolic SAR (Stop and Reverse)
- Sign of a Bubble: When prices are above the Parabolic SAR, it signals an uptrend, but it may be unsustainable if the trend is steep.
- Interpretation: A reversal of the Parabolic SAR to above price signals a potential trend change. This indicator is useful for spotting the end of speculative trends.
- Volume Analysis
- Sign of a Bubble: Bubbles often show unusually high trading volumes due to heavy speculative activity.
- Interpretation: Volume spikes on upward price moves indicate speculative interest. A volume decline alongside price increases or divergence between price and volume may signal de-bubbling.
- Trendlines and Breakouts
- Sign of a Bubble: Repeated breakouts from historical trend channels or sharp price increases indicate strong momentum.
- Interpretation: A breakdown below established trendlines can signal a de-bubbling phase. For example, during the 2008 housing crash, breaking trend support levels in housing-related stocks indicated de-bubbling.
- Exponential Moving Average (EMA) Crossovers
- Sign of a Bubble: Short-term EMAs (e.g., 50-day) above long-term EMAs (e.g., 200-day) reflect upward momentum.
- Interpretation: The “death cross,” when a short-term EMA crosses below a long-term EMA, suggests a potential downtrend, marking the start of a de-bubbling period.
- Fibonacci Retracement Levels
- Sign of a Bubble: Bubbles often extend far beyond typical retracement levels.
- Interpretation: When a correction retraces to key Fibonacci levels, such as 61.8% or 50%, it often indicates a price stabilization point and possible end of the de-bubbling phase.
Examples
Example 1: Trading Strategy Optimization
In the context of financial markets, de-bubbling refers to eliminating excess noise or short-term fluctuations from a trading strategy’s performance. Alpha generation involves creating strategies that consistently outperform the market. De-bubbling helps to identify genuine alpha, removing the impact of temporary market bubbles or overreaction, which may skew performance analysis.
Example 2: Quantitative Analysis in Hedge Funds
Hedge funds often use de-bubbling techniques to refine their models for alpha generation. By filtering out market distortions caused by hype or irrational exuberance, fund managers can identify true signals and trends. De-bubbling ensures that the alpha generated is not just a result of short-term market bubbles but is driven by sustainable and effective investment strategies.
Example 3: Risk-Adjusted Returns in Asset Management
In asset management, de-bubbling helps to separate genuine risk-adjusted returns from the effects of market volatility or speculative bubbles. By smoothing out extreme market fluctuations, managers can better evaluate the actual value added by their investment strategies, focusing on consistent, long-term alpha generation rather than temporary market shifts.
Example 4: Algorithmic Trading Models
De-bubbling is used in algorithmic trading models to filter out transient market movements that don’t reflect underlying trends. The goal is to fine-tune the trading algorithms to generate alpha, ensuring that the trades executed are based on fundamental price movements rather than short-term noise, which might lead to less profitable outcomes.
Example 5: Portfolio Management in Volatile Markets
In volatile market conditions, de-bubbling helps portfolio managers focus on the core investment thesis by reducing the impact of short-term speculative trends. By isolating and removing the effects of speculative bubbles, de-bubbling ensures that alpha generation is based on real investment insights and not driven by market psychology or speculative spikes.
Practice Questions
Question 1
What is the primary goal of de-bubbling in the context of alpha generation?
A) To increase the volatility of the portfolio
B) To eliminate noise and isolate true market trends
C) To maximize short-term gains
D) To reduce the size of the portfolio
Correct Answer: B) To eliminate noise and isolate true market trends.
Explanation: The primary goal of de-bubbling is to remove market noise or short-term distortions (such as bubbles) that do not reflect the underlying fundamental trends. By eliminating this “noise,” investors can focus on generating sustainable alpha, which is the excess return above the market average driven by the investor’s strategy or insights, rather than temporary market fluctuations.
Question 2
How does de-bubbling impact the performance evaluation of an investment strategy?
A) It ensures the strategy outperforms the market in every time period.
B) It removes short-term market fluctuations from performance, allowing for a more accurate assessment of alpha.
C) It reduces the importance of long-term trends in strategy evaluation.
D) It primarily focuses on the impact of macroeconomic trends on performance.
Correct Answer: B) It removes short-term market fluctuations from performance, allowing for a more accurate assessment of alpha.
Explanation: De-bubbling allows for a clearer view of an investment strategy’s true performance by filtering out the effects of short-term market volatility and speculative bubbles. This leads to a more accurate evaluation of alpha, showing the actual performance of the strategy relative to the broader market, without being distorted by fleeting market conditions.
Question 3
Which of the following best describes the effect of de-bubbling on risk-adjusted returns?
A) It lowers the risk by avoiding speculative bubbles.
B) It artificially inflates returns by ignoring market risks.
C) It increases the short-term volatility of the portfolio.
D) It makes the risk-adjusted returns harder to evaluate.
Correct Answer: A) It lowers the risk by avoiding speculative bubbles.
Explanation: De-bubbling helps to reduce the risk associated with speculative bubbles, which can lead to sharp, temporary losses when the bubble bursts. By removing these distortions, de-bubbling allows for a more stable and realistic assessment of risk-adjusted returns. This leads to more sustainable and predictable performance, focusing on true alpha generation rather than short-term market mispricing.

