Preparing for the CMT Exam requires a comprehensive understanding of “Foundations of Cycle Theory,” a crucial component of technical analysis. Mastery of identifying and interpreting cycles in market data is essential. This knowledge provides insights into market trends, timing trades, and predicting future movements, critical for achieving a high CMT score.
Learning Objective
In studying “Foundations of Cycle Theory” for the CMT Exam, you should learn to understand the fundamental concepts and analytical tools used to identify and analyze cycles within financial markets. Analyze how cycles reflect underlying economic, political, and psychological factors influencing market behavior. Evaluate the principles behind identifying peaks, troughs, and duration of cycles using various technical indicators and charting methods. Additionally, explore how these cycle theories are applied to forecast market movements and make trading decisions. Apply this knowledge to real-world data, enhancing your ability to recognize patterns and predict future market trends based on historical cycle analysis.
Introduction to Cycle Theory

Cycle Theory refers to the study of economic and financial market fluctuations that occur in periodic, wave-like patterns. Understanding these cycles helps economists, investors, and businesses anticipate changes in economic conditions and make informed decisions.
Applications of Cycle Theory
- Economic Forecasting: Predicts economic upturns or downturns to help businesses and policymakers prepare.
- Investment Strategy: Guides asset allocation and market timing based on expected phases of the cycle.
- Risk Management: Assists in identifying potential downturns and mitigating financial risks.
Understanding Market Cycles

Market cycles are recurring phases of growth and decline that financial markets go through over time. These cycles are influenced by economic trends, investor sentiment, and various external factors. Understanding market cycles helps investors and businesses make informed decisions, manage risk, and optimize their investment strategies.
Types of Market Cycles
- Bull Markets: Periods of rising prices, characterized by optimism, economic growth, and strong investor confidence.
- Bear Markets: Periods of declining prices, often associated with economic downturns and widespread pessimism.
- Sector Cycles: Different sectors of the market may go through cycles independently of the overall market, influenced by factors like technological advancements or changes in commodity prices.
- Secular vs. Cyclical:
- Secular Cycles: Long-term trends that can last 10-20 years, marked by prolonged bull or bear periods.
- Cyclical Cycles: Shorter-term cycles within the broader secular trend, often lasting several months to a few years.
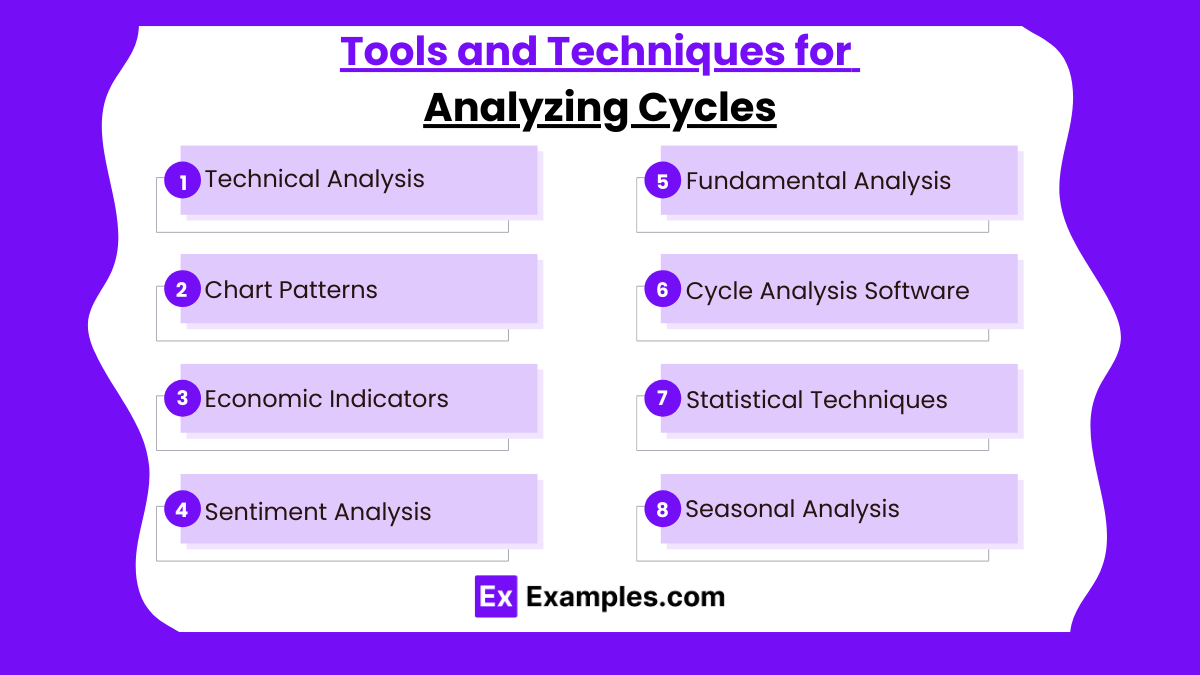
Tools and Techniques for Analyzing Cycles

Analyzing market and economic cycles involves using various tools and techniques to identify patterns, predict phases, and make informed investment and business decisions. Here’s a look at some essential tools and techniques:
- Technical Analysis
- Moving Averages (MA): Identifies trends by smoothing out price data.
- RSI: Detects overbought/oversold conditions for potential reversals.
- MACD: Signals trend changes and momentum shifts.
- Chart Patterns
- Head and Shoulders, Double Tops/Bottoms: Indicate cycle peaks or troughs.
- Elliott Wave Theory: Predicts future movements using wave patterns.
- Economic Indicators
- Leading: Predict future cycles (e.g., new orders).
- Lagging: Confirm existing trends (e.g., unemployment).
- Coincident: Show current economic conditions (e.g., industrial production).
- Sentiment Analysis
- Investor Surveys: Gauge confidence for potential cycle changes.
- VIX (Volatility Index): Indicates market fear or complacency.
- Fundamental Analysis
- Earnings Reports: Track corporate performance to assess cycles.
- Economic Reports: GDP, employment, and inflation to identify cycle phases.
- Cycle Analysis Software
- Specialized Tools: Visualize cycle timing and turning points.
- Statistical Techniques
- Fourier Analysis: Detects periodicity in data.
- Regression Analysis: Examines variable impacts on cycles.
- Seasonal Analysis
- Historical Data: Identifies patterns in market behavior tied to specific times of the year.
Cycle Theory in Market Forecasting

Cycle Theory in market forecasting is the study of recurring patterns in economic and market activities to predict future trends and movements. It’s based on the idea that market behavior follows identifiable cycles influenced by economic, financial, and psychological factors.
Examples
Example 1: Stock Market Cycles
Analysis of the U.S. stock market using the 18-year real estate cycle theory, which correlates major peaks and troughs in the stock market with real estate cycle highs and lows. Discussion on how this theory could have been applied to predict the 2008 financial crisis and subsequent recovery.
Example 2: Commodity Price Cycles
Examination of gold prices over several decades to identify long-term commodity cycles. Applying cycle analysis to forecast significant turning points in gold prices based on geopolitical tensions, inflation expectations, and changes in central bank policies.
Example 3: Currency Exchange Rate Cycles
Use of cycle theory to analyze and predict major trends and reversals in the EUR/USD exchange rate. Highlighting the impact of economic announcements, interest rate differentials, and economic cycles of the Eurozone and the United States on currency movements.
Example 4: Interest Rate Cycles
Application of cycle theory to the bond market, specifically analyzing the yield curve cycles of U.S. Treasury bonds. Discussing the implications of cyclical changes in interest rates on bond pricing, duration management, and bond portfolio strategies.
Example 5: Sector Rotation Based on Business Cycles
Employing cycle theory to implement a sector rotation strategy that capitalizes on the cyclical nature of the economy. Identifying phases of the business cycle (expansion, peak, recession, recovery) and rotating investments among sectors such as consumer discretionary, utilities, industrials, and technology based on predicted economic conditions.
Practice Questions
Question 1
What is the primary purpose of applying cycle theory in technical analysis?
A. To determine the exact price at which to enter and exit trades
B. To predict the timing of market highs and lows based on historical patterns
C. To identify the fundamental economic causes of market movements
D. To calculate the intrinsic value of securities
Answer:
B. To predict the timing of market highs and lows based on historical patterns
Explanation:
The primary purpose of applying cycle theory in technical analysis is to predict the timing of market highs and lows. Cycle theory is based on the observation that markets exhibit patterns and rhythms over time, and understanding these patterns can help forecast future market movements.
Question 2
Which type of chart is most commonly used in cycle analysis to identify recurring patterns in market data?
A. Pie chart
B. Bar chart
C. Point and figure chart
D. Line chart
Answer:
D. Line chart
Explanation:
Line charts are most commonly used in cycle analysis because they clearly show the movement of prices over time, making it easier to identify recurring patterns and trends. Line charts are straightforward and effective in displaying closing prices connected by a continuous line, highlighting cycles in market data.
Question 3
Which of the following indicators is commonly used alongside cycle theory to identify potential reversal points within a market cycle?
A. Moving averages
B. Economic indicators
C. Balance sheets
D. Income statements
Answer:
A. Moving averages
Explanation:
Moving averages are commonly used alongside cycle theory to smooth out price data and help identify potential reversal points within a market cycle. By applying moving averages, traders can see the broader trend and detect when the price begins to deviate from its average, suggesting a possible cycle reversal or continuation.


