Indexes are fundamental to understanding market performance, serving as benchmarks for various asset classes and sectors. This topic covers the construction, types, and applications of indexes, including price-weighted, market-cap-weighted, and equal-weighted approaches. It explores how indexes represent market trends and investor sentiment, as well as their role in comparative analysis and portfolio management. Proficiency in this area is essential for interpreting market conditions, tracking sector performance, and utilizing index data in technical analysis to enhance decision-making and strategy development in financial markets.
Learning Objectives
In studying “Indexes” for the CMT, you should learn to understand the construction, calculation, and purpose of various types of indexes, incluIndexes play a vital role as benchmarks, offering investors and fund managers a point of reference to evaluate the performance of their investments. By comparing an investment or portfolio to a relevant index, investors can better assess returns, manage risk, and make informed decisions. Here’s an overview of how indexes serve as benchmarks and why they’re important in investment strategy:ding price-weighted, market-cap-weighted, equal-weighted, and fundamentally weighted indexes. Recognize the role of indexes as benchmarks for measuring market performance and guiding investment strategies. Analyze how different index compositions impact volatility, risk, and return characteristics. Evaluate the significance of major global indexes, such as the S&P 500, Dow Jones Industrial Average, and MSCI indexes, in reflecting economic and market trends. Additionally, develop an understanding of index rebalancing, adjustments, and the influence of index inclusion or exclusion on stock prices.
Understanding the Construction and Purpose of Various Types of Indexes
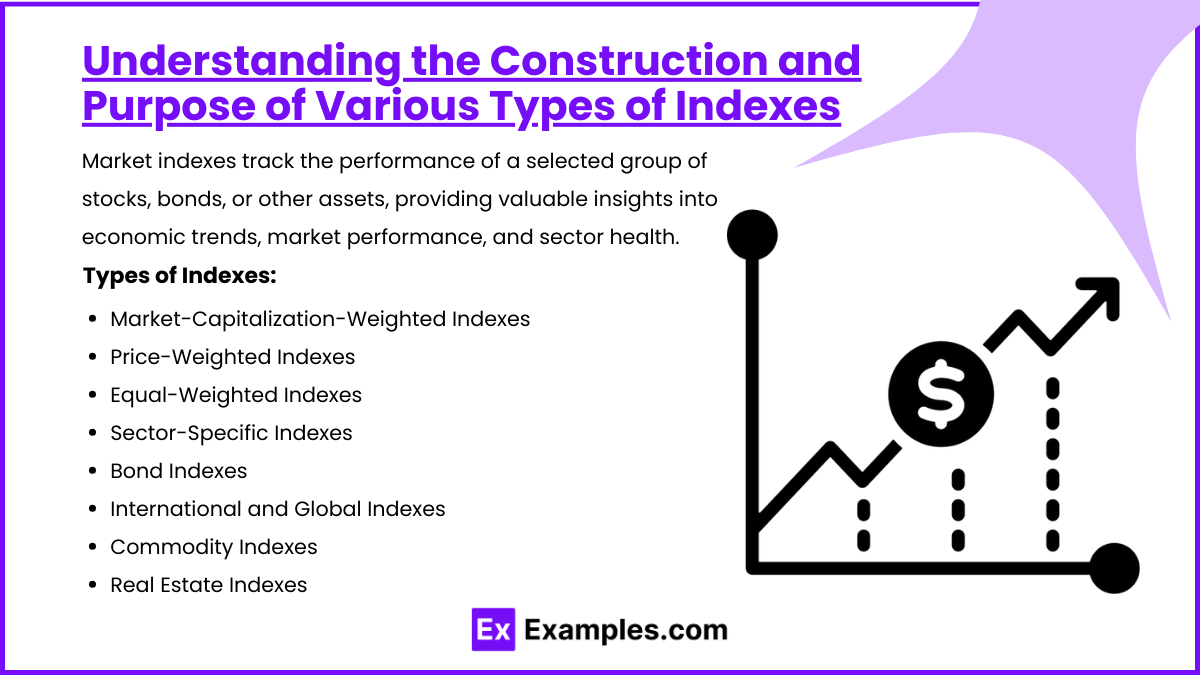
Market indexes track the performance of a selected group of stocks, bonds, or other assets, providing valuable insights into economic trends, market performance, and sector health. Each type of index serves a unique purpose, from offering a snapshot of the broader market to tracking specific industries or asset classes. Here’s an overview of the most common types of indexes, how they’re constructed, and their purposes.
1. Market-Capitalization-Weighted Indexes
In market-capitalization-weighted indexes, companies are weighted according to their market value (share price multiplied by the number of shares outstanding). Larger companies have a greater influence on the index’s movement.
- Purpose: Provides a realistic measure of market performance by reflecting the impact of larger companies.
- Example: The S&P 500 is a market-cap-weighted index, where companies like Apple and Microsoft have a larger impact on the index movement due to their high market cap.
2. Price-Weighted Indexes
Price-weighted indexes assign weights based on the stock prices of companies, meaning stocks with higher prices have more influence on the index’s performance, regardless of the company’s size.
- Purpose: Tracks performance based on stock price movements, offering a straightforward view of price changes across companies.
- Example: The Dow Jones Industrial Average (DJIA) is a price-weighted index where stocks with higher prices, such as those of major industrial firms, have a greater impact.
3. Equal-Weighted Indexes
Equal-weighted indexes give each company the same weighting regardless of its size or price, making them more reflective of the performance of smaller companies within the index.
- Purpose: Provides a balanced view of performance across all companies, emphasizing smaller firms equally with larger firms.
- Example: An equal-weighted S&P 500 index would give each company in the S&P 500 the same influence, resulting in a more balanced view of overall market performance.
4. Sector-Specific Indexes
Sector-specific indexes track the performance of companies within a specific industry or sector, such as technology, healthcare, or energy, offering insights into sector health and trends.
- Purpose: Allows investors to track and invest in specific industries, providing a focused measure of sector performance.
- Example: The NASDAQ-100 Technology Sector Index tracks major tech companies like Apple, Microsoft, and Alphabet, reflecting the health of the technology industry.
5. Bond Indexes
Bond indexes track a portfolio of bonds, such as government or corporate bonds, offering insight into interest rates, credit risk, and bond market trends.
- Purpose: Measures the performance of the bond market, helping investors assess income-generating assets and interest rate trends.
- Example: The Bloomberg Barclays U.S. Aggregate Bond Index is a widely followed bond index that includes U.S. government, corporate, and mortgage-backed securities.
6. International and Global Indexes
International and global indexes track the performance of stocks across different countries or regions, helping investors gauge global economic conditions and market trends.
- Purpose: Provides exposure to international markets, allowing investors to diversify outside of their home country.
- Example: The MSCI World Index tracks large and mid-cap companies across 23 developed markets, offering insight into global economic trends.
7. Commodity Indexes
Commodity indexes track the prices of raw materials and resources, such as oil, gold, and agricultural products, giving investors a sense of commodity price trends and inflation risks.
- Purpose: Reflects price movements in commodity markets, useful for investors interested in inflation hedging and resource market trends.
- Example: The S&P GSCI (Goldman Sachs Commodity Index) tracks a broad range of commodities, including energy, metals, and agriculture.
8. Real Estate Indexes
Real estate indexes track the performance of real estate investment trusts (REITs) and other property-related stocks, providing insights into real estate market trends.
- Purpose: Offers a measure of the real estate market’s health and allows investors to assess the performance of property investments.
- Example: The FTSE NAREIT All REITs Index tracks U.S. REITs, reflecting trends in the real estate sector, including commercial and residential properties.
The Role of Indexes as Benchmarks
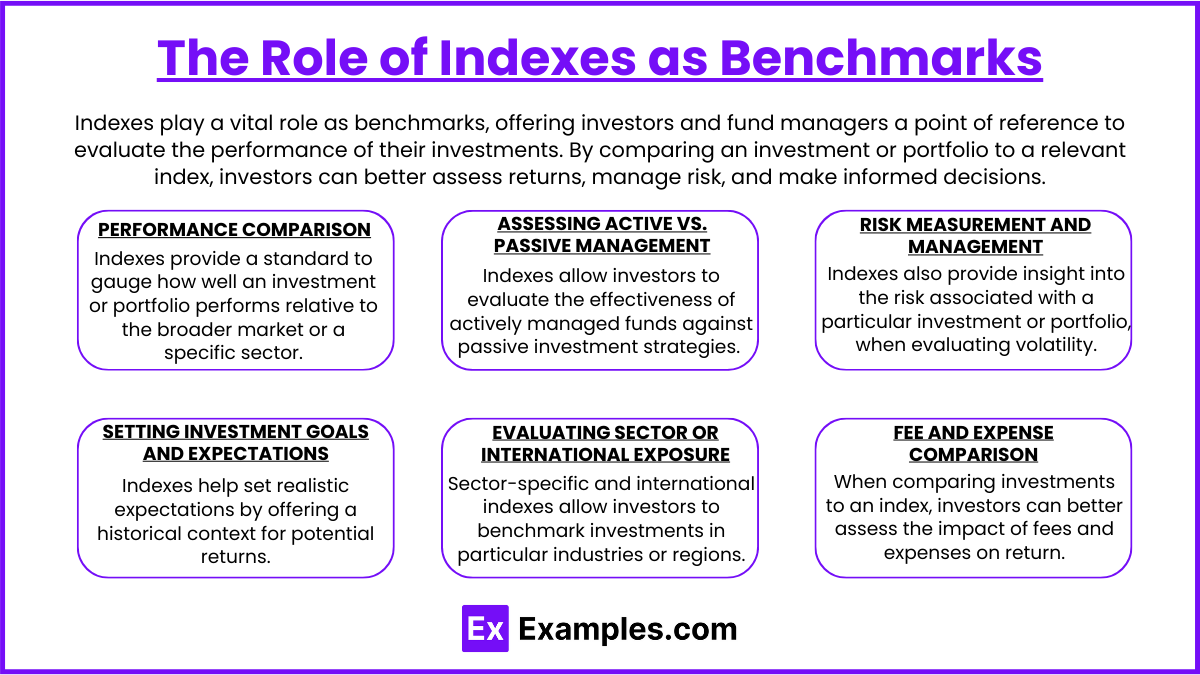
Indexes play a vital role as benchmarks, offering investors and fund managers a point of reference to evaluate the performance of their investments. By comparing an investment or portfolio to a relevant index, investors can better assess returns, manage risk, and make informed decisions. Here’s an overview of how indexes serve as benchmarks and why they’re important in investment strategy:
1. Performance Comparison: Indexes provide a standard to gauge how well an investment or portfolio performs relative to the broader market or a specific sector.
2. Assessing Active vs. Passive Management: Indexes allow investors to evaluate the effectiveness of actively managed funds against passive investment strategies. Passive funds aim to match the index’s performance, while active funds attempt to beat it.
3. Risk Measurement and Management: Indexes also provide insight into the risk associated with a particular investment or portfolio, especially when evaluating volatility and market exposure.
4. Setting Investment Goals and Expectations: Indexes help set realistic expectations by offering a historical context for potential returns. By understanding past performance, investors can make better choices about future investments.
5. Evaluating Sector or International Exposure: Sector-specific and international indexes allow investors to benchmark investments in particular industries or regions, providing insight into how specific parts of the market are performing.
6. Fee and Expense Comparison: When comparing investments to an index, investors can better assess the impact of fees and expenses on returns, especially with actively managed funds.
Impact of Index Composition on Volatility, Risk, and Return
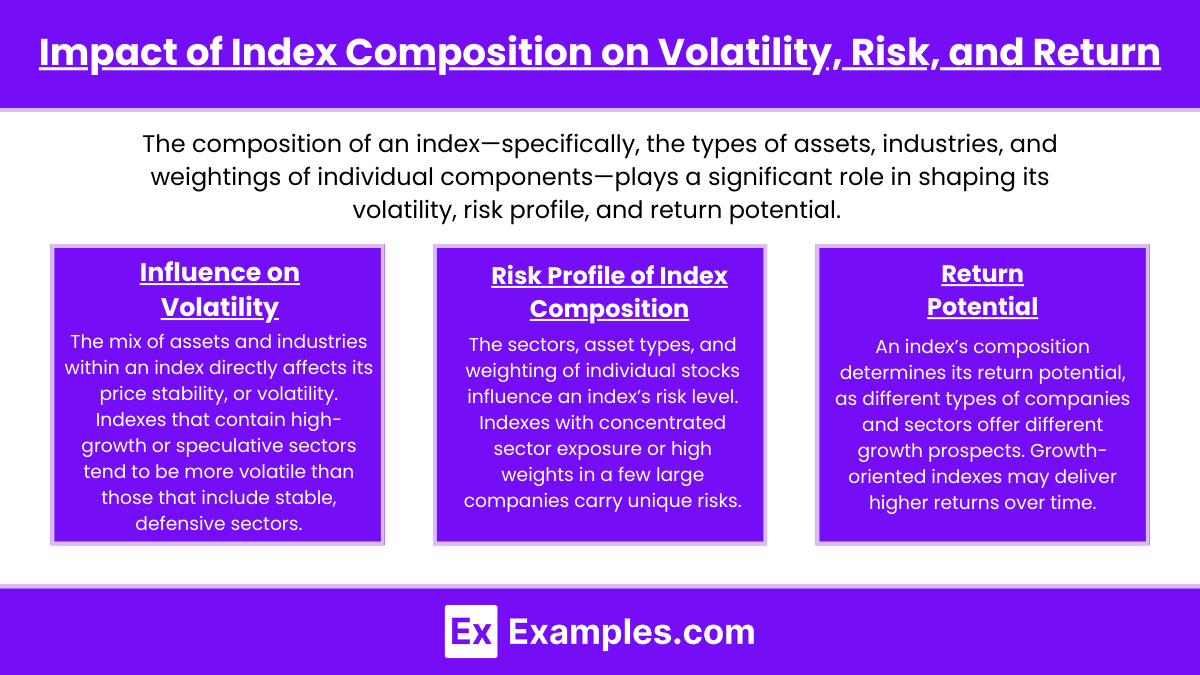
The composition of an index—specifically, the types of assets, industries, and weightings of individual components—plays a significant role in shaping its volatility, risk profile, and return potential. Understanding these impacts can help investors choose the right index to match their investment goals and risk tolerance.
1. Influence on Volatility
The mix of assets and industries within an index directly affects its price stability, or volatility. Indexes that contain high-growth or speculative sectors (such as technology or biotech) tend to be more volatile than those that include stable, defensive sectors (like utilities or consumer staples).
- High Volatility: Indexes heavily weighted in technology or smaller-cap stocks may experience frequent and sharp price fluctuations.
- Low Volatility: Indexes with significant exposure to large, well-established companies or defensive sectors generally exhibit more stable performance.
Example: The NASDAQ-100, with its heavy tech focus, is more volatile than the S&P 500, which is more diversified across sectors.
2. Risk Profile of Index Composition
The sectors, asset types, and weighting of individual stocks influence an index’s risk level. Indexes with concentrated sector exposure or high weights in a few large companies carry unique risks, including sector-specific downturns or large fluctuations in individual stocks.
- Sector Concentration Risk: When an index is heavily focused on a single sector, it’s more susceptible to sector-specific economic changes.
- Company-Specific Risk: Market-cap-weighted indexes can have significant exposure to a few large companies, increasing risk if those companies face declines.
- Balanced Risk: Indexes that diversify evenly across multiple sectors and companies tend to carry lower overall risk.
Example: The Dow Jones Industrial Average is price-weighted and includes only 30 large companies, which can lead to higher risk if any of those companies experience a sharp decline.
3. Return Potential
An index’s composition determines its return potential, as different types of companies and sectors offer different growth prospects. Growth-oriented indexes may deliver higher returns over time but also come with greater risk and volatility, while more conservative indexes offer lower, more stable returns.
- High Return Potential: Indexes with growth stocks, like the NASDAQ-100, often have higher returns due to the rapid growth of their component companies.
- Lower Return Potential: Bond or dividend-focused indexes, such as the Bloomberg Barclays U.S. Aggregate Bond Index, are typically more stable but provide lower returns, aligning with income-focused or risk-averse investors.
Example: The Russell 2000, which focuses on smaller-cap stocks, has higher return potential due to the growth opportunities in smaller companies but also comes with increased risk.
Significance of Major Global Indexes
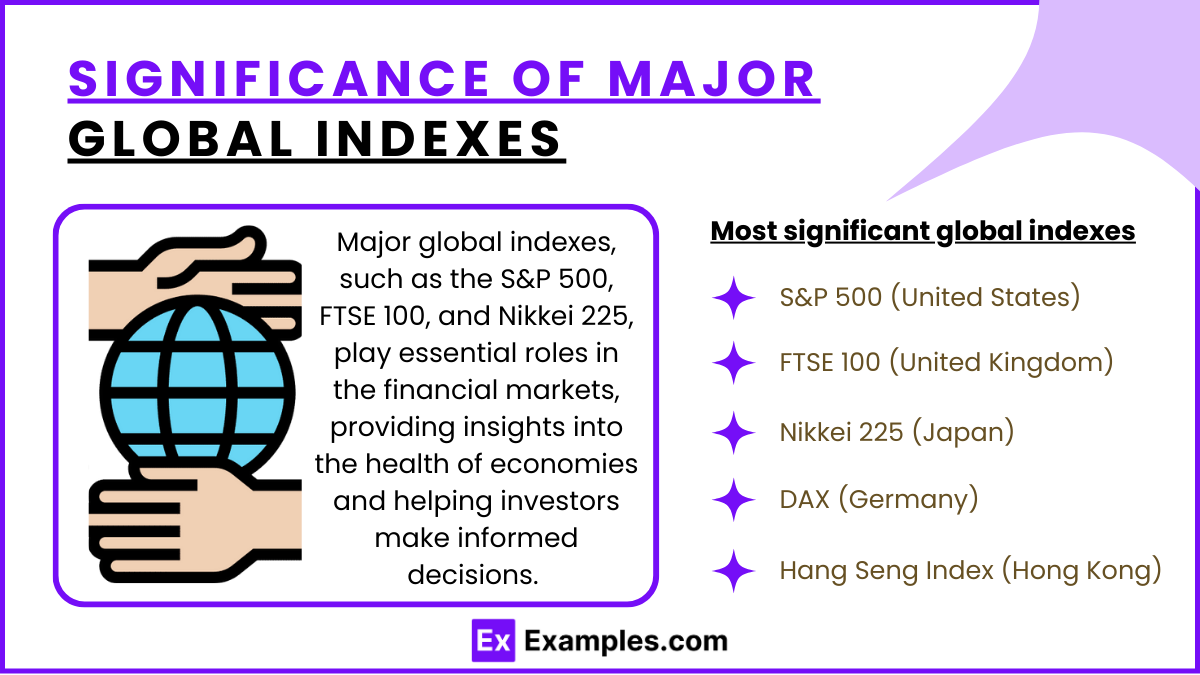
Major global indexes, such as the S&P 500, FTSE 100, and Nikkei 225, play essential roles in the financial markets, providing insights into the health of economies and helping investors make informed decisions. Each index reflects the performance of leading companies within a specific region, and collectively, they give a snapshot of the global economic landscape. Here’s a look at some of the most significant global indexes and why they matter:
1. S&P 500 (United States)
The S&P 500 tracks the performance of 500 large-cap U.S. companies across various industries. This index is a leading indicator of U.S. economic health and investor sentiment.
- Significance: Represents approximately 80% of the total U.S. stock market value, making it a strong indicator of overall market performance in the U.S.
- Global Impact: The S&P 500 is closely watched worldwide; fluctuations can impact global markets, as many multinational companies in this index influence the international economy.
Example: A rise in the S&P 500 often signals a strong U.S. economy, influencing investor confidence globally.
2. FTSE 100 (United Kingdom)
The FTSE 100 includes the 100 largest companies listed on the London Stock Exchange, many of which have significant international operations.
- Significance: Reflects the economic health of the U.K. and the impact of global economic conditions on British multinational companies.
- Global Impact: Since many FTSE 100 companies operate internationally, this index provides insight into both the U.K. economy and global trade dynamics.
Example: A decline in the FTSE 100 could reflect concerns about global trade or geopolitical issues affecting British and European markets.
3. Nikkei 225 (Japan)
The Nikkei 225 tracks the 225 most prominent companies on the Tokyo Stock Exchange, spanning various sectors.
- Significance: As Japan’s primary index, it reflects the health of the Japanese economy and is widely used to gauge investor sentiment in Asia.
- Global Impact: Japan is a key player in the global market, particularly in technology and automotive industries, making the Nikkei 225 influential beyond Asia.
Example: If the Nikkei 225 is performing well, it often indicates a stable economic outlook for Japan and may boost confidence in Asian markets.
4. DAX (Germany)
The DAX represents the 30 largest companies on the Frankfurt Stock Exchange, encompassing major German industries.
- Significance: The DAX is a vital indicator of Germany’s economic strength and often serves as a barometer for the Eurozone, given Germany’s role as Europe’s largest economy.
- Global Impact: As Germany is heavily export-driven, the DAX can reflect global economic conditions, especially in manufacturing and exports.
Example: A rise in the DAX often signals strong manufacturing and export demand, positively impacting other European economies.
5. Hang Seng Index (Hong Kong)
The Hang Seng Index (HSI) comprises the largest companies listed in Hong Kong, representing sectors such as finance, technology, and real estate.
- Significance: The HSI provides a gauge of economic health in Hong Kong and is viewed as a bridge between Western markets and Mainland China.
- Global Impact: Given Hong Kong’s role as a major financial center, the HSI is an important indicator of investor sentiment regarding China’s economic policies and global trade.
Example: A significant rise in the HSI may signal positive economic developments in China, impacting global markets with ties to the Chinese economy.
Examples
Example 1: Consumer Price Index (CPI)
The Consumer Price Index measures the average change over time in the prices paid by consumers for a basket of goods and services. It is widely used to assess inflation and the cost of living, providing crucial information for economic policy and planning. By tracking changes in the CPI, policymakers can make informed decisions regarding interest rates, wages, and economic growth.
Example 2: S&P 500 Index
The S&P 500 Index is a stock market index that measures the performance of 500 of the largest publicly traded companies in the United States. It is a key indicator of the overall health of the U.S. stock market and economy. Investors and analysts often use the S&P 500 as a benchmark for evaluating the performance of individual stocks and mutual funds, making it a crucial tool in investment strategy.
Example 3: Dow Jones Industrial Average (DJIA)
The Dow Jones Industrial Average is one of the oldest stock market indexes, comprising 30 significant publicly traded companies in the U.S. It serves as an indicator of the performance of the stock market and the economy as a whole. By tracking the DJIA, investors can gauge market trends and investor sentiment, as it reflects the performance of key sectors in the economy.
Example 4: NASDAQ Composite Index
The NASDAQ Composite Index includes more than 3,000 stocks listed on the NASDAQ stock exchange, focusing primarily on technology and internet-based companies. It is a vital index for tracking the performance of technology stocks, which have become increasingly significant in the modern economy. The NASDAQ Composite is often used by investors to analyze trends in the tech sector and gauge overall market performance.
Example 5: FTSE 100 Index
The Financial Times Stock Exchange 100 Index, commonly known as the FTSE 100, represents the 100 largest companies listed on the London Stock Exchange. It serves as a barometer for the UK stock market and the British economy. Investors and analysts monitor the FTSE 100 to assess market performance and economic trends in the UK, using it as a reference point for investment decisions in British equities.
Practice Questions
Question 1
What is the primary purpose of a stock market index?
A) To provide a measure of the performance of a specific group of stocks
B) To determine the price of individual stocks
C) To calculate dividends for shareholders
D) To predict future stock prices
Correct Answer: A) To provide a measure of the performance of a specific group of stocks.
Explanation: A stock market index serves as a statistical measure that tracks the performance of a specific set of stocks, representing a particular market segment or industry. For example, the S&P 500 tracks 500 large-cap companies, providing insights into overall market trends. Options B, C, and D are incorrect as they do not accurately reflect the primary function of an index.
Question 2
Which of the following indexes is specifically designed to represent the performance of technology companies?
A) Dow Jones Industrial Average
B) S&P 500
C) NASDAQ Composite
D) FTSE 100
Correct Answer: C) NASDAQ Composite.
Explanation: The NASDAQ Composite Index is primarily composed of stocks listed on the NASDAQ stock exchange, which includes a significant number of technology and internet-based companies. This index is widely recognized as a benchmark for the technology sector. The other options represent broader markets or different sectors, with the DJIA including 30 major companies, the S&P 500 covering 500 companies across various industries, and the FTSE 100 focusing on large UK companies.
Question 3
How does the Consumer Price Index (CPI) measure inflation?
A) By tracking stock market performance
B) By measuring the change in prices of a fixed basket of goods and services over time
C) By calculating corporate profits
D) By assessing the interest rates set by central banks
Correct Answer: B) By measuring the change in prices of a fixed basket of goods and services over time.
Explanation: The Consumer Price Index measures inflation by comparing the current prices of a predefined set of goods and services—referred to as the “basket”—to their prices in a base year. This comparison helps to determine how much prices have increased or decreased, reflecting the purchasing power of consumers. The other options do not pertain to how CPI is calculated or its purpose in measuring inflation.

