Understanding inferential statistics is essential for the CMT Exam as it allows market analysts to make data-driven predictions about broader market trends based on sample data. Mastery of hypothesis testing, confidence intervals, and regression analysis provides insights into market behaviors and patterns, improving trading decisions and enhancing statistical rigor in market analysis.
Learning Objective
In studying "Inferential Statistics" for the CMT Exam within "Section IV: Statistical Applications for Technical Analysts," you should learn how to draw conclusions about market behavior from sample data. Understand and apply techniques such as hypothesis testing, confidence intervals, and regression analysis to evaluate market patterns, trends, and relationships. Analyze data-driven models to make probabilistic predictions, assess trading strategies, and improve forecasting accuracy. Evaluate statistical significance, correlations, and causations to enhance decision-making in technical analysis. Additionally, explore real-world applications of inferential statistics in market research and trading strategies to strengthen your analytical skills and market insights.
Understanding the Fundamentals of Inferential Statistics

Inferential statistics is a branch of statistics that focuses on making inferences and predictions about a population based on data collected from a sample. It plays a crucial role in market analysis and technical analysis by helping traders and analysts draw conclusions about broader market trends, test hypotheses, and assess the reliability of data-driven observations. For Chartered Market Technicians (CMTs), mastering inferential statistics is key to making sound decisions based on sample data while accounting for uncertainty and variability.
1. Definition and Importance in Market Analysis
Inferential statistics involves using sample data to make generalizations about a larger population. In the context of market analysis, it helps traders predict future market behaviors, assess risks, and evaluate the effectiveness of trading strategies. By understanding probabilities and trends derived from sample data, CMTs can make informed decisions with a higher degree of confidence.
2. Difference Between Descriptive and Inferential Statistics
While descriptive statistics summarize and describe the main features of a data set, such as mean, median, and standard deviation, inferential statistics goes further by drawing conclusions about a larger population. For example, while descriptive statistics might tell us the average return of a sample of stocks, inferential statistics enables us to predict the average return of the entire market.
3. Key Concepts: Population vs. Sample, Parameters vs. Statistics
A population refers to the entire set of entities under study (e.g., all stocks in a market), while a sample is a subset of that population used for analysis. Parameters are numerical values that describe the entire population, such as the true mean or variance, while statistics are estimates derived from sample data (e.g., sample mean, sample variance). Understanding these distinctions is vital for interpreting statistical results and assessing their accuracy.
4. Importance of Random Sampling and Data Representativeness
The accuracy of inferential statistics depends on how well the sample represents the population. Random sampling ensures that every member of the population has an equal chance of being selected, reducing bias and improving the generalizability of results. When analyzing market data, CMTs must ensure that their sample is representative of broader market conditions to draw reliable conclusions.
Core Techniques in Inferential Statistics

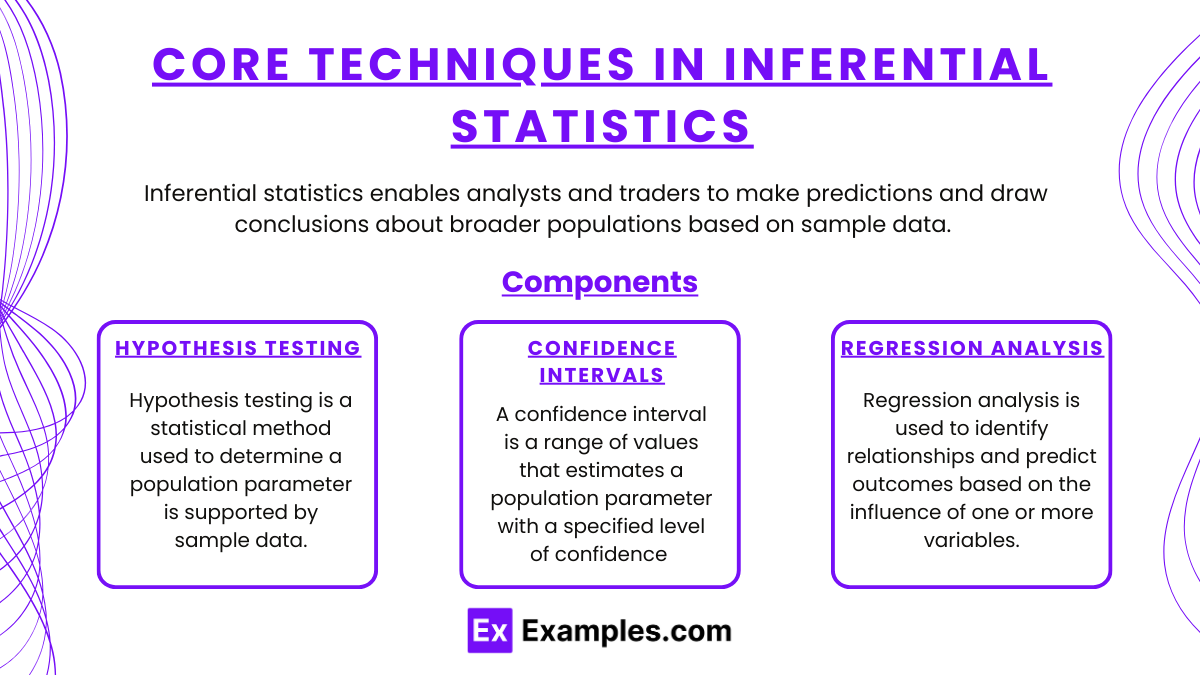
Inferential statistics enables analysts and traders to make predictions and draw conclusions about broader populations based on sample data. For Chartered Market Technicians (CMTs), core techniques in inferential statistics are crucial for evaluating market behavior, identifying trends, and making data-driven decisions. These techniques include hypothesis testing, confidence intervals, and regression analysis, each serving a distinct purpose in market analysis.
1. Hypothesis Testing
Hypothesis testing is a statistical method used to determine whether a hypothesis about a population parameter is supported by sample data. It involves the following steps:
Formulating Null and Alternative Hypotheses: The null hypothesis (H0) represents the default assumption (e.g., no effect or no difference), while the alternative hypothesis (H1) reflects the assertion to be tested (e.g., a significant market trend exists).
Choosing a Significance Level (Alpha): Commonly set at 0.05, the significance level defines the threshold for rejecting the null hypothesis. A p-value less than alpha indicates statistically significant results.
Calculating the Test Statistic and p-Value: A test statistic (e.g., t-statistic or z-score) is computed based on sample data. The p-value reflects the probability of observing the test statistic under the null hypothesis.
Making a Decision: If the p-value is below the significance level, the null hypothesis is rejected, suggesting that the observed effect is statistically significant.
Application in Market Analysis: Hypothesis testing can help traders assess whether a trading strategy significantly outperforms a benchmark or determine if a trend is statistically reliable.
2. Confidence Intervals
A confidence interval is a range of values that estimates a population parameter with a specified level of confidence (e.g., 95%). It provides an estimate of the uncertainty surrounding a sample statistic.
Constructing a Confidence Interval: The interval is calculated using the sample mean, standard error, and a critical value (e.g., z-value for a 95% confidence level).
Interpreting the Interval: If a 95% confidence interval for a market return ranges from 3% to 7%, it implies that there is a 95% probability that the true mean return lies within this range.
Application in Market Analysis: Confidence intervals help traders assess the reliability of their estimates and quantify the uncertainty associated with market predictions, such as future price movements or expected returns.
3. Regression Analysis
Regression analysis is used to identify relationships and predict outcomes based on the influence of one or more variables. The two most common forms are:
Linear Regression: Examines the relationship between a dependent variable (e.g., stock price) and one or more independent variables (e.g., interest rates). It provides a regression equation to predict outcomes based on input values.
Multiple Regression: Extends linear regression to include multiple independent variables, offering a more comprehensive model of complex relationships.
Application in Market Analysis: Regression analysis helps CMTs determine how market factors (e.g., economic indicators) influence asset prices, identify trends, and predict future market movements. For example, a trader might use regression to assess how changes in GDP or interest rates impact stock returns.
Applying Inferential Statistics to Market Analysis

Inferential statistics allows traders and market analysts to make predictions and draw conclusions about broader market behaviors based on sample data. By applying statistical techniques such as hypothesis testing, confidence intervals, and regression analysis, Chartered Market Technicians (CMTs) can better assess trends, identify relationships between market variables, and make data-driven decisions. This application of statistical principles enhances market analysis, strategy development, and trading success.
1. Real-World Examples: Using Inferential Statistics to Identify Market Patterns and Trends
Inferential statistics is frequently applied to analyze and predict market movements. For example, a trader may use sample data on stock returns to infer potential market trends, identify patterns like seasonality, and anticipate market reactions to economic data releases. By leveraging statistical models, CMTs can better understand the factors influencing market behavior and apply this knowledge to improve their strategies.
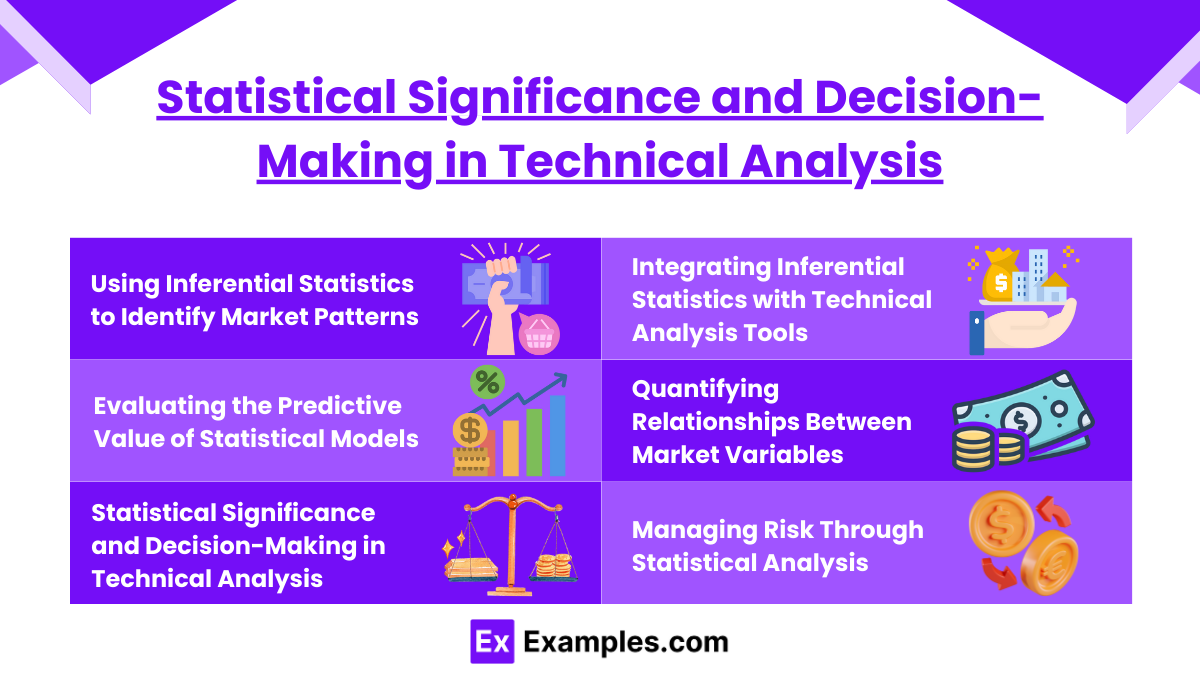
2. Evaluating the Predictive Value of Statistical Models
Inferential statistics enables traders to evaluate the predictive power of statistical models used in market analysis. By testing hypotheses and constructing confidence intervals, CMTs can assess the reliability of their models and determine whether observed trends are statistically significant. This evaluation process helps reduce uncertainty and improve the accuracy of market forecasts.
3. Statistical Significance and Decision-Making in Technical Analysis
Statistical significance plays a key role in determining whether market trends and patterns are meaningful or due to random chance. Hypothesis testing allows traders to assess whether their observations (e.g., price patterns, correlations) are significant enough to warrant action. For example, a statistically significant moving average crossover can signal a reliable trend reversal, prompting a trader to enter or exit a position.
4. Integrating Inferential Statistics with Technical Analysis Tools for Enhanced Trading Strategies
Inferential statistics complements technical analysis tools, enabling CMTs to make more informed trading decisions. By combining statistical measures with chart patterns, momentum indicators, and trendlines, traders can assess the validity of technical signals and reduce false positives. Regression analysis, for example, can be used alongside trendlines to evaluate the strength of relationships between variables and confirm the influence of macroeconomic factors on market trends.
5. Identifying and Quantifying Relationships Between Market Variables
Regression analysis allows traders to quantify relationships between market variables, such as the impact of changes in interest rates on stock prices. By analyzing these relationships, CMTs can make informed predictions about how shifts in one variable may affect market outcomes. This analysis helps identify leading indicators, correlations, and causations that drive price movements, providing actionable insights for trading strategies.
6. Managing Risk Through Statistical Analysis
Inferential statistics helps traders manage risk by providing a framework for assessing uncertainty and potential market outcomes. Confidence intervals, for example, can be used to estimate the range of potential returns or market moves with a specified level of confidence. This information allows CMTs to set stop-loss orders, position sizes, and risk management parameters more effectively.
Examples
Example 1: Hypothesis Testing for Trading Strategies
A trader tests a hypothesis that a specific technical indicator, such as a moving average crossover, reliably predicts market uptrends. By applying hypothesis testing on historical market data, the trader can determine if the observed relationship between the indicator and market performance is statistically significant, enhancing confidence in the strategy.
Example 2: Constructing Confidence Intervals for Stock Returns
An analyst wants to estimate the average monthly return of a stock based on sample data from the past five years. By constructing a 95% confidence interval, they provide a range of likely values for the true average return, helping investors assess potential risks and returns with greater confidence.
Example 3: Regression Analysis to Identify Market Drivers
A financial analyst uses multiple regression analysis to explore how variables such as interest rates, inflation, and GDP growth impact stock market performance. This analysis quantifies the strength of relationships, allowing the analyst to predict how changes in these macroeconomic factors may influence future market movements.
Example 4: Evaluating the Significance of Market Patterns
A technical analyst observes a price pattern that appears to signal market reversals. By applying statistical tests, they assess whether the pattern occurs with enough regularity and predictability to justify its use in trading decisions. This helps distinguish genuine trends from random market noise.
Example 5: Using Inferential Statistics to Assess Market Risk
An asset manager uses inferential statistics to analyze historical volatility data and estimate the potential range of future price movements for a portfolio. This approach informs risk management decisions, such as setting stop-loss levels or determining appropriate position sizes to mitigate potential downside risk.
Practice Questions
Question 1:
What is the primary purpose of hypothesis testing in inferential statistics?
A. To describe the characteristics of a data set
B. To make predictions based on historical data
C. To test assumptions about a population parameter based on sample data
D. To compare data from two different populations
Answer: C) To test assumptions about a population parameter based on sample data
Explanation:
Hypothesis testing involves using sample data to determine whether there is enough evidence to support a specific claim or hypothesis about a population parameter. It helps make inferences about the broader population. Options A and B relate more to descriptive statistics, while D is a specific case that can be part of hypothesis testing.
Question 2:
Which of the following best describes a confidence interval?
A. A measure of central tendency in a data set
B. A range of values used to estimate a population parameter
C. A tool to find correlations between variables
D. A statistical test for variance
Answer: B) A range of values used to estimate a population parameter
Explanation:
A confidence interval provides a range within which a population parameter, such as the mean, is likely to lie with a specified level of confidence (e.g., 95%). It helps quantify the uncertainty of an estimate. Option A relates to descriptive statistics, C pertains to correlation analysis, and D is unrelated to confidence intervals.
Question 3:
When using linear regression in market analysis, what is the primary goal?
A. To establish a causal relationship between variables
B. To describe the distribution of a single variable
C. To predict the value of a dependent variable based on one or more independent variables
D. To calculate the mean and variance of a data set
Answer: C) To predict the value of a dependent variable based on one or more independent variables
Explanation:
Linear regression aims to model the relationship between a dependent variable (e.g., stock price) and one or more independent variables (e.g., interest rates) to make predictions. It identifies the strength and direction of the relationship, enabling data-driven predictions. Options A and D are unrelated, while B describes a different statistical approach.

