Intermarket Analysis is a vital component of the Chartered Market Technician (CMT) Exam, focusing on relationships between asset classes such as equities, bonds, commodities, and currencies. Understanding these correlations helps traders and analysts identify market trends, confirm signals, and make informed decisions. Mastery of this topic is key to advanced technical analysis.
Learning Objective
In studying “Intermarket Analysis” for the CMT Level 2 Exam, you should understand the interplay between different asset classes, including equities, bonds, commodities, and currencies. Learn to evaluate how changes in one market influence others and assess economic conditions, market risk, and global trends. Analyze the impact of interest rates, inflation, and macroeconomic forces on asset prices. Apply technical indicators and correlation metrics to gauge relative strength and market trends across sectors. Develop strategies to identify market-leading signals and validate trading decisions using intermarket dynamics, and use these concepts to enhance your market selection and predictive analysis capabilities.
Understanding Asset Class Interrelationships

Understanding asset class interrelationships is a fundamental aspect of intermarket analysis, as it focuses on how different financial markets, such as equities, bonds, commodities, and currencies, interact and influence each other. These relationships are driven by various macroeconomic and market-specific factors that provide important insights into broader market trends, economic cycles, and risk sentiment. Analyzing these interrelationships helps technical analysts predict market behavior, identify leading indicators, and confirm signals in different asset classes to make more informed trading and investment decisions. By understanding these correlations, analysts can gain a clearer picture of market dynamics, risk levels, and potential shifts in economic conditions.
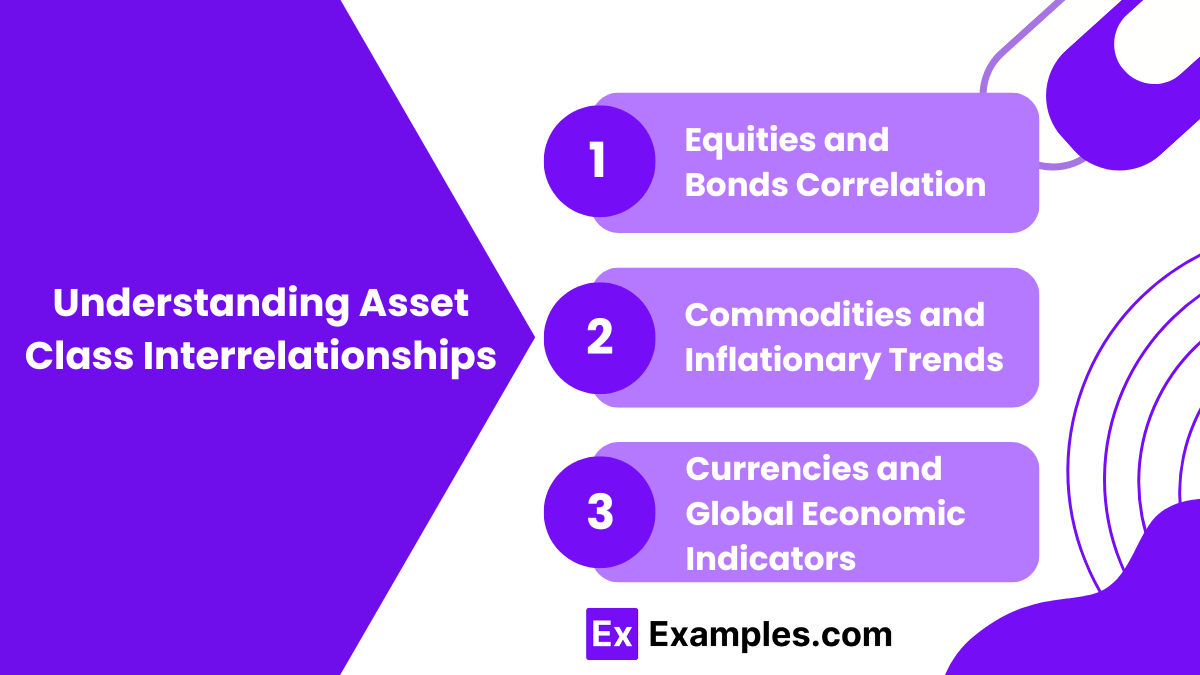
- Equities and Bonds Correlation: Traditionally, stocks and bonds have an inverse relationship, where declining bond yields often boost equities as borrowing costs fall, and rising yields may depress equities by increasing borrowing costs and reducing profit margins.
- Commodities and Inflationary Trends: Commodity price movements, such as changes in oil or gold prices, often reflect shifts in inflation expectations and economic health, influencing other asset classes by signaling inflationary or deflationary pressures.
- Currencies and Global Economic Indicators: Currency values reflect international trade dynamics, geopolitical factors, and monetary policies, affecting global investment flows, export competitiveness, and intermarket price behaviors, influencing equities, bonds, and commodities in different regions.
Understanding these complex interrelationships allows market technicians to make more effective predictions, manage risk better, and develop strategies aligned with market cycles and economic forces.
Analyzing Market Influences and Economic Factors

Analyzing market influences and economic factors is a critical part of understanding asset class movements, economic trends, and market sentiment. This analysis involves assessing how various macroeconomic indicators, market dynamics, and geopolitical events shape market behavior and influence asset prices. By doing so, traders, analysts, and investors can make better-informed decisions and anticipate market shifts.
- Interest Rates and Yield Curves: Interest rates set by central banks are key drivers of economic activity and market sentiment. When rates are lowered, borrowing becomes cheaper, stimulating economic growth and potentially boosting equity markets. Conversely, rising interest rates can slow down economic growth, putting downward pressure on equities while making bonds more attractive. The yield curve, which plots yields across different maturities, provides insights into market expectations for future economic conditions. An inverted yield curve, for instance, often signals an impending economic recession.
- Inflation and Deflation Trends: Inflation erodes purchasing power and impacts consumer behavior, interest rates, and asset valuations. Rising inflation often prompts central banks to raise interest rates, which can reduce bond prices and affect equity markets. Conversely, deflation can signal a slowing economy, leading to lower interest rates and changes in investment flows across asset classes.
- Macroeconomic Data Releases: Key data releases, such as GDP growth, employment figures, retail sales, and manufacturing indices, significantly influence market behavior. Positive economic data may bolster investor confidence, pushing equities higher, while weaker-than-expected data can lead to market declines and a flight to safer assets like bonds.
- Market Sentiment and Risk Appetite: Market sentiment plays a crucial role in asset price movements. Positive sentiment, fueled by economic optimism or strong earnings reports, can drive demand for equities and riskier assets. Conversely, heightened geopolitical tensions, trade disputes, or economic downturns can lead to risk aversion, shifting investor focus to safer assets such as gold or government bonds.
- Currency Fluctuations and Global Trade Dynamics: Currencies are impacted by interest rate differentials, trade balances, and economic stability. Currency strength or weakness affects international trade, corporate earnings, and market competitiveness. For example, a strong domestic currency may negatively impact export-driven sectors by making their goods more expensive abroad.
By understanding these market influences and economic factors, analysts and investors can better interpret market movements, predict potential changes, and craft strategies aligned with economic and market trends.
Applying Intermarket Technical Methods

Applying intermarket technical methods involves the use of analytical techniques and tools to study the relationships and interactions between different asset classes such as equities, bonds, commodities, and currencies. This approach provides a broader perspective on market dynamics, helping traders and analysts make better decisions by identifying trends, confirming signals, and predicting market movements.
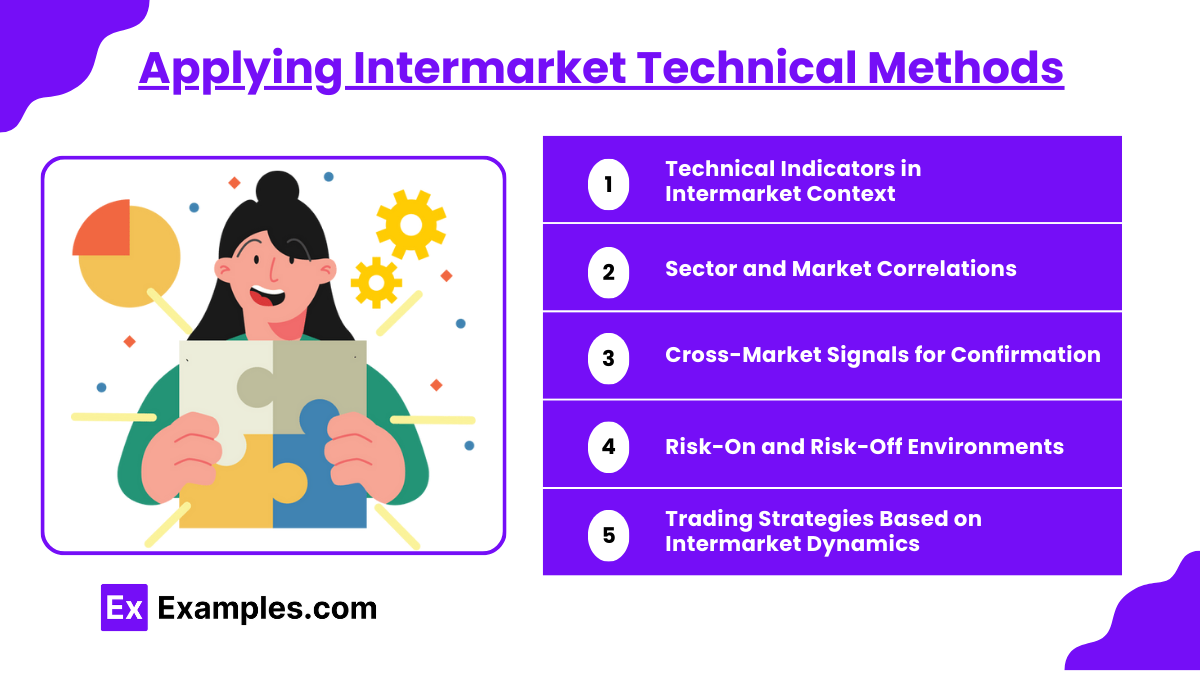
- Technical Indicators in Intermarket Context: Technical indicators like Moving Averages, Relative Strength Index (RSI), and Momentum indicators can be applied across multiple asset classes to gauge relative strength and identify potential trend changes. When used in an intermarket context, these indicators help analysts understand whether asset movements are in sync or diverging.
- Sector and Market Correlations: By analyzing the performance of various sectors and markets, traders can identify leading and lagging segments of the economy. For example, a rise in industrial and energy sectors may indicate strong economic activity, while a downturn could suggest weakening demand. Identifying these relationships is critical for determining market direction and underlying strength.
- Cross-Market Signals for Confirmation: Intermarket analysis allows traders to confirm trends using signals from other markets. For example, a rally in equities accompanied by a rise in bond yields and commodity prices may confirm economic growth. Conversely, divergences across asset classes, such as rising bond prices while equities decline, may indicate market stress or a potential reversal.
- Risk-On and Risk-Off Environments: Analyzing intermarket relationships helps identify shifts in market sentiment between risk-on (favorable for equities and riskier assets) and risk-off (favoring safer assets like bonds and gold) environments. Recognizing these changes allows for timely adjustments in trading strategies to align with prevailing market conditions.
- Trading Strategies Based on Intermarket Dynamics: Intermarket analysis provides the foundation for developing trading strategies that leverage asset class relationships. By understanding how movements in one market affect others, traders can create strategies that capitalize on correlations, diversifications, or hedging opportunities, enhancing the overall risk-return profile of a portfolio.
By applying these technical methods, market participants can achieve a comprehensive view of market interactions, validate technical signals across different asset classes, and develop strategies to capitalize on market trends and potential opportunities.
Examples
Example 1: Equity and Bond Market Correlation Analysis
Description: Analyze the inverse correlation between equities and bonds by observing their performance during periods of interest rate changes. Utilize historical data to identify trends where bond yields declined while equity markets rose, highlighting shifts in investor risk appetite and economic cycles.
Example 2: Commodity Prices as Inflation Indicators
Description: Examine how rising commodity prices, such as oil and precious metals, reflect inflationary pressures. Analyze periods where commodity rallies coincided with central bank interest rate hikes and assess the subsequent impact on equity and fixed-income markets.
Example 3: Currency Strength Impact on Equities
Description: Explore the effects of currency fluctuations on the equity market performance of export-driven economies. Analyze scenarios where a strong domestic currency led to declining exports and lower stock market returns, while a weaker currency boosted export-related sectors.
Example 4: Intermarket Divergence in Risk Sentiment
Description: Identify instances where bond yields increased while equity markets fell, signaling potential economic stress or changing market conditions. Use this divergence to develop strategies for anticipating market reversals or heightened risk.
Example 5: Cross-Market Signals for Sector Rotation
Description: Evaluate how changes in commodity prices or bond yields serve as signals for rotating investments across different equity market sectors. Analyze cases where a rise in industrial metals led to outperformance of cyclical sectors like materials and industrials, while defensive sectors lagged.
Practice Questions
Question 1
What is the primary purpose of intermarket analysis in trading?
A) To focus only on stock market trends
B) To identify relationships between different asset classes
C) To analyze individual stock performance in isolation
D) To determine the economic growth of a specific sector
Answer: B) To identify relationships between different asset classes
Explanation:
Intermarket analysis examines the relationships and correlations between different asset classes, such as stocks, bonds, commodities, and currencies. It helps traders understand how movements in one market might impact others, offering a broader view of market dynamics. This holistic approach contrasts with focusing solely on individual stock performance (C) or sector growth (D).
Question 2
Which of the following is an example of a common relationship identified in intermarket analysis?
A) Rising commodity prices typically lead to falling bond yields
B) Higher interest rates often lead to higher bond prices
C) Falling dollar value usually strengthens gold prices
D) Stock and bond prices always move together in the same direction
Answer: C) Falling dollar value usually strengthens gold prices
Explanation:
In intermarket analysis, a common observed relationship is that a falling dollar value tends to strengthen gold prices, as gold is often seen as a hedge against currency devaluation. Conversely, bond yields and prices have an inverse relationship, and stock and bond prices do not always move in the same direction, depending on market conditions.
Question 3
In intermarket analysis, what does a rising bond yield generally indicate about future stock market performance?
A) It signals a bullish trend in the stock market
B) It suggests potential weakness in the stock market
C) It has no correlation with the stock market
D) It only affects the commodities market
Answer: B) It suggests potential weakness in the stock market
Explanation:
Rising bond yields often indicate higher borrowing costs, which can negatively impact corporate profits and lead to lower stock market performance. This inverse relationship is a key component of intermarket analysis, reflecting how changes in one asset class can affect another. While there can be exceptions, rising yields often suggest caution for stock market investors.


