Probability is the mathematical study of chance, essential for quantifying uncertainty in various scenarios. In technical analysis, probability helps traders and analysts assess the likelihood of different market outcomes, enabling more informed decision-making under uncertain conditions. By understanding concepts such as probability rules, distributions, and Bayes’ Theorem, analysts can evaluate risks, forecast price movements, and refine trading strategies. Mastery of probability provides a structured approach to interpreting historical data, identifying patterns, and managing risk effectively—crucial skills for any technical analyst.
Learning Objectives
In studying “Introduction to Probability” for the CMT Exam, you should learn to understand core probability concepts, including probability values, complementary events, and types like classical, empirical, and subjective probability. Analyze key probability rules, such as the addition and multiplication rules, and apply conditional probability to assess the likelihood of related market events. Evaluate the principles behind probability distributions, focusing on discrete and continuous distributions, including the normal distribution’s role in technical analysis. Additionally, explore Bayes’ Theorem for updating probabilities based on new information, and apply these concepts to assess risk, forecast trends, and interpret trading strategies within technical analysis contexts.
Overview of Probability for Technical Analysts

Probability is fundamental for technical analysts, as it underpins the assessment of market scenarios and risk management in trading. In technical analysis, probability helps in quantifying the likelihood of price movements, evaluating trends, and assessing patterns. Understanding key probability concepts—like conditional probability, Bayes’ theorem, and the law of large numbers—enables analysts to make informed decisions on price targets, trade entry/exit points, and the likelihood of trend continuations or reversals. Probability also guides the evaluation of technical indicators and models, aiding in creating systems that emphasize statistical validity.
By incorporating probability, technical analysts can manage expectations, interpret price data objectively, and create more reliable trading strategies.
Key Concepts in Probability

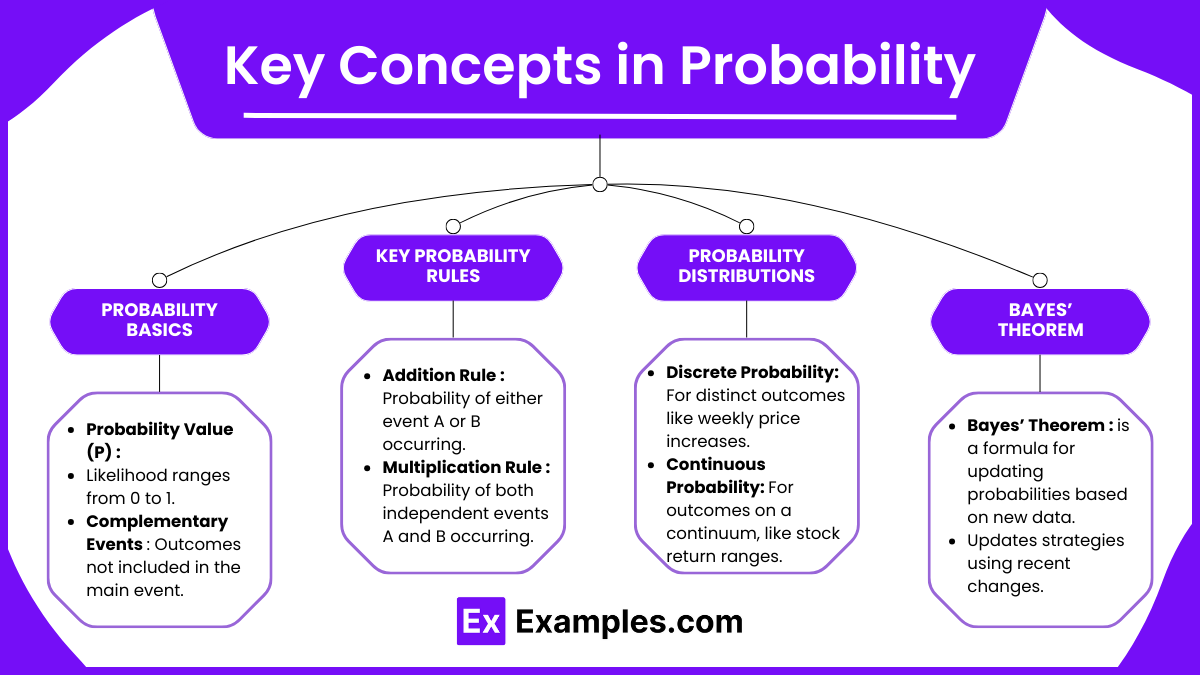
- Probability Basics
- Probability Value (P): Probability is the likelihood of an event occurring, ranging from 0 (impossible) to 1 (certain). In market analysis, probabilities are used to estimate the chances of various market events. A number between 0 and 1 that quantifies the likelihood of an event occurring. For example, a probability of 1 indicates certainty, while 0 means the event will not happen.
- Complementary Events: Events that represent all possible outcomes not covered by the main event. If the probability of an event happening is P(A), the probability of it not happening is 1 − P(A).
- Key Probability Rules
- Addition Rule: For events A and B, the probability of either A or B occurring is P(A) + P(B) − P(A∩B).
- Multiplication Rule: For independent events A and B, the probability of both A and B occurring is P(A) × P(B).
- Conditional Probability: The probability of an event given that another event has occurred, calculated as
 . This is critical in technical analysis when considering the likelihood of one market event following another.
- Probability Distributions
- Discrete Probability Distributions: Used when dealing with distinct outcomes (e.g., the number of price increases in a given week).
- Continuous Probability Distributions: Applies to outcomes that occur on a continuum, such as the probability of a stock’s return falling within a certain range. The normal distribution is particularly important in technical analysis as many asset returns follow this pattern.
- Bayes’ Theorem
- Bayes’ Theorem is a formula for updating probabilities based on new data. In technical analysis, Bayes’ Theorem helps refine probabilities as new information becomes available, enhancing forecasting accuracy. Bayes’ Theorem provides a way to update the probability of an event based on new information. It’s represented as:

- For technical analysts, Bayes’ Theorem helps refine probabilities by incorporating recent data, making it useful for adjusting trading strategies or updating market outlooks.
- This theorem allows for updating trading strategies based on recent market movements or fundamental changes.
- Bayes’ Theorem is a formula for updating probabilities based on new data. In technical analysis, Bayes’ Theorem helps refine probabilities as new information becomes available, enhancing forecasting accuracy. Bayes’ Theorem provides a way to update the probability of an event based on new information. It’s represented as:
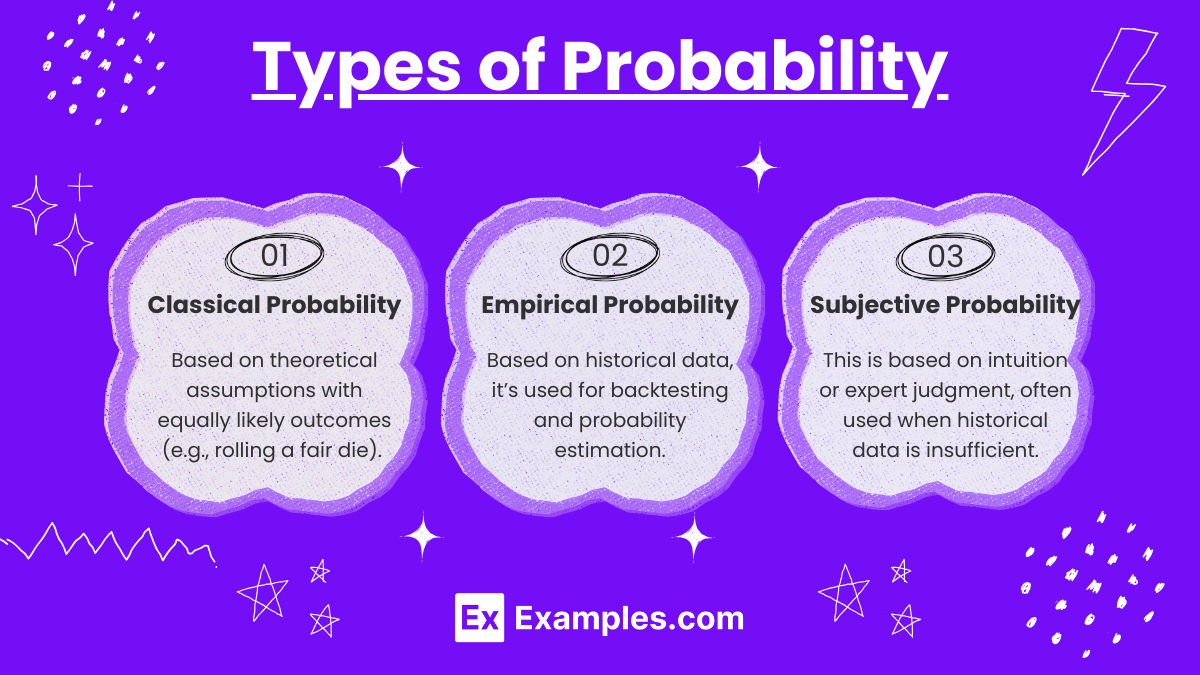
Types of Probability

- Classical Probability: Based on theoretical assumptions with equally likely outcomes (e.g., rolling a fair die). Classical probability can serve as a model in hypothetical scenarios but may have limited application in real markets.
- Empirical Probability: Derived from actual data or historical outcomes, this type is widely used in technical analysis for backtesting strategies and estimating probabilities based on market behavior.
- Subjective Probability: This is based on intuition or expert judgment, often used when historical data is insufficient. Analysts may apply subjective probability in emerging or highly volatile markets where past data may not be reliable.
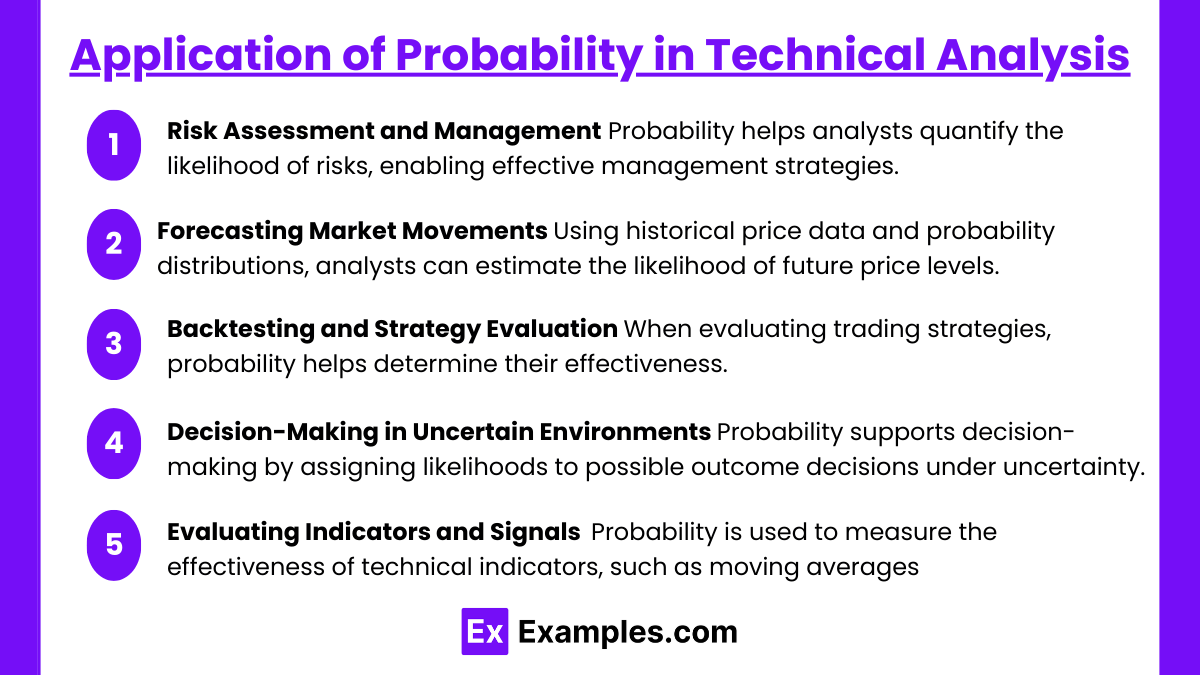
Application of Probability in Technical Analysis

- Risk Assessment and Management Probability helps analysts quantify the likelihood of risks, enabling effective management strategies. By calculating the probability of certain losses or gains, you can set more informed stop-loss and take-profit levels.
- Forecasting Market Movements Using historical price data and probability distributions, analysts can estimate the likelihood of future price levels. Probability distributions like normal distribution assist in identifying expected ranges of movement under normal conditions, while understanding variance and skewness can reveal potential extreme events.
- Backtesting and Strategy Evaluation When evaluating trading strategies, probability helps determine their effectiveness. By simulating historical data and calculating probabilities of success or failure, analysts can select strategies with favorable probabilities, thus optimizing portfolio performance.
- Decision-Making in Uncertain Environments Probability supports decision-making by assigning likelihoods to possible outcomes, allowing analysts to make decisions under uncertainty. For instance, analysts may calculate conditional probabilities to assess the likelihood of an upward trend if a particular technical indicator shows a buy signal.
- Evaluating Indicators and Signals Probability is used to measure the effectiveness of technical indicators, such as moving averages or RSI, by calculating the likelihood that a given indicator will predict future price movements correctly. This evaluation helps analysts choose indicators that offer high statistical reliability.
Examples
Example 1: Calculating the Probability of a Price Increase
Suppose an analyst wants to assess the probability that a stock will close higher than its opening price on any given day. By examining historical data, the analyst finds that the stock closed higher on 65 out of the last 100 trading days. The probability of a price increase on a given day can be estimated as 0.65, or 65%. This empirical probability helps in setting expectations for potential short-term gains or losses.
Example 2: Using Conditional Probability for Trend Continuation
An analyst may observe that when a stock’s price crosses above its 50-day moving average, there is a high probability that the uptrend will continue. To quantify this, the analyst calculates the conditional probability: out of 40 instances where the stock crossed above its 50-day moving average, the stock continued to rise in 30 cases. Thus, the conditional probability of trend continuation, given the moving average crossover, is P(trend∣crossover) = 30/40 = 0.75 or 75%.
Example 3: Applying Bayes’ Theorem to Update Trade Predictions
Imagine an analyst uses a particular technical indicator, such as the Relative Strength Index (RSI), to predict when a stock is oversold. Initially, the analyst believes there’s a 40% chance the stock will reverse after reaching an oversold level. However, if new data show that 70% of stocks with a similar RSI value have reversed recently, the analyst can use Bayes’ Theorem to update the probability of reversal. This approach allows the analyst to adjust predictions based on fresh data and refine trading strategies accordingly.
Example 4: Estimating the Probability of a Market Correction
A technical analyst might be interested in the probability of a market correction of 10% or more based on historical market data. By reviewing data over the last 10 years, they identify that corrections of this magnitude have occurred approximately once every two years, or five times within that period. Thus, the probability of a 10% correction in any given year can be estimated as 5/10, or 0.5 (50%). This probability helps the analyst in risk assessment, portfolio allocation, and setting hedging strategies.
Example 5: Probability of Hitting a Price Target
Suppose an analyst sets a price target for a stock based on technical chart patterns. By analyzing the stock’s past movements when similar patterns emerged, they determine that the price reached the target in 60% of cases. With this probability of success at 0.6 (60%), the analyst can evaluate whether the risk/reward ratio justifies entering the trade, or if adjustments are needed to the target price based on current market conditions.
Practice Questions
Question 1
A technical analyst is evaluating two independent events related to a stock’s price: Event A is the probability that the stock price will increase, and Event B is the probability that the stock will close above a certain level. If P(A) = 0.6 and P(B) = 0.4, what is the probability that both events occur?
A) 0.10
B) 0.24
C) 0.30
D) 1.00
Answer: B) 0.24
Explanation: When two events are independent, the probability of both occurring (i.e., the intersection P(A∩B)) is the product of their individual probabilities: P(A∩B) = P(A) × P(B)
Given P(A) = 0.6 and P(B) = 0.4: P(A∩B) = 0.6 × 0.4 = 0.24
Thus, the correct answer is B) 0.24. This rule of multiplication for independent events helps technical analysts assess the likelihood of multiple conditions being met for a particular trading strategy.
Question 2
A technical analyst observes that the probability of a stock closing higher than its opening price on any given day is 0.7. However, if the stock gapped up at the open, the probability of it closing higher increases to 0.9. What is the probability of the stock both gapping up and closing higher?
A) 0.18
B) 0.30
C) 0.63
D) 0.90
Answer: C) 0.63
Explanation: The scenario describes conditional probability, where the probability of a stock closing higher depends on the condition that it gapped up at the open. This is written as P(Close Higher | Gap Up) = 0.9. To find the probability of both events occurring (gapping up and closing higher), we use the following formula:
P(Gap Up and Close Higher) = P(Gap Up) × P(Close Higher | Gap Up)
If P(Gap Up) = 0.7 and P(Close Higher | Gap Up) = 0.9:
P(Gap Up and Close Higher) = 0.7 × 0.9 = 0.63
Thus, the correct answer is C) 0.63. This calculation is valuable in technical analysis, as it helps analysts understand the likelihood of successive events and refine trading strategies accordingly.
Question 3
An analyst is examining the returns of a particular stock. The probability of a return being positive is 0.6, and the probability of a return being negative is 0.4. Assuming these are the only outcomes, what is the probability that the return will not be positive?
A) 0.10
B) 0.40
C) 0.60
D) 1.00
Answer: B) 0.40
Explanation: The probability of a return not being positive is simply the probability of the return being negative since these two outcomes are mutually exclusive and exhaustive. In probability terms, if the probability of a positive return (Event A) is P(A)=0.6, then the probability of the return not being positive (complement of A) is:
P(Not Positive) = 1−P(A)
P(Not Positive) = 1−0.6 = 0.4
Therefore, the correct answer is B) 0.40. This concept of complementary events is fundamental in probability and is especially useful in scenarios where an analyst needs to determine the likelihood of alternative outcomes.
These questions and detailed explanations cover essential probability concepts, including the multiplication rule for independent events, conditional probability, and the complement rule, all of which are valuable tools for technical analysts.


