Preparing for the CMT Exam demands a solid grasp of the Wave Principle, a pivotal concept in technical analysis. Understanding wave patterns, their predictive power, and market psychology is crucial. This foundational knowledge enhances analytical skills, enabling precise market forecasts and effective trading strategies, essential for excelling on the CMT.
Learning Objective
In studying “Introduction to the Wave Principle” for the CMT Exam, you should aim to master the key concepts and applications of this technical analysis tool. Understand the theoretical underpinnings and practical implications of wave patterns in predicting market behavior. Analyze the roles of impulse and corrective waves in market trends and how these elements contribute to trading strategies. Evaluate the methodology for identifying wave counts and their significance in real-time market analysis. Additionally, explore how the Wave Principle integrates with other analytical tools to enhance market forecasting and decision-making, and apply this knowledge to solve complex case studies in the CMT curriculum.
Overview of the Wave Principle

The Wave Principle, often associated with the Elliott Wave Theory, is a form of technical analysis used to forecast financial market trends by identifying extremes in investor psychology, highs and lows in prices, and other collective factors. Developed by Ralph Nelson Elliott in the late 1930s, the theory proposes that financial markets move in repetitive cycles, which reflect the emotions of investors caused by outside influences or the predominant psychology of the masses at the time. Here are the essential points:
- Wave Patterns: Markets move in repetitive cycles of impulse waves that align with the trend and corrective waves that move against it. Typically, an impulse wave consists of five sub-waves and a corrective wave includes three.
- Fractal Nature: These wave patterns are fractal, meaning each wave can be broken down into smaller, similarly structured waves.
- Fibonacci Relationships: Wave lengths often correspond to Fibonacci ratios, aiding in the prediction of turning points in the markets.
- Wave Degrees: The theory categorizes waves into different degrees, from minute fluctuations to major waves spanning decades.
- Trading Utility: Despite its subjectivity, the Wave Principle is used extensively for market analysis in various financial sectors, aiding in trading decisions.
Understanding Wave Patterns
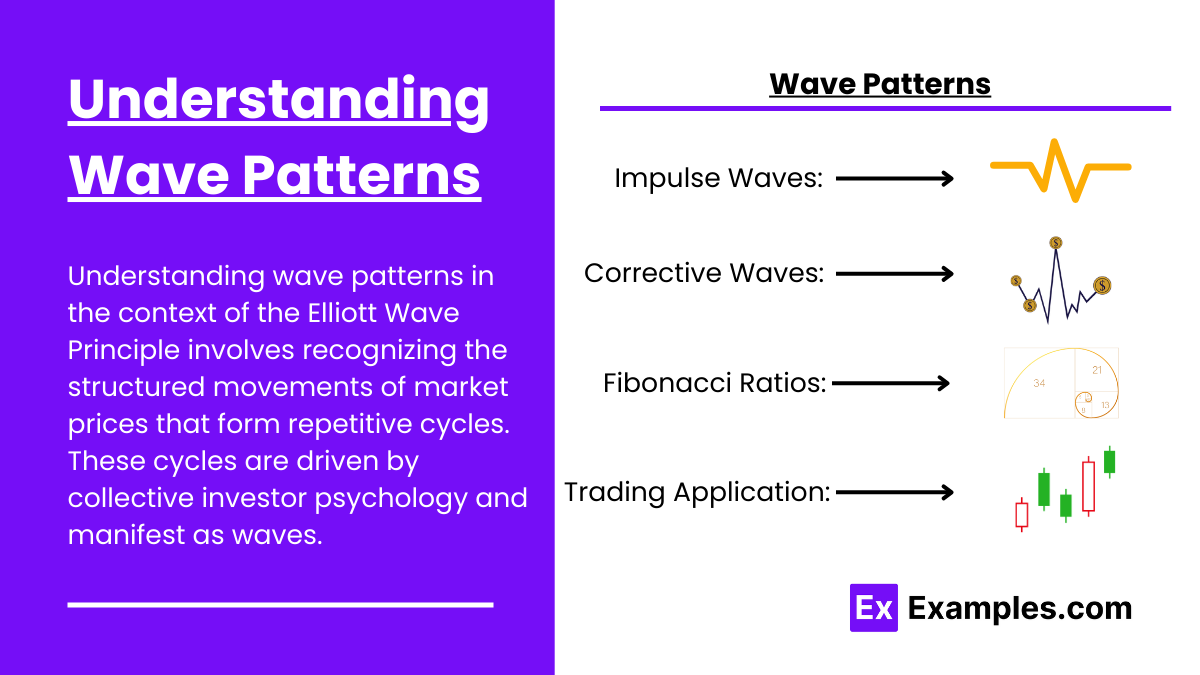
Understanding wave patterns in the context of the Elliott Wave Principle involves recognizing the structured movements of market prices that form repetitive cycles. These cycles are driven by collective investor psychology and manifest as waves. Here’s a detailed breakdown of how to understand these wave patterns:
- Impulse Waves: These consist of five sub-waves (1, 2, 3, 4, 5) that move with the trend. Key characteristics include:
- Wave 1 initiates the pattern.
- Wave 2 retracts but doesn’t exceed the start of Wave 1.
- Wave 3 is often the longest and strongest.
- Wave 4 doesn’t overlap Wave 1.
- Wave 5 concludes the impulse sequence.
- Corrective Waves: Follow the impulse waves and consist of three waves (A, B, C) moving against the trend. They can take various forms like zigzags or flats.
- Fibonacci Ratios: Wave lengths and retracements often correlate with Fibonacci numbers, aiding in predicting turning points.
- Trading Application: Identifying these patterns helps in forecasting price movements and determining strategic trade entry and exit points.
Application of the Wave Principle in Market Analysis

The application of the Elliott Wave Principle in market analysis allows financial analysts and traders to interpret and forecast market trends by analyzing the patterns of investor behavior as reflected in price movements. Here’s how this principle is applied effectively in market analysis:
- Market Phases: It helps identify if the market is in an impulse phase (trending) or a corrective phase (reversing), which informs the overall market direction.
- Trading Decisions: The principle aids in determining strategic entry and exit points based on the predicted ends of wave patterns, particularly for taking positions at the start of an expected strong impulse wave.
- Use of Fibonacci: Fibonacci retracement and extension tools are utilized to forecast potential targets for wave ends, enhancing prediction accuracy.
- Combination with Other Indicators: Analysts often combine Elliott Wave analysis with other technical indicators like RSI or MACD to confirm wave counts and refine market forecasts.
- Limitations: The approach is subjective, with different analysts potentially drawing different conclusions from the same wave patterns. It requires continuous adjustment and a steep learning curve to master effectively.
Practical Implications of the Wave Principle

The practical implications of the Elliott Wave Principle in financial markets are extensive, influencing how traders and analysts forecast trends, manage risk, and make trading decisions. Here are some of the key practical implications:
1. Market Forecasting
The principle helps predict future market directions by identifying wave patterns, aiding in spotting upcoming bull or bear markets.
2. Optimizing Trade Entries and Exits
Traders use wave patterns to determine the best times to enter and exit trades, maximizing profits and minimizing losses by aligning actions with predicted wave phases.
3. Risk Management
Knowing potential reversal points enables traders to set strategic stop-loss orders, reducing potential losses by anticipating market shifts.
4. Complementary Analysis
It’s often combined with other technical indicators (like MACD or RSI) to confirm trends and refine predictions, providing a more robust analysis framework.
5. Investor Psychology
Understanding market sentiment through wave patterns offers insights into collective investor behavior, helping to avoid common trading mistakes.
Examples
Example 1: 1987 Stock Market Crash Analysis
- Study the 1987 market crash using the Wave Principle to identify the impulse and corrective waves leading up to and following the crash. This analysis highlights how the principle can predict significant market downturns and aid in risk management.
Example 2: Dot-Com Bubble
- Analyze the rise and fall of the tech market in the late 1990s and early 2000s through the lens of wave patterns. This case illustrates the predictive power of extended fifth waves and the resulting market corrections.
Example 3: 2008 Financial Crisis
- Application of the Wave Principle to dissect the sequence of market movements before, during, and after the 2008 financial crisis, focusing on how wave patterns signaled impending large-scale economic shifts.
Example 4: Forex Market Fluctuations
- Detailed examination of major currency pairs over a defined period to identify and interpret impulse and corrective waves. This example can demonstrate the use of the Wave Principle in predicting forex market trends and reversals.
Example 5: Recent Bull Markets in Cryptocurrencies
- Using the Wave Principle to analyze the rapid rise and subsequent corrections in cryptocurrency markets, such as Bitcoin and Ethereum. This case study shows how newer market environments still adhere to wave theory dynamics and how traders can leverage this for high volatility trading.
Practice Questions
Question 1
What is the primary purpose of identifying impulse waves in the Elliott Wave Principle?
A. To predict the duration of market trends
B. To calculate the exact price targets
C. To identify the main trend direction
D. To determine the volume of trades
Answer:
C. To identify the main trend direction
Explanation:
Impulse waves are crucial in the Elliott Wave Principle as they move in the direction of the overall trend, helping analysts determine the primary movement of the market. Other options, although related, do not directly describe the primary function of impulse waves.
Question 2
Which wave pattern in the Elliott Wave Theory typically signifies a reversal or correction in the ongoing trend?
A. Leading diagonal
B. Extended third wave
C. Zigzag
D. Fifth wave extension
Answer:
C. Zigzag
Explanation:
A zigzag pattern is a sharp, three-wave corrective pattern in the Elliott Wave Principle that typically occurs against the prevailing trend, indicating a reversal or correction. The other patterns listed, like the leading diagonal or fifth wave extension, represent different aspects of trend continuation or completion.
Question 3
How does the Elliott Wave Principle integrate with Fibonacci retracement levels?
A. To predict the speed of the wave patterns
B. To identify potential reversal points after a wave completion
C. To calculate the volume change between waves
D. To determine the sentiment of market participants
Answer:
B. To identify potential reversal points after a wave completion
Explanation:
The Elliott Wave Principle often uses Fibonacci retracement levels to identify potential price targets and reversal points after a wave has completed. This integration helps traders and analysts find high-probability entry or exit points based on where the waves might find support or resistance.

