Volume analysis is a foundational aspect of technical analysis that examines the amount of buying and selling activity in a market, helping traders confirm trends, assess momentum, and anticipate potential reversals. By analyzing volume in relation to price movements, traders can gain insights into the conviction behind a trend. High volume typically supports the strength of a price movement, while low volume may suggest weakness. Volume-based indicators, such as On-Balance Volume (OBV), further aid in evaluating market sentiment, making volume analysis a crucial tool for informed trading decisions.
Learning Objectives
In studying “Introduction to Volume Analysis” for the CMT Exam, you should learn to interpret the role of volume in confirming trends, identifying reversals, and validating support and resistance levels. Understand how volume trends can indicate market sentiment and momentum. Analyze the principles behind volume-based indicators such as On-Balance Volume (OBV) and the Accumulation/Distribution Line. Evaluate how volume divergence and volume climaxes can signal potential turning points in a trend. Additionally, explore how these volume analysis techniques are applied in various chart patterns and trading strategies, and apply your understanding to make informed trade decisions and enhance trend assessments.
Introduction to Volume Analysis

Volume analysis is a critical aspect of technical analysis that examines the buying and selling activity in a market. Volume, in its simplest form, represents the total number of shares or contracts traded over a specific period. Analysts use volume data to gauge the strength or weakness of a market trend, as volume often precedes price movement. In the context of technical analysis, volume analysis helps identify whether trends are likely to continue or reverse. The idea is that a trend with increasing volume signals strong conviction among traders, whereas a trend with decreasing volume might indicate a lack of enthusiasm, potentially leading to reversals.
Key Principles of Volume Analysis
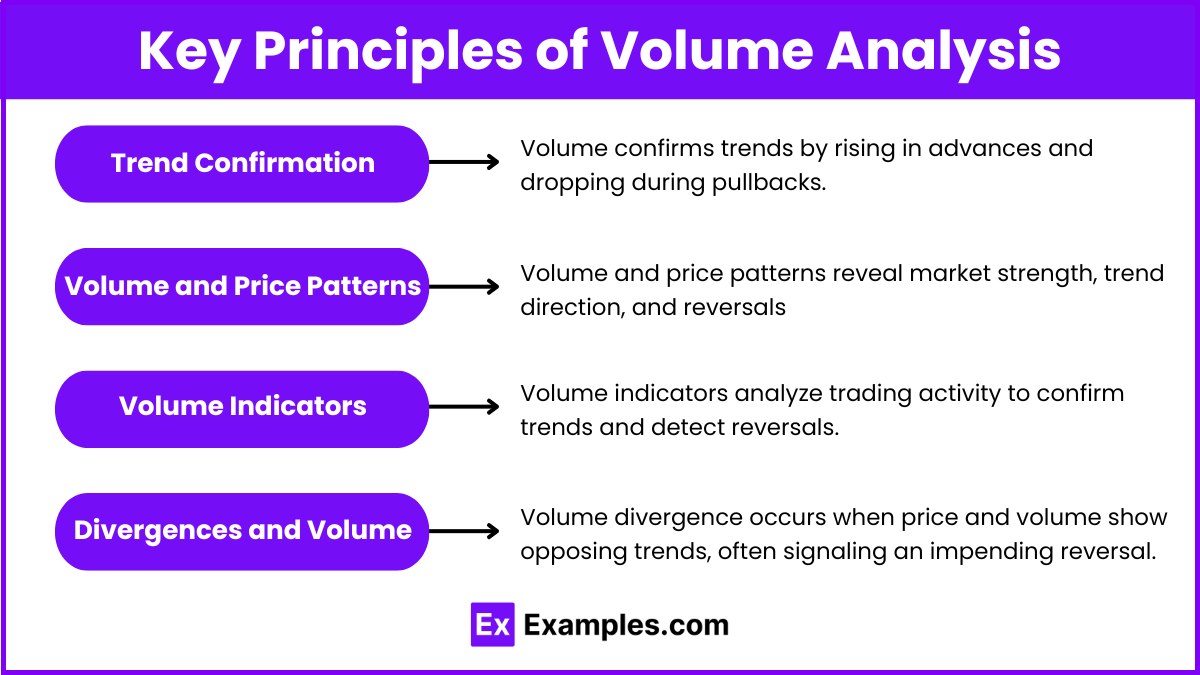
- Trend Confirmation
- Volume plays a critical role in confirming trends. In a strong uptrend, volume should increase on upward price moves and decrease during retracements. Similarly, in a downtrend, higher volume on down moves and lighter volume on rebounds signals trend strength.
- Example: An increase in price accompanied by high volume suggests that the trend is likely to continue, while low volume may indicate a weakening trend.
- Volume and Price Patterns
- Volume and price patterns reveal market strength, trend direction, and reversals. Certain patterns in volume provide hints about future price movements:
- Accumulation and Distribution: High volume during accumulation (increasing buy volume) or distribution (increasing sell volume) signals active institutional participation and potential trend changes.
- Breakouts: High volume on breakouts from support or resistance levels confirms the breakout’s validity, suggesting that it is not a false breakout.
- Volume and price patterns reveal market strength, trend direction, and reversals. Certain patterns in volume provide hints about future price movements:
- Volume Indicators
- Volume indicators analyze trading activity to confirm trends and detect reversals. Several indicators are specifically designed to analyze volume:
- On-Balance Volume (OBV): Tracks cumulative volume flow, rising when the price increases and falling when it declines. OBV helps identify divergences that may precede trend reversals.
- Volume Moving Average: This smooths out volume fluctuations, helping traders spot abnormal volume spikes that may signal breakout or reversal opportunities.
- Volume-Price Trend (VPT): Combines volume and price changes, emphasizing the direction and magnitude of volume to provide more context to price moves.
- Volume indicators analyze trading activity to confirm trends and detect reversals. Several indicators are specifically designed to analyze volume:
- Divergences and Volume
- Volume divergence occurs when price and volume show opposing trends, often signaling an impending reversal. For example, if the price rises but volume declines, it may indicate weakening buying pressure and a potential reversal.
Key Volume Indicators
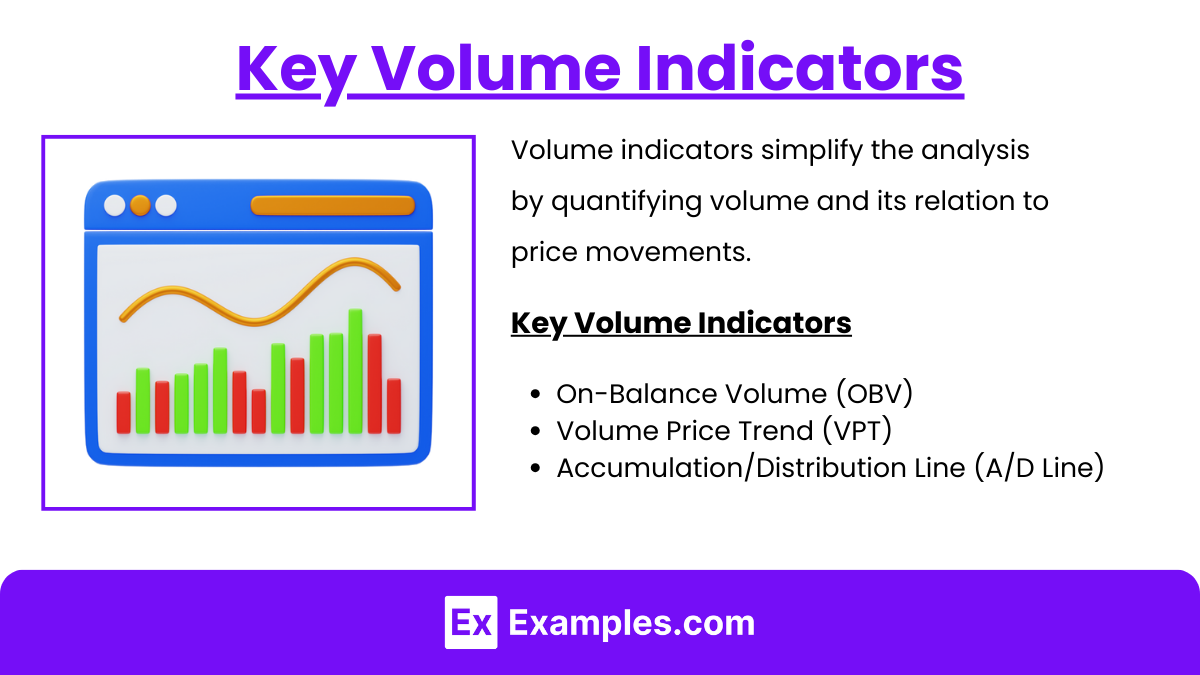
Volume indicators simplify the analysis by quantifying volume and its relation to price movements. Some essential volume-based indicators include:
- On-Balance Volume (OBV): OBV adds volume on up days and subtracts it on down days. Rising OBV indicates strong buying pressure, while declining OBV suggests selling pressure.
- Volume Price Trend (VPT): VPT combines price change and volume, showing the cumulative trend of volume-adjusted price. It’s helpful for assessing the momentum of a trend.
- Accumulation/Distribution Line (A/D Line): The A/D Line is a cumulative indicator that helps determine the strength of a trend by comparing closing prices to their daily range and volume.
Volume Analysis Patterns
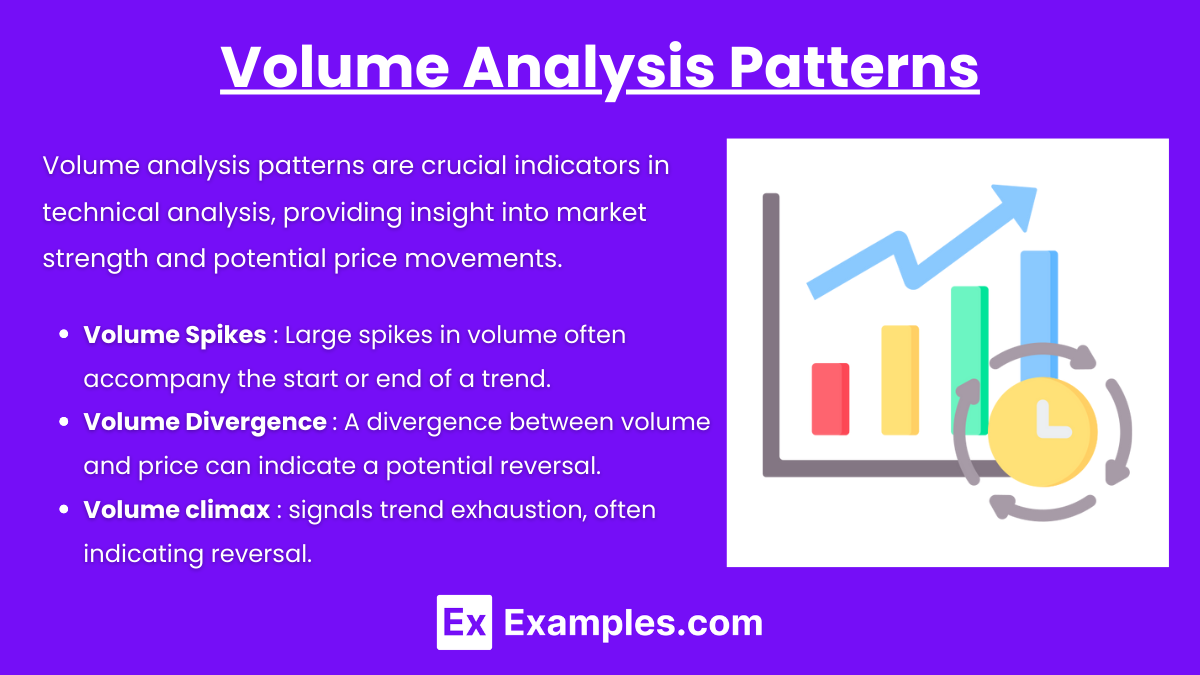
Volume analysis patterns are crucial indicators in technical analysis, providing insight into market strength and potential price movements.
- Volume Spikes: Large spikes in volume often accompany the start or end of a trend. These spikes can signal strong buying or selling interest, which typically precedes a significant price movement.
- Volume Divergence: A divergence between volume and price can indicate a potential reversal. For example, if price is making new highs while volume is declining, it may signal weakening buying pressure.
- Volume Climax: This pattern indicates extreme buying or selling pressure and can often signal exhaustion in the trend, leading to a reversal.
Practical Application of Volume Analysis
In practice, volume analysis requires understanding the context of volume relative to recent levels. Volume analysis is most effective when used in conjunction with price action, moving averages, and trend lines. For example:
- Breakout Trades: Traders look for breakouts from a consolidation range with a volume surge as a strong indicator of a new trend.
- Support and Resistance: Volume tends to increase near support and resistance levels as traders battle to defend or break these levels. Observing volume around these areas helps confirm or reject potential trend changes.
Importance of Volume Analysis in Trend Confirmation
Volume analysis is especially important when confirming trends. The basic principle states that a price movement supported by high volume is more likely to be sustained than one with low volume. Key elements include:
- Uptrend Confirmation: An uptrend supported by high volume suggests strong buying interest, which indicates confidence that the price will continue to rise.
- Downtrend Confirmation: A downtrend with high volume signifies strong selling pressure, hinting that the price decline is likely to persist.
- Trend Strength Evaluation: Volume is often a reliable gauge of trend strength. When volume increases in the direction of a trend, it confirms that the trend has a solid foundation. For example, in a strong uptrend, each successive high should ideally be accompanied by higher volume, signaling healthy momentum.
- Early Indication of Reversals: Volume analysis can provide early signals of potential trend reversals. If a trend shows diminishing volume over time, it might suggest that the trend is losing steam, indicating a possible reversal or consolidation period. Analysts watch for volume spikes on counter-trend moves as these can mark pivotal turning points.
- Support and Resistance Confirmation: Volume analysis helps validate support and resistance levels. When a price level with high volume is breached, it is often considered a significant breakout, implying that the support or resistance level has been broken with conviction, leading to a continuation in the trend.
Volume analysis helps analysts confirm breakout movements, assess the strength of trends, and identify potential reversals.
Examples
Example 1. Volume Confirmation of Breakouts
In technical analysis, a breakout from a chart pattern (like a triangle, rectangle, or flag) is only reliable if accompanied by a significant increase in volume. For instance, when a stock trades within a range and then breaks above resistance, high volume validates the breakout. If volume is absent, the breakout might lack conviction, increasing the risk of a false signal. Volume confirmation in breakouts indicates strong trader interest, showing that both institutional and retail participants are likely supporting the move, which often leads to sustained momentum in the breakout’s direction.
Example 2. Volume Climax and Trend Reversals
A volume climax, often marked by an unusually high volume surge, can indicate the end of a prolonged trend. For example, if a stock has been in a strong uptrend and suddenly experiences a spike in volume while trading near a new high, this could signify that buyers are exhausting, signaling a potential reversal. Such volume climaxes are observed when late-stage investors rush into the market, pushing prices up excessively. After this high-volume phase, the stock often enters a corrective phase or reverses direction, as buying power dwindles and sellers take control.
Example 3. Volume Divergence as a Warning Signal
Volume divergence occurs when price trends upward while volume declines, or vice versa. For example, if a stock is reaching new highs but is doing so with decreasing volume, this could indicate a lack of strong buying interest, often warning that the trend may soon reverse. In a downtrend, a similar divergence, where prices continue falling on lower volume, suggests that selling pressure might be waning, possibly leading to a bullish reversal. Volume divergence is a powerful signal that highlights market sentiment’s underlying shifts, often preceding changes in the trend.
Example 4. Analyzing Volume at Support and Resistance Levels
When price approaches key support or resistance levels, volume plays a vital role in determining whether those levels will hold or break. For example, if a stock tests a support level with low volume, it implies weak selling pressure, suggesting the support might hold. Conversely, high volume at a support level breach would indicate strong selling pressure, increasing the likelihood that the price will break below and start a downtrend. Analysts use volume to assess the strength of buying or selling at these crucial price levels, allowing for better decision-making on trade entries and exits.
Example 5. Volume-Based Indicators like On-Balance Volume (OBV)
The On-Balance Volume (OBV) indicator is one of the most popular volume-based tools that accumulates volume to measure buying and selling pressure. For example, if a stock is in an uptrend and OBV is also rising, it confirms the trend’s strength, as buying pressure outweighs selling. If, however, the stock continues to rise but OBV trends downward, this divergence signals that the uptrend might lack substantial buying support, potentially leading to a reversal. OBV provides insight into the direction of volume flow and is an effective indicator in validating price trends and forecasting future price movements.
Practice Questions
Question 1
When analyzing a breakout from a consolidation pattern, which of the following scenarios is generally considered the most reliable indication of a strong breakout?
A. Price breaks out above resistance with low volume.
B. Price breaks out above resistance with high volume.
C. Price breaks below support with decreasing volume.
D. Price remains within the consolidation pattern with high volume.
Answer: B. Price breaks out above resistance with high volume.
Explanation: In technical analysis, a breakout from a consolidation pattern, such as a rectangle or triangle, is more reliable when accompanied by high volume. This increase in volume indicates that a large number of participants are interested in the price movement, suggesting a strong commitment to the new trend direction. High volume on a breakout confirms that both institutional and retail traders are supporting the move, increasing the likelihood of a sustained trend. Conversely, a breakout on low volume is often considered weak and more prone to fail, as it lacks the conviction needed to support further price movement in that direction.
Question 2
Which of the following scenarios best describes a volume climax, and what does it typically signal about the current trend?
A. A sudden increase in volume during a strong trend, suggesting the trend will continue indefinitely.
B. A prolonged period of low volume in an uptrend, indicating the trend is stable and likely to continue.
C. An unusually high volume spike near the end of an uptrend or downtrend, potentially signaling a trend reversal.
D. A steady increase in volume as the price moves sideways, indicating accumulation or distribution.
Answer: C. An unusually high volume spike near the end of an uptrend or downtrend, potentially signaling a trend reversal.
Explanation: A volume climax occurs when there is an unusual spike in volume, often indicating the culmination of a trend. Near the end of an uptrend, a volume climax suggests that buying interest is reaching exhaustion, as many buyers enter the market, potentially signaling a reversal or correction. Similarly, in a downtrend, a volume climax may indicate panic selling, with the market close to bottoming out. After a volume climax, there is often a period of consolidation or a reversal as the extreme buying or selling pressure subsides, making it a valuable signal for identifying the end of strong trends.
Question 3
In volume analysis, which of the following best describes the significance of volume divergence?
A. Volume divergence indicates a confirmation of the current trend’s strength and stability.
B. Volume divergence suggests that volume and price are moving in the same direction, confirming the trend.
C. Volume divergence shows a mismatch between price movement and volume, which can signal potential trend weakness or reversal.
D. Volume divergence only occurs in a downtrend and indicates increased selling pressure.
Answer: C. Volume divergence shows a mismatch between price movement and volume, which can signal potential trend weakness or reversal.
Explanation: Volume divergence refers to a scenario where the price continues to move in one direction, but volume does not follow suit. For example, if prices are making higher highs, but volume is decreasing, this indicates that fewer participants are supporting the uptrend, suggesting potential trend weakness. Such divergence is often viewed as a warning sign that the current trend may be losing strength and could be due for a reversal. Volume divergence is critical in technical analysis as it helps analysts identify when a trend may be unsustainable due to declining interest or conviction among traders, making it a powerful tool for early trend reversal signals.

