Preparing for the CMT Exam requires a thorough understanding of market sentiment and technical analysis, key components of market psychology. Mastery of sentiment indicators, investor behavior, and sentiment-based trading strategies is essential. This knowledge offers insights into market trends, crowd psychology, and trading dynamics, crucial for achieving a high CMT score.
Learning Objective
In studying "Market Sentiment and Technical Analysis" for the CMT Exam, you should aim to understand various tools and indicators used to gauge market sentiment, such as put-call ratios, volatility indexes, and investor surveys. Analyze how these sentiment indicators, combined with technical analysis, provide insights into crowd psychology and potential market reversals. Evaluate the effectiveness of contrarian and momentum-based strategies and explore chart patterns, volume analysis, and sentiment oscillators. Additionally, understand how sentiment analysis can be integrated into technical frameworks to anticipate market trends and assess risk, applying these insights in CMT practice scenarios
Understanding Market Sentiment Indicators
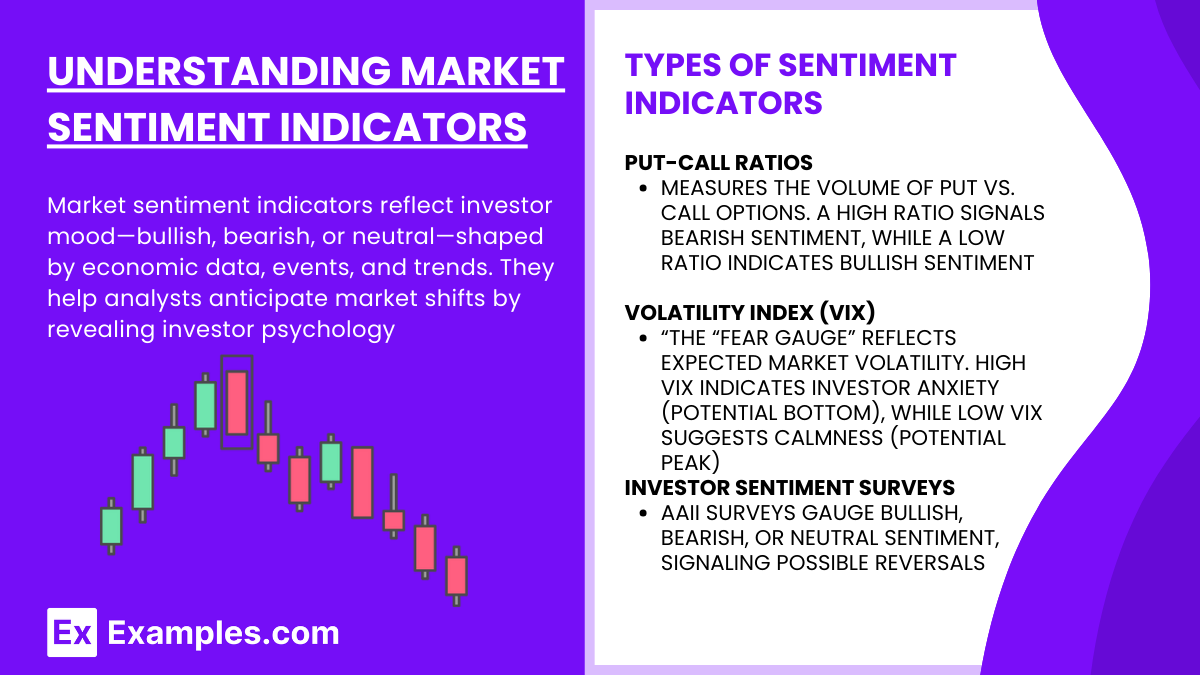
Market sentiment indicators are tools that reflect the overall mood and attitude of investors towards the market at any given time. This collective sentiment, or "market mood," can be optimistic (bullish), pessimistic (bearish), or neutral, and is shaped by a range of factors such as economic data, geopolitical events, company earnings reports, and global market trends. Analyzing market sentiment helps technical analysts anticipate potential shifts in market direction by providing a window into the psychology driving investor behavior.
Types of Sentiment Indicators
Put-Call Ratios
The put-call ratio measures the volume of put options traded versus call options. A high put-call ratio often indicates that investors are bearish, as they are purchasing more put options (which increase in value as prices decline). Conversely, a low put-call ratio suggests bullish sentiment, with more investors purchasing call options, anticipating price increases.Volatility Index (VIX)
Known as the “fear gauge,” the VIX measures market expectations of near-term volatility, based on S&P 500 options. High VIX levels generally correspond to high investor anxiety, which may signal a market bottom, while low VIX levels indicate calmness, potentially signaling a market peak as investors grow complacent.Investor Sentiment Surveys
Surveys like the American Association of Individual Investors (AAII) survey gauge investor sentiment by directly asking participants whether they feel bullish, bearish, or neutral about the market. These surveys can reveal extremes in sentiment that may signal impending market reversals.
Interpreting Sentiment Data in Trading
Sentiment indicators are not predictive on their own; they are most useful when combined with technical analysis. For instance, when sentiment reaches extreme levels—high optimism or deep pessimism—it can often signal that a reversal is near. Contrarian investors use these extremes to “go against the crowd,” buying when sentiment is overly negative and selling when sentiment is overly positive
Technical Analysis Tools in Sentiment Evaluation
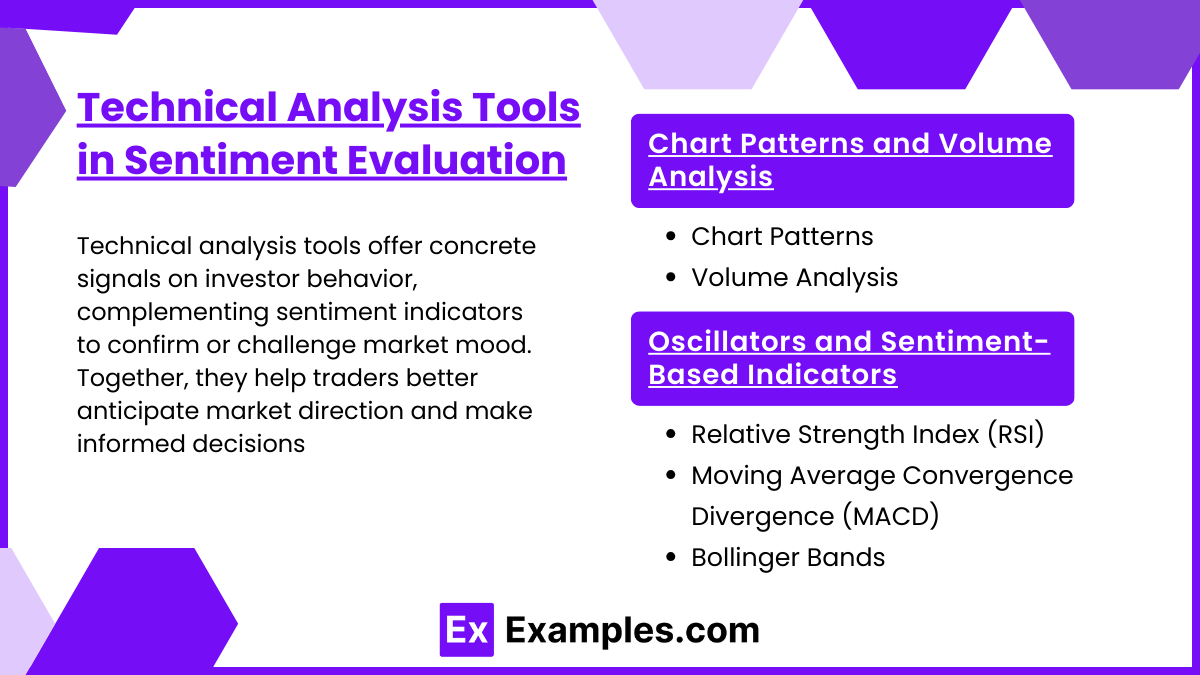
Technical analysis tools are crucial for evaluating market sentiment as they offer concrete signals about investor behavior and potential market trends. While market sentiment indicators reflect the psychological mood of the market, technical analysis tools provide a data-driven approach to confirm or challenge these sentiments. By combining sentiment indicators with technical analysis tools, traders can gain deeper insights into the likely direction of the market and make more informed trading decisions.
Chart Patterns and Volume Analysis
Chart Patterns
Chart patterns, such as head and shoulders, double tops/bottoms, triangles, and flags, are visual representations of historical price behavior. Each pattern reflects certain sentiments within the market:For instance, a head and shoulders pattern is often seen as a bearish reversal signal, suggesting that the bullish sentiment is weakening.
Conversely, an ascending triangle pattern may indicate continued bullish sentiment, as prices form higher lows and approach a resistance level.
By analyzing these patterns, traders can infer the strength of prevailing sentiment and predict potential reversals or continuations in market trends.
Volume Analysis
Volume provides a measure of the intensity behind price movements, helping confirm or question the sentiment indicated by price patterns.High volume during price increases generally supports bullish sentiment, suggesting strong buying interest.
Low volume in an upward trend may indicate that the rally lacks strength, hinting at potential reversal as sentiment weakens.
Volume analysis, especially when paired with chart patterns, helps validate trends and provides additional context on the sentiment driving price action.
Oscillators and Sentiment-Based Indicators
Relative Strength Index (RSI)
The RSI is a momentum oscillator that measures the speed and change of price movements, ranging from 0 to 100. RSI values above 70 typically indicate that an asset is overbought (excessive bullish sentiment), while values below 30 indicate it is oversold (excessive bearish sentiment). Traders use RSI to detect when sentiment may have reached an extreme, signaling a potential reversal.Moving Average Convergence Divergence (MACD)
MACD helps traders understand shifts in momentum and sentiment by analyzing the convergence or divergence between two moving averages (typically the 12-day and 26-day EMAs). When the MACD line crosses above the signal line, it’s often seen as a bullish sentiment shift, while a downward cross may indicate bearish sentiment. MACD also highlights momentum, helping confirm sentiment trends and signal potential entry or exit points.Bollinger Bands
Bollinger Bands use standard deviations around a moving average to indicate levels of market volatility and potential sentiment extremes. When prices touch or exceed the upper band, it often indicates high bullish sentiment, while contact with the lower band indicates bearish sentiment. Traders use Bollinger Bands to evaluate when prices may revert to the mean, signaling a potential shift in sentiment.
Integrating Technical Tools with Sentiment Analysis
Integrating sentiment indicators with technical analysis tools creates a more holistic approach to market analysis. For instance, when sentiment indicators signal extreme optimism or pessimism, traders can use chart patterns and volume analysis to confirm these sentiments and identify potential turning points. Oscillators and sentiment-based indicators, like RSI or MACD, allow for precision in entry and exit timing, enhancing strategy effectiveness
Contrarian and Momentum-Based Sentiment Strategies
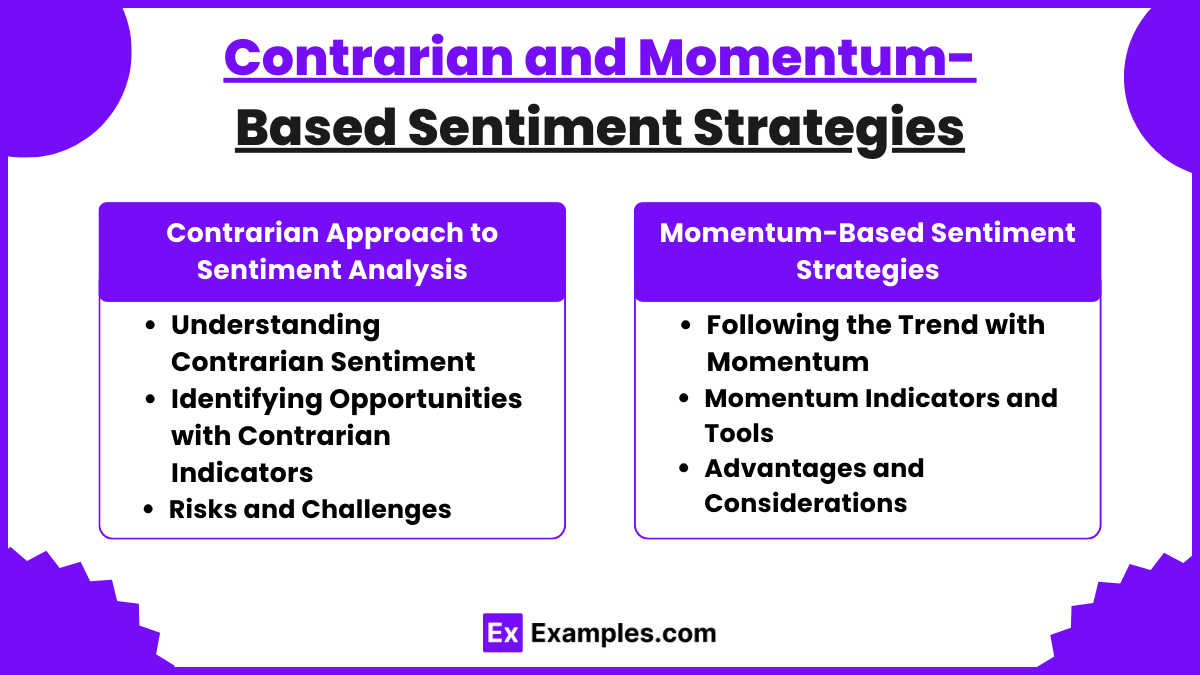
Contrarian and momentum-based strategies are two popular approaches in technical analysis and sentiment evaluation. Both strategies hinge on the idea of interpreting market sentiment and identifying trading opportunities based on prevailing investor psychology, but they apply this understanding in different ways. Contrarian strategies seek to capitalize on extremes in sentiment, often going against the current trend, while momentum-based strategies ride the prevailing trend until signs of a reversal appear. These strategies help traders navigate and leverage crowd psychology, allowing them to either follow or act counter to the market.
Contrarian Approach to Sentiment Analysis
Understanding Contrarian Sentiment
A contrarian strategy is based on the principle that extremes in market sentiment often signal an impending reversal. When sentiment becomes overly bullish (euphoric buying) or overly bearish (panic selling), contrarians view these as indications that the trend may soon reverse. The rationale is that, at sentiment extremes, most participants have already acted on their bullish or bearish outlook, reducing the number of new buyers or sellers and thereby diminishing the strength of the trend.Identifying Opportunities with Contrarian Indicators
Contrarian traders rely on sentiment indicators, such as the put-call ratio, the Volatility Index (VIX), or investor surveys. For instance:A high put-call ratio (more puts than calls) often suggests excessive bearish sentiment, which could signal a potential buying opportunity as prices may be near a bottom.
Conversely, a low VIX level could indicate complacency and an overbought market, where prices may be set for a decline.
Contrarian strategies are most effective when applied at sentiment extremes, providing opportunities to buy into fear and sell into greed, often capturing substantial gains from reversals.
Risks and Challenges
Contrarian strategies are not without risk, as markets can remain irrational or trend strongly even at sentiment extremes. This approach requires patience and strong risk management practices, as prematurely acting against a trend can lead to losses if sentiment continues to push prices further.
Momentum-Based Sentiment Strategies
Following the Trend with Momentum
Momentum-based sentiment strategies aim to capture gains by following the direction of strong trends, capitalizing on the idea that trends tend to persist until new information disrupts them. Rather than fighting the crowd, momentum traders look to align with prevailing sentiment, entering a trend once it has been established and exiting as it shows signs of reversal.Momentum Indicators and Tools
Momentum-based traders use indicators like the Moving Average Convergence Divergence (MACD), Relative Strength Index (RSI), and volume analysis to confirm trends and assess their strength.MACD helps identify momentum by tracking moving average divergences; a bullish MACD crossover suggests continued buying interest.
RSI can be used to gauge when a trend is likely to continue or when it is reaching overbought or oversold levels, indicating a potential exit point.
Volume Analysis supports momentum strategies by confirming the strength of a trend; high volume with price increases indicates strong bullish momentum, while high volume with price declines indicates bearish momentum.
Advantages and Considerations
Momentum strategies benefit from riding strong trends, often allowing traders to capture large moves over a short period. However, they require vigilance, as momentum can shift quickly, especially in highly volatile markets. Momentum traders must be prepared to exit a position as soon as the trend begins to show weakness, managing risks through stop-loss orders or trailing stops.
Risk Management and Strategy Selection
Both contrarian and momentum-based strategies have unique risks and rewards. Contrarians often enter positions at the market extremes, requiring patience and risk tolerance for reversals. Momentum traders, on the other hand, benefit from trend persistence but must be quick to recognize shifts in sentiment. Effective use of these strategies relies on risk management tools like stop-loss orders, position sizing, and technical indicators to confirm or challenge sentiment signals
Examples
Example 1
A trader notices that the put-call ratio is unusually high, indicating excessive bearish sentiment in the market. Using a contrarian approach, the trader sees this as a potential buy signal, believing that the market may be nearing a bottom as most investors have already sold their positions. The trader buys into the market, anticipating a reversal to the upside.
Example 2
The Volatility Index (VIX) spikes due to a recent market sell-off, showing increased fear among investors. A momentum-based trader waits for the VIX to stabilize and uses technical indicators like the Moving Average Convergence Divergence (MACD) to confirm when a downtrend is weakening. Once a bullish MACD crossover occurs, the trader enters a long position, aiming to capture gains as the market recovers.
Example 3
A technical analyst observes a head and shoulders pattern forming in a stock chart, indicating a bearish reversal in sentiment. Volume increases during the formation of the right shoulder, confirming the bearish sentiment. The analyst decides to short the stock, expecting the trend to continue downward as sellers gain control.
Example 4
The RSI for a particular stock reaches 80, suggesting that it is overbought and that bullish sentiment is at an extreme. The trader applies a contrarian strategy and sells their position, expecting a pullback as sentiment may soon shift. The stock price begins to fall, confirming the trader’s sentiment-based exit strategy.
Example 5
An investor uses Bollinger Bands to assess sentiment in a trending market. When prices reach the lower band after a prolonged downtrend, the investor notices that bearish sentiment is likely at an extreme. Combining this with sentiment survey data that reflects pessimism among retail investors, the investor buys the stock, betting on a price rebound
Practice Questions
Question 1
Which of the following indicators is commonly known as the "fear gauge" and is used to measure market sentiment based on volatility expectations?
A) Put-Call Ratio
B) Moving Average Convergence Divergence (MACD)
C) Volatility Index (VIX)
D) Relative Strength Index (RSI)
Answer: C) Volatility Index (VIX)
Explanation: The VIX, or Volatility Index, is often referred to as the "fear gauge" because it measures market expectations of near-term volatility. High VIX levels indicate increased fear or uncertainty among investors, while low levels suggest calmness or complacency in the market. This makes it a key indicator of market sentiment.
Question 2
If a stock has an RSI reading of 85, what does this typically indicate in terms of market sentiment?
A) The stock is oversold and may see a price increase
B) The stock is overbought and may see a price decline
C) The stock is trading at fair value with no extreme sentiment
D) The stock is experiencing low volatility and neutral sentiment
Answer: B) The stock is overbought and may see a price decline
Explanation: An RSI reading above 70 generally indicates that a stock is overbought, suggesting high bullish sentiment. A reading of 85 shows extreme bullish sentiment, implying that the stock may be overvalued in the short term, and a pullback or price decline could occur as sentiment shifts.
Question 3
Which chart pattern is typically considered a bearish reversal, suggesting a shift in sentiment from bullish to bearish?
A) Ascending Triangle
B) Head and Shoulders
C) Bull Flag
D) Symmetrical Triangle
Answer: B) Head and Shoulders
Explanation: The head and shoulders pattern is a classic bearish reversal pattern, signaling a shift in sentiment from bullish to bearish. It indicates that buying interest is waning, and the trend is likely to reverse downward as sellers take control. This pattern is frequently used in technical analysis to anticipate market sentiment shifts.


