Preparing for the CMT Exam necessitates a thorough understanding of “Measuring Market Strength,” an essential aspect of market analysis. Mastery of tools and indicators that gauge market momentum, volume, and price trends is crucial. This knowledge is vital for making informed trading decisions and enhancing market forecasts, key to excelling on the CMT.
Learning Objective
In studying “Measuring Market Strength” for the CMT Exam, you should aim to understand the key indicators and tools used to assess the strength of market trends. Analyze the application of volume indicators, momentum oscillators, and sentiment indices to gauge buying or selling pressure. Evaluate the principles behind the use of tools like the Relative Strength Index (RSI), Moving Average Convergence Divergence (MACD), and On-Balance Volume (OBV). Additionally, explore how these metrics are integrated into broader market analysis to predict continuations or reversals, and apply this knowledge to interpret technical charts and make strategic decisions in market scenarios for the CMT Exam.
Introduction to Market Strength Indicators
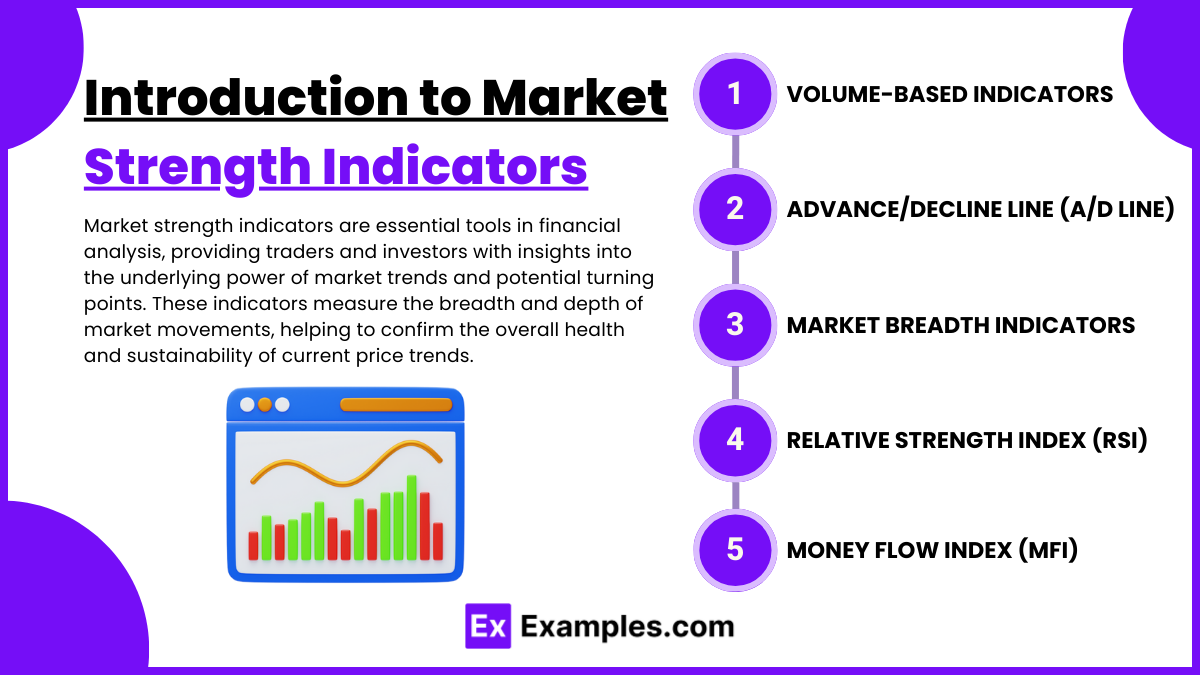
Market strength indicators are essential tools in financial analysis, providing traders and investors with insights into the underlying power of market trends and potential turning points. These indicators measure the breadth and depth of market movements, helping to confirm the overall health and sustainability of current price trends. Here’s an introduction to some key market strength indicators:
1. Volume-Based Indicators
- On-Balance Volume (OBV): Tracks volume flow; rising OBV indicates strong buying pressure.
- Volume Oscillator: Shows short- and long-term volume trends, highlighting buying and selling pressure cycles.
2. Advance/Decline Line (A/D Line)
- Measures the number of advancing vs. declining stocks, confirming if a trend is broad-based or limited to a few stocks.
3. Market Breadth Indicators
- McClellan Oscillator: Gauges the strength of market moves using advancing and declining stocks.
- Breadth Thrust Indicator: Indicates rapid shifts in market sentiment toward bullish conditions.
4. Relative Strength Index (RSI)
- RSI values above 70 suggest overbought conditions; values below 30 indicate oversold conditions, assessing trend strength.
5. Money Flow Index (MFI)
- A volume-weighted RSI; high values (over 80) indicate overbought, while low values (under 20) suggest oversold conditions.
Volume Indicators
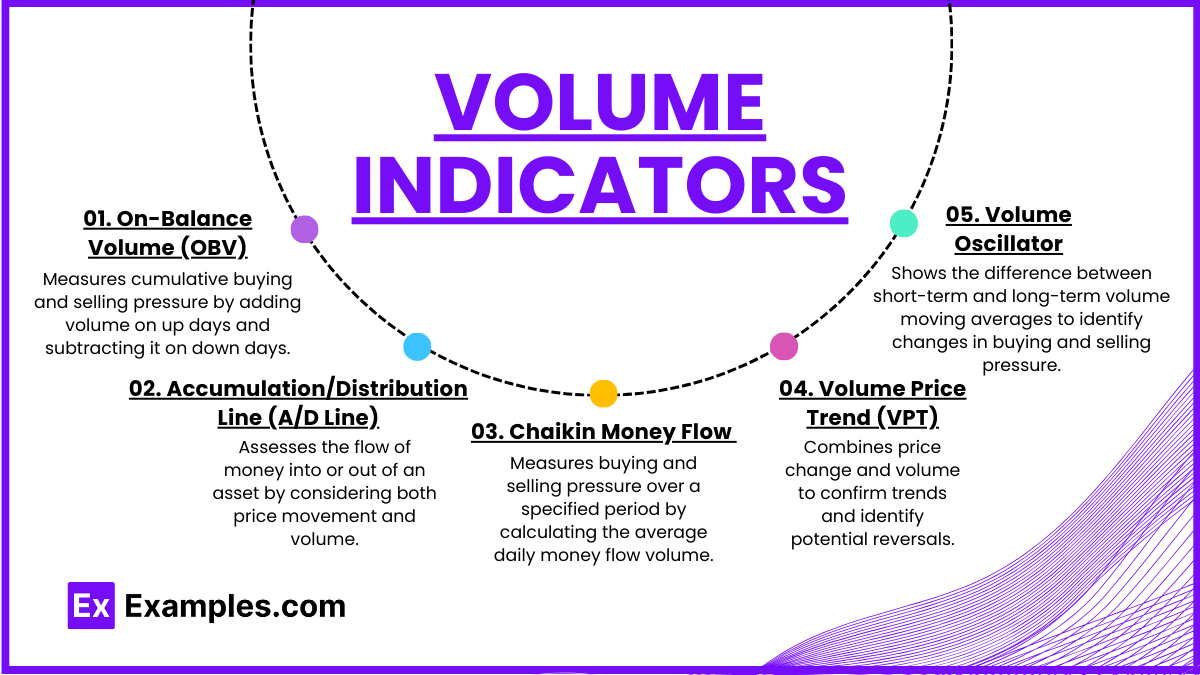
Volume indicators are essential tools in technical analysis, helping traders gauge the strength and direction of a trend by analyzing the trading volume. Volume reflects the intensity of interest in an asset, and volume indicators are used to confirm price movements or warn of potential reversals. Here are some of the most widely used volume indicators:
1. On-Balance Volume (OBV)
- Purpose: Measures cumulative buying and selling pressure by adding volume on up days and subtracting it on down days.
- Interpretation: Rising OBV confirms an uptrend, while falling OBV suggests a downtrend. Divergence between OBV and price may indicate a potential reversal.
2. Accumulation/Distribution Line (A/D Line)
- Purpose: Assesses the flow of money into or out of an asset by considering both price movement and volume.
- Interpretation: An upward-moving A/D line during a price increase signals strong buying interest, while divergence can indicate weakness in the trend.
3. Chaikin Money Flow (CMF)
- Purpose: Measures buying and selling pressure over a specified period by calculating the average daily money flow volume.
- Interpretation: Positive CMF values suggest buying pressure, while negative values indicate selling pressure.
4. Volume Price Trend (VPT)
- Purpose: Combines price change and volume to confirm trends and identify potential reversals.
- Interpretation: Rising VPT supports an uptrend, while a decline in VPT suggests a downtrend. Divergence between VPT and price can indicate a possible reversal.
5. Volume Oscillator
- Purpose: Shows the difference between short-term and long-term volume moving averages to identify changes in buying and selling pressure.
- Interpretation: Positive values suggest strong volume and potential trend continuation, while negative values may warn of weakening momentum.
Momentum Oscillators
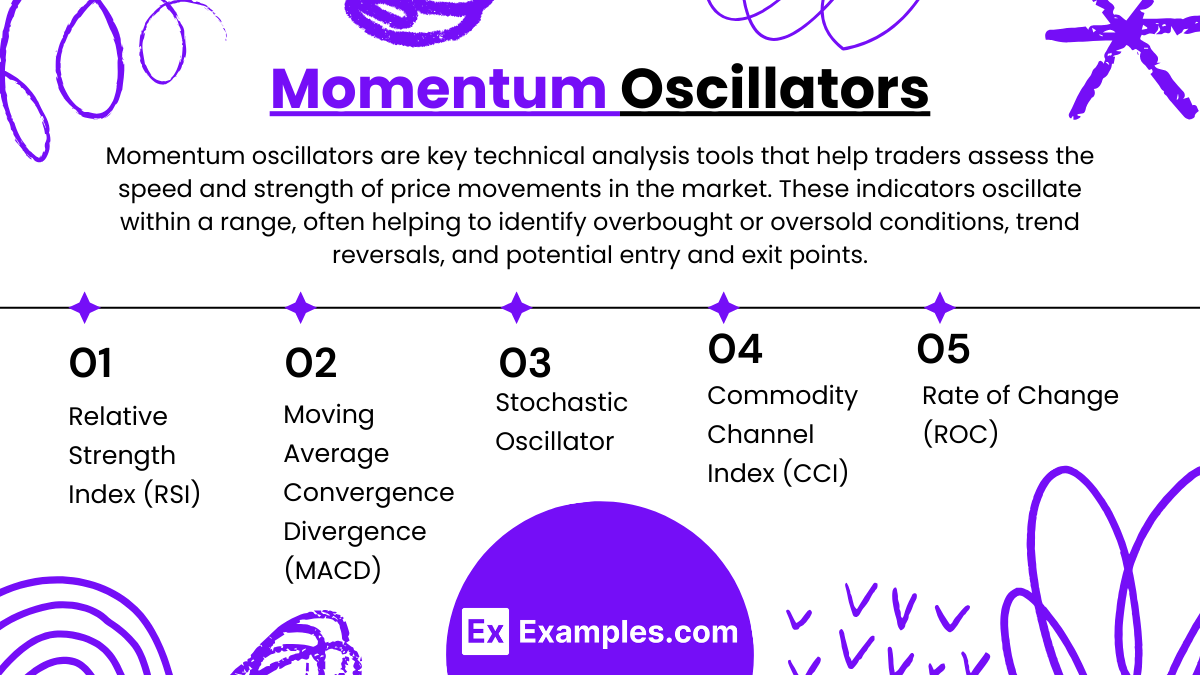
Momentum oscillators are key technical analysis tools that help traders assess the speed and strength of price movements in the market. These indicators oscillate within a range, often helping to identify overbought or oversold conditions, trend reversals, and potential entry and exit points. Here’s an overview of popular momentum oscillators:
1. Relative Strength Index (RSI)
- Purpose: Measures the magnitude of recent price gains to recent losses, typically on a scale from 0 to 100.
- Interpretation: Values above 70 indicate overbought conditions (potential sell signal), while values below 30 suggest oversold conditions (potential buy signal). RSI divergence from price movement may indicate an upcoming reversal.
2. Moving Average Convergence Divergence (MACD)
- Purpose: Tracks changes in the strength, direction, momentum, and duration of a trend by comparing short- and long-term moving averages.
- Interpretation: A positive MACD line crossing above the signal line suggests a bullish trend, while a negative cross indicates a bearish trend. Divergence between MACD and price can signal a possible reversal.
3. Stochastic Oscillator
- Purpose: Compares a stock’s closing price to its price range over a specific period, typically within a 0 to 100 scale.
- Interpretation: Values above 80 indicate overbought conditions, and values below 20 suggest oversold conditions. Crossovers between the %K and %D lines can also signal potential trend shifts.
4. Commodity Channel Index (CCI)
- Purpose: Measures the deviation of a security’s price from its average price over a set period.
- Interpretation: CCI values above +100 indicate overbought conditions, while values below -100 suggest oversold conditions. High or low readings can signify price extremes and potential reversals.
5. Rate of Change (ROC)
- Purpose: Measures the percentage change in price over a specific time frame, indicating price momentum.
- Interpretation: Positive ROC values suggest bullish momentum, while negative values indicate bearish momentum. Extreme ROC readings can suggest overbought or oversold conditions, potentially signaling a reversal.
Integration of Market Strength Tools
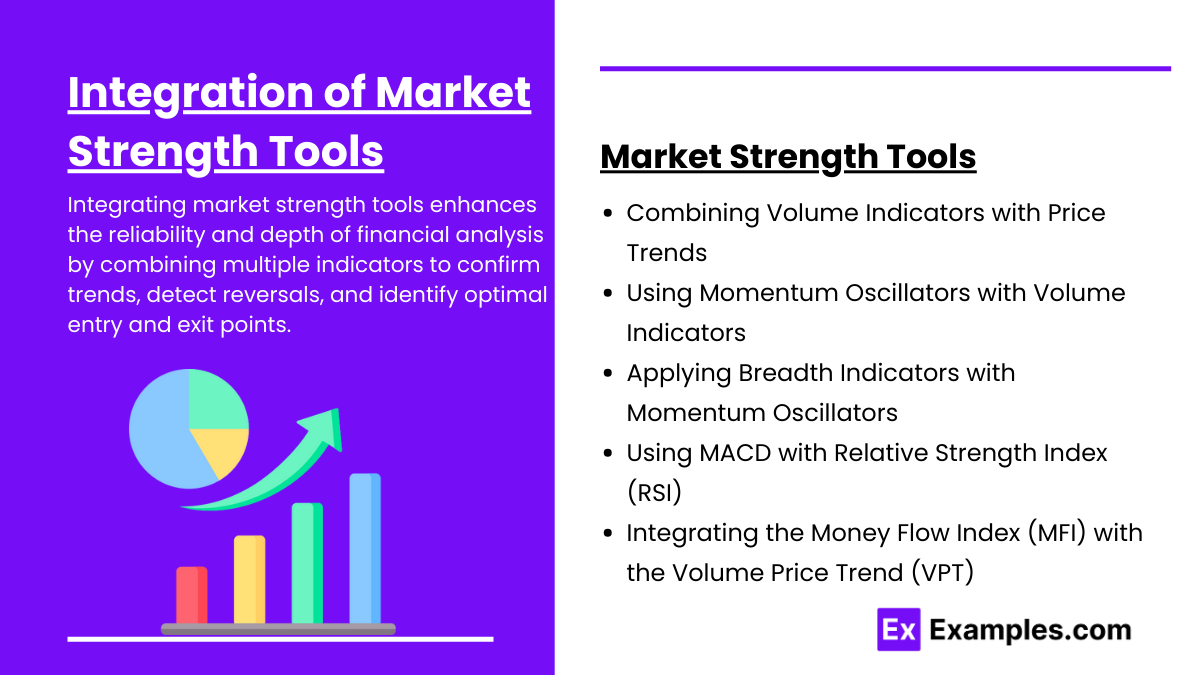
Integrating market strength tools enhances the reliability and depth of financial analysis by combining multiple indicators to confirm trends, detect reversals, and identify optimal entry and exit points. Here’s how various market strength tools can be integrated effectively:
1. Combining Volume Indicators with Price Trends
- Use volume indicators like On-Balance Volume (OBV) or the Accumulation/Distribution (A/D) Line alongside price trends.
- If price rises are supported by rising OBV or A/D, it indicates a strong trend. Conversely, declining volume with price increase might suggest a weakening trend, potentially signaling a reversal.
2. Using Momentum Oscillators with Volume Indicators
- Momentum oscillators like RSI or MACD are paired with volume indicators to confirm trend strength.
- High RSI values along with increasing volume support a strong uptrend, while high RSI but declining volume may indicate an overbought condition and potential price correction.
3. Applying Breadth Indicators with Momentum Oscillators
- Use breadth indicators, like the Advance/Decline (A/D) Line, with oscillators such as the Stochastic Oscillator to gauge market-wide strength and sentiment.
- An A/D Line showing broad market strength along with a Stochastic Oscillator in the mid-range (neither overbought nor oversold) suggests a healthy, sustainable trend. Divergence between breadth and momentum indicators may signal an impending trend change.
4. Using MACD with Relative Strength Index (RSI)
- Combine MACD, which measures trend direction, with RSI, which indicates overbought or oversold conditions.
- When both MACD and RSI give bullish signals (e.g., MACD line crosses above the signal line, and RSI is in the 50-70 range), it strengthens the case for an uptrend. Contrarily, a bearish MACD cross and an overbought RSI (above 70) can signal a potential price drop.
5. Integrating the Money Flow Index (MFI) with the Volume Price Trend (VPT)
- Use the MFI, a volume-weighted RSI, with VPT to analyze buying or selling pressure.
- An increasing MFI alongside a rising VPT supports the current price trend with strong volume, suggesting sustained interest. If VPT is declining while MFI is high, it might indicate overbought conditions and possible trend weakening.
Examples
Examples 1: Tech Sector Bull Run
- Analysis of the tech sector’s strong performance using volume indicators and momentum oscillators. This example would explore how rising volumes and high RSI readings indicated sustained buying interest during the bull run.
Examples 2: Commodity Market Volatility
- Study of commodity markets, such as oil or gold, during periods of high volatility. Utilize the On-Balance Volume (OBV) and MACD to determine the underlying strength or weakness of market moves, identifying potential reversal points based on divergence.
Examples 3: Forex Market Reactions to Economic
- Examination of major currency pairs reacting to economic news releases. Analysis would focus on sentiment indicators and stochastic oscillators to gauge immediate market strength and predict subsequent price movements.
Examples 4: Impact of Interest Rate Changes on Stock Markets
- Investigation of how interest rate decisions by central banks affect the stock market. This study would use advance/decline lines and volume analysis to measure market breadth and strength following such announcements.
Examples 5: Cryptocurrency Rallies and Crashes
- Detailed analysis of cryptocurrency market movements, especially during rapid rallies and sudden crashes. Application of sentiment analysis tools alongside traditional strength indicators like RSI and MACD to assess market conditions and predict potential turning points.
Practice Questions
Question 1
Which indicator is best used for confirming a trend based on the volume of trades?
A. Relative Strength Index (RSI)
B. Moving Average Convergence Divergence (MACD)
C. On-Balance Volume (OBV)
D. Stochastic Oscillator
Answer:
C. On-Balance Volume (OBV)
Explanation:
The On-Balance Volume (OBV) indicator is particularly useful for confirming the strength of a trend based on trading volume. OBV adds volume on up days and subtracts volume on down days, providing insights into whether volume is flowing into or out of a security, thus confirming the trend’s robustness.
Question 2
Which momentum oscillator is typically employed to identify overbought or oversold conditions in a market?
A. Volume Rate of Change
B. Relative Strength Index (RSI)
C. Accumulation/Distribution Line
D. Advance/Decline Line
Answer:
B. Relative Strength Index (RSI)
Explanation:
The Relative Strength Index (RSI) is a momentum oscillator widely used to identify overbought or oversold conditions in a market. It measures the speed and change of price movements on a scale from 0 to 100. An RSI reading above 70 typically suggests overbought conditions, while below 30 indicates oversold conditions.
Question 3
What does the Advance/Decline Line (A/D Line) help to measure?
A. The strength of market trends based on volume
B. The momentum of market prices
C. The breadth of market participation
D. The speed of price changes in the market
Answer:
C. The breadth of market participation
Explanation:
The Advance/Decline Line (A/D Line) is a market breadth indicator that measures the number of advancing stocks versus the number of declining stocks. This indicator helps to assess the overall participation in a market move, indicating whether the movement is broadly supported or not. A rising A/D Line suggests broad market participation in an uptrend, which can reinforce the strength of the trend.

