Moving averages are essential tools in technical analysis for the CMT Exam, helping analysts identify and confirm trends by smoothing price data over a specific period. By calculating averages, these indicators reduce market noise, making it easier to detect trend direction and potential reversals. Common types include Simple Moving Averages (SMA) and Exponential Moving Averages (EMA), each suited to different market scenarios. Moving averages also serve as dynamic support and resistance levels, guiding traders in making strategic entry and exit decisions based on market momentum and trend strength.
Learning Objectives
In studying "Moving Averages" for the CMT Exam, you should learn to understand various moving average types, including Simple, Exponential, and Weighted Moving Averages. Examine how these tools help identify trends, reversals, and support or resistance levels. Analyze moving average crossovers, such as the Golden and Death Cross, to interpret signals for potential market entry and exit points. Additionally, evaluate the use of moving averages as dynamic support and resistance in trending markets and understand their role in smoothing data to reduce volatility. Apply this knowledge to recognizing trend strength and predicting momentum shifts in market analysis.
Moving Averages Overview
Moving averages are a fundamental tool in technical analysis, primarily used to smooth out price data, identify trends, and reduce the noise in volatile price movements. They are essential in identifying the direction of a trend and potential reversal points.
Types of Moving Averages
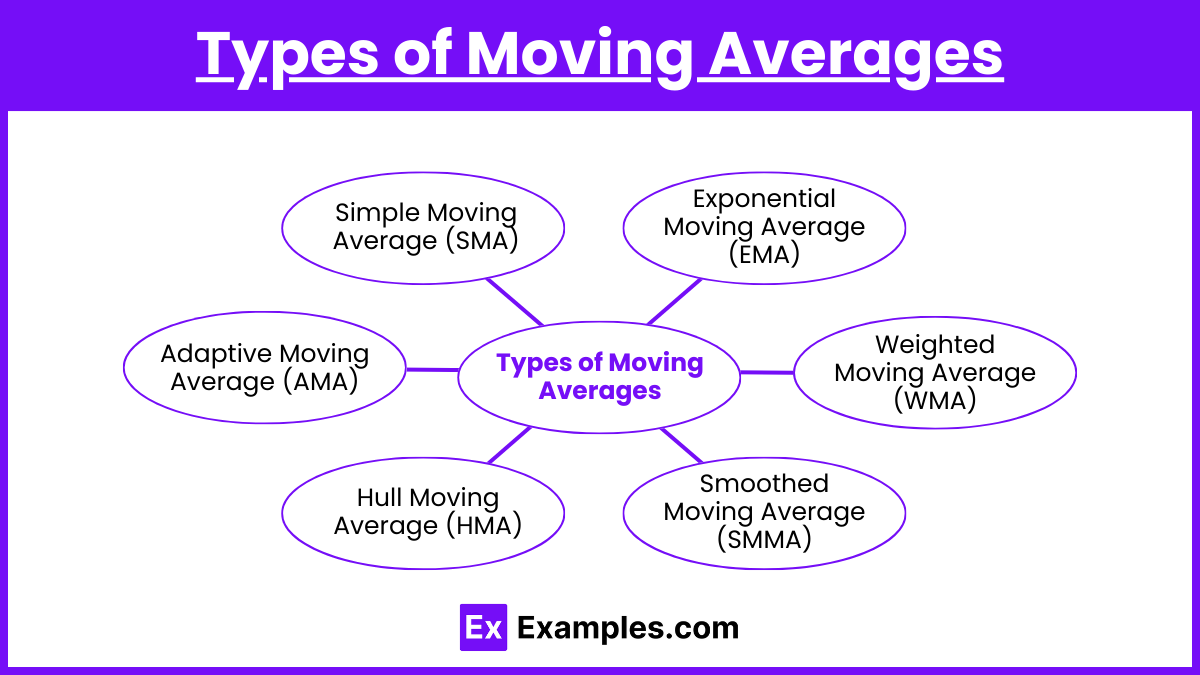
Simple Moving Average (SMA): This is calculated by taking the arithmetic mean of a set number of data points. Each point has equal weight, so SMA tends to be slower to react to price changes compared to other types.Calculates the average price over a specific period, giving equal weight to each data point. SMA is slower to react to price changes, making it useful for identifying long-term trends.
Formula: SMA=n∑(Pt)
Application: Commonly used for trend identification in both short and long-term timeframes.
Exponential Moving Average (EMA): This type gives more weight to recent prices, making it more responsive to recent price movements. The EMA formula includes a smoothing factor. Places more weight on recent prices, making it more responsive to current price movements. EMA is favored in short-term trading for its quick reaction to price shifts.
Formula: EMA=Pt×(n+12)+EMAprev×(1−n+12)
Application: Often preferred by short-term traders for faster response to price shifts.
Weighted Moving Average (WMA): This assigns varying weights to each price point, with recent prices receiving more weight than older ones. Assigns specific weights to each price in the period, with recent prices receiving more weight. WMA offers flexibility but is less commonly used than SMA or EMA.
Application: Less common but useful in scenarios where specific time frames or prices should have priority.
Smoothed Moving Average (SMMA): Averages price data over a long period, reacting slowly to price changes and smoothing out volatility. SMMA is helpful for filtering out noise in fluctuating markets.
Hull Moving Average (HMA): Designed to reduce lag and improve responsiveness, the HMA uses weighted moving averages of different periods to smooth the data while remaining highly sensitive to price changes. It’s often used by traders aiming to balance accuracy with timely trend signals.
Adaptive Moving Average (AMA): This moving average adapts its speed based on market volatility. During high volatility, it becomes more responsive, while in low volatility, it slows down to filter out noise. AMA is popular among traders looking to adjust their strategy in varying market conditions.
Practical Uses of Moving Averages
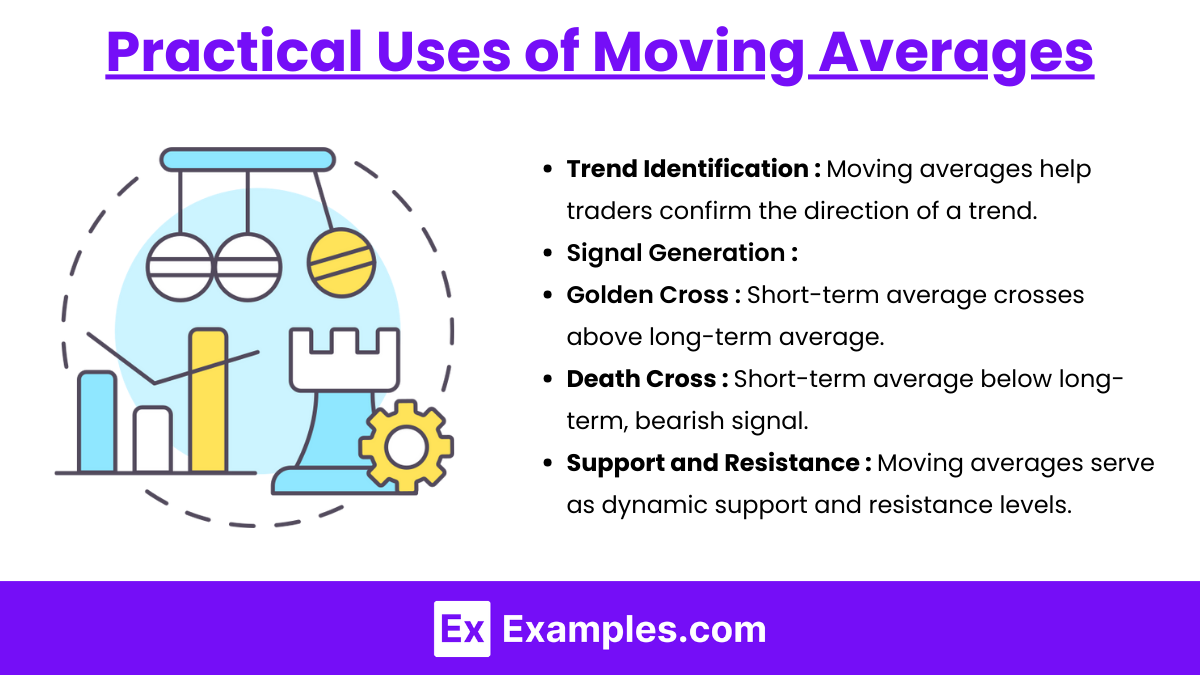
Trend Identification: Moving averages help traders confirm the direction of a trend. For example, an upward trend is typically confirmed when prices stay above a moving average, while a downward trend is indicated by prices remaining below.
Signal Generation:
Golden Cross: When a short-term moving average crosses above a long-term moving average, often considered a bullish signal.
Death Cross: Occurs when a short-term moving average crosses below a long-term moving average, indicating potential bearishness.
Support and Resistance: Moving averages often act as dynamic support or resistance levels. For instance, prices frequently bounce off a long-term moving average during a strong trend.
Period Selection
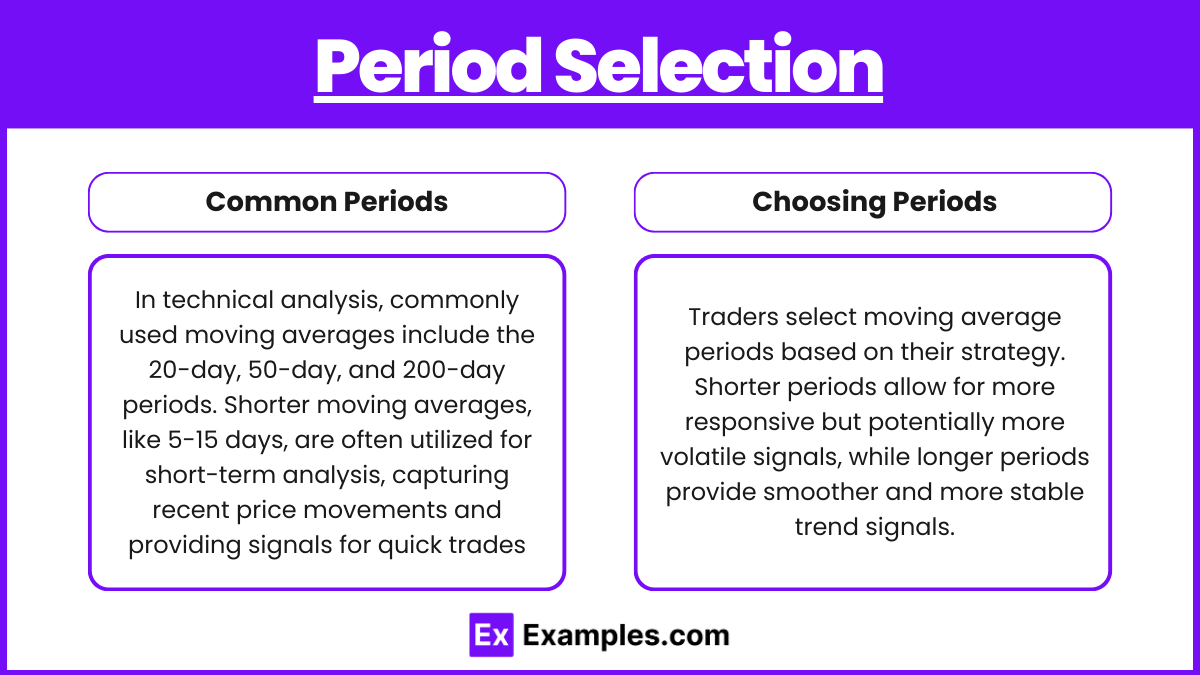
Common Periods: 20-day, 50-day, and 200-day moving averages are typical in market analysis. Shorter periods (5-15 days) are used for short-term analysis, while longer ones (100-200 days) assess long-term trends.In technical analysis, commonly used moving averages include the 20-day, 50-day, and 200-day periods. Shorter moving averages, like 5-15 days, are often utilized for short-term analysis, capturing recent price movements and providing signals for quick trades
Choosing Periods: Traders select moving average periods based on their strategy. Shorter periods allow for more responsive but potentially more volatile signals, while longer periods provide smoother and more stable trend signals.
Limitations of Moving Averages
Lagging Nature: Moving averages are based on historical data, so they lag behind price movements and may not react quickly to sudden market changes.
False Signals: In volatile or ranging markets, moving averages can generate misleading signals or “whipsaws.”
Selection Sensitivity: Results can vary significantly depending on the period selected, so it’s essential to align moving average parameters with the asset's behavior and trading strategy.
Examples
Example 1: Using Moving Averages for Trend Confirmation
Moving averages help to confirm the direction of a market trend. For instance, in a strong uptrend, prices typically remain above a longer moving average, such as the 50-day or 200-day SMA. Conversely, during a downtrend, prices often stay below these averages. Traders use this to validate the trend's direction and to hold onto a position as long as the price remains aligned with the moving average. This method is common in both long-term investments and short-term trades, with different moving average periods aligning with the desired investment horizon.
Example 2 : Golden Cross and Death Cross Signals
The “Golden Cross” occurs when a short-term moving average (e.g., 50-day) crosses above a long-term moving average (e.g., 200-day), indicating a bullish reversal and potential buy signal. The opposite, the “Death Cross,” happens when a short-term moving average crosses below a long-term moving average, signaling potential bearishness and often a sell signal. These crossover signals are widely used by traders to enter or exit trades based on trend direction. These crosses are considered stronger indicators on daily or weekly time frames, as they reduce the likelihood of false signals seen in shorter intervals.
Example 3 : Moving Average Envelopes to Identify Volatility
Moving average envelopes are bands plotted at a fixed percentage above and below a moving average. For instance, an analyst may set envelopes at 2% above and below a 20-day SMA. When prices move outside these envelopes, it can signal overbought or oversold conditions, suggesting potential reversals. This technique is particularly useful in volatile markets where price tends to fluctuate within a predictable range around a central trend, helping traders set entry and exit points based on price behavior relative to these bands.
Example 4 : Dynamic Support and Resistance Levels
Moving averages, particularly the 50-day and 200-day SMAs, often act as dynamic support or resistance. For example, in an uptrend, the price may fall back to "test" the 50-day moving average, providing a potential buying opportunity before the trend resumes upward. Similarly, in a downtrend, prices might rise to the moving average, where they meet resistance and potentially turn downward again. These levels are considered dynamic because they change over time with the moving average itself, offering traders adaptable support and resistance points in both trending and volatile markets.
Example 5 : Short-Term vs. Long-Term Moving Averages in Trading Strategies
Traders often use combinations of short-term and long-term moving averages to create signals. For example, a common strategy involves using the 5-day EMA for short-term trades, while the 20-day EMA may be used for medium-term analysis. When the short-term moving average crosses above the long-term average, it suggests increasing momentum in the direction of the trade, often prompting traders to open positions. Conversely, when the short-term average crosses below, it signals a potential exit point. By tailoring the moving average periods, traders align their strategy with specific time frames, making moving averages versatile tools across various market conditio
Practice Questions
Question 1
What does a "Golden Cross" signal in moving average analysis?
A. The beginning of a downward trend
B. The confirmation of a bearish reversal
C. A short-term moving average crossing above a long-term moving average, signaling potential bullish momentum
D. A short-term moving average crossing below a long-term moving average, indicating a bearish signal
Answer: C. A short-term moving average crossing above a long-term moving average, signaling potential bullish momentum.
Explanation: A Golden Cross occurs when a shorter-term moving average (such as the 50-day SMA) crosses above a longer-term moving average (like the 200-day SMA). This crossover is generally seen as a bullish signal, indicating the potential for an upward trend. The Golden Cross suggests that recent price momentum has been strong enough to push the short-term moving average above the long-term average, often prompting traders to consider buying opportunities. Conversely, a “Death Cross” signals bearish momentum, occurring when the short-term average crosses below the long-term one.
Question 2
Which of the following best describes the primary function of moving averages in technical analysis?
A. Predicting the exact high and low points of a market
B. Acting as static support and resistance levels
C. Smoothing price data to help identify the direction and strength of a trend
D. Providing precise entry and exit points based on past price volatility
Answer: C. Smoothing price data to help identify the direction and strength of a trend.
Explanation: Moving averages smooth out price data by averaging out fluctuations over a selected period, making it easier to observe the general direction of the trend. This smoothing effect reduces noise in volatile markets, enabling analysts to better identify the trend's strength and direction. While moving averages can provide insights into support and resistance (referred to as “dynamic” rather than “static”), their primary role is not to predict exact market highs and lows but to offer a clearer view of the market’s overall trend.
Question 3
If a 20-day Exponential Moving Average (EMA) is placed on a chart, how will it primarily differ in behavior compared to a 20-day Simple Moving Average (SMA)?
A. The EMA will react more slowly to recent price changes than the SMA
B. The EMA will give equal weight to all 20 days, whereas the SMA gives more weight to recent prices
C. The EMA will react more quickly to recent price changes, giving more weight to the latest prices
D. The EMA will be unaffected by large price spikes, unlike the SMA
Answer: C. The EMA will react more quickly to recent price changes, giving more weight to the latest prices.
Explanation: The Exponential Moving Average (EMA) differs from the Simple Moving Average (SMA) in that it applies more weight to recent prices, making it more responsive to new price data. This weighting allows the EMA to react faster to price movements, which can be especially beneficial in volatile markets. The SMA, by contrast, gives equal weight to each price in the period, so it reacts more slowly to recent price shifts. This characteristic makes the EMA a preferred choice for traders who need quicker signals in rapidly changing markets.

