Preparing for the CMT Exam requires a solid understanding of moving averages, a fundamental component of technical analysis. Mastery of simple, exponential, and weighted moving averages is essential, as these indicators help identify trends, potential reversals, and entry or exit points in trading. This knowledge is crucial for maximizing technical analysis skills on the CMT.
Learning Objective
In studying "Moving Averages" for the CMT Exam, you should aim to understand various types of moving averages, including simple, exponential, and weighted. Analyze how moving averages are used to identify trends, smooth price data, and signal potential reversals in financial markets. Evaluate the differences in responsiveness among these types and learn how to apply them effectively for short- and long-term trading strategies. Additionally, explore crossover strategies, such as the golden and death cross, and how these can indicate market sentiment shifts. Apply this understanding to interpret charts and make data-driven decisions in technical analysis passages on the CMT.
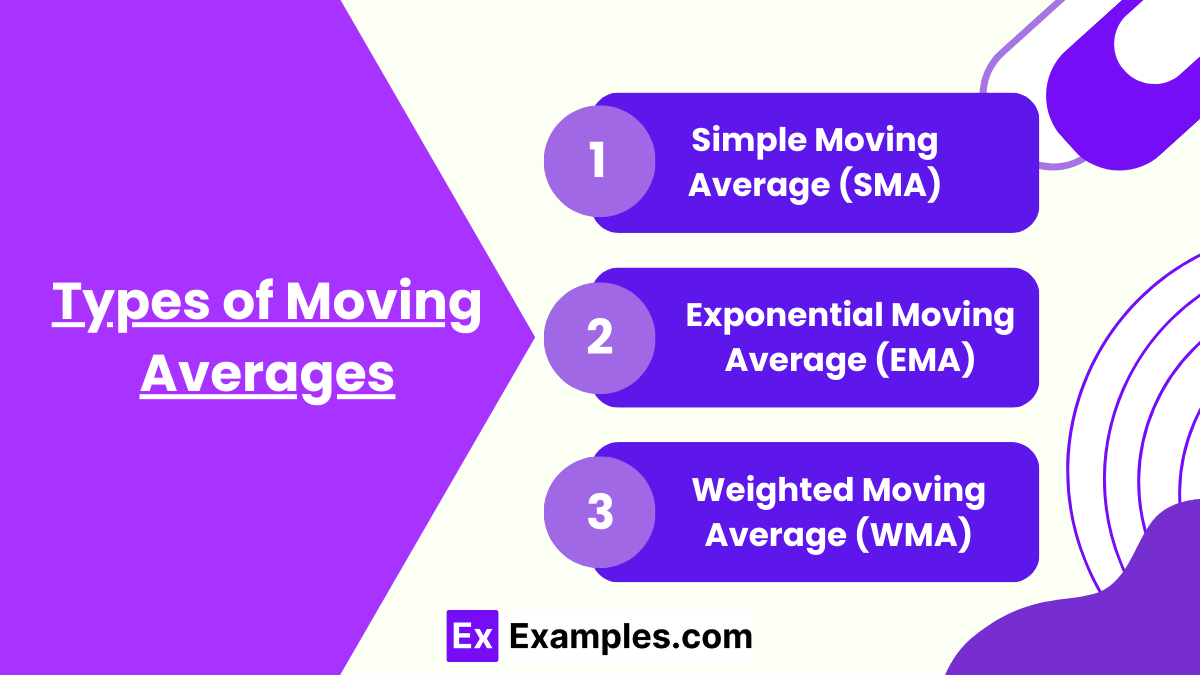
Types of Moving Averages
1. Simple Moving Average (SMA)
Definition: The Simple Moving Average (SMA) is calculated by taking the average of a specific number of past prices, usually closing prices, over a set period.
Formula: For a 10-day SMA, add the closing prices of the last 10 days and divide by 10.
Application: SMAs are often used to smooth out short-term fluctuations and identify the direction of the trend. They’re effective for observing longer-term trends in price data.
Advantages: The SMA is easy to calculate and interpret, making it a common starting point for new traders.
Limitations: It gives equal weight to each price in the period, which can make it less responsive to recent changes in price, potentially delaying trading signals.
2. Exponential Moving Average (EMA)
Definition: The Exponential Moving Average (EMA) is similar to the SMA but assigns more weight to recent prices, making it more sensitive to current price changes.
Formula: The EMA calculation uses a smoothing factor to give more emphasis to recent prices, making it more reactive to new information.
Application: EMAs are commonly used in short-term trading strategies because of their responsiveness to recent price action. They’re particularly popular for identifying fast-moving trends and providing timely entry and exit signals.
Advantages: EMAs react faster to recent price changes, allowing traders to capture trends sooner.
Limitations: The increased sensitivity can make EMAs more susceptible to false signals in highly volatile markets.
3. Weighted Moving Average (WMA)
Definition: The Weighted Moving Average (WMA) assigns different weights to each price within the calculation period, with more weight on recent prices and less on older prices.
Formula: In a 10-day WMA, each day’s price is multiplied by a different factor (e.g., the 10th day by 10, the 9th by 9, and so on) before calculating the average.
Application: WMA is useful in scenarios where quick reactions to price changes are essential, such as in fast-moving markets. It combines the smoothing effect of the SMA with the responsiveness of the EMA.
Advantages: WMAs provide an additional level of customization, allowing traders to adjust the weightings based on market conditions.
Limitations: They can be more complex to calculate, and the high responsiveness might lead to frequent trading signals, potentially causing over-trading.
Choosing the Right Moving Average
SMA for Long-Term Analysis: SMAs are generally better suited for identifying and following longer-term trends due to their slower reaction to price fluctuations.
EMA for Short-Term Trading: EMAs, due to their sensitivity to recent price data, are popular among traders looking to react quickly to market changes.
WMA for Dynamic Weighting: The WMA provides a balance, suitable for traders who want to emphasize recent price action but still maintain some smoothing over time.
Applications of Moving Averages in Trend Identification
Moving averages are widely used by technical analysts to smooth out price data, helping them recognize trends in financial markets more clearly. Here are the main ways moving averages assist in trend identification:
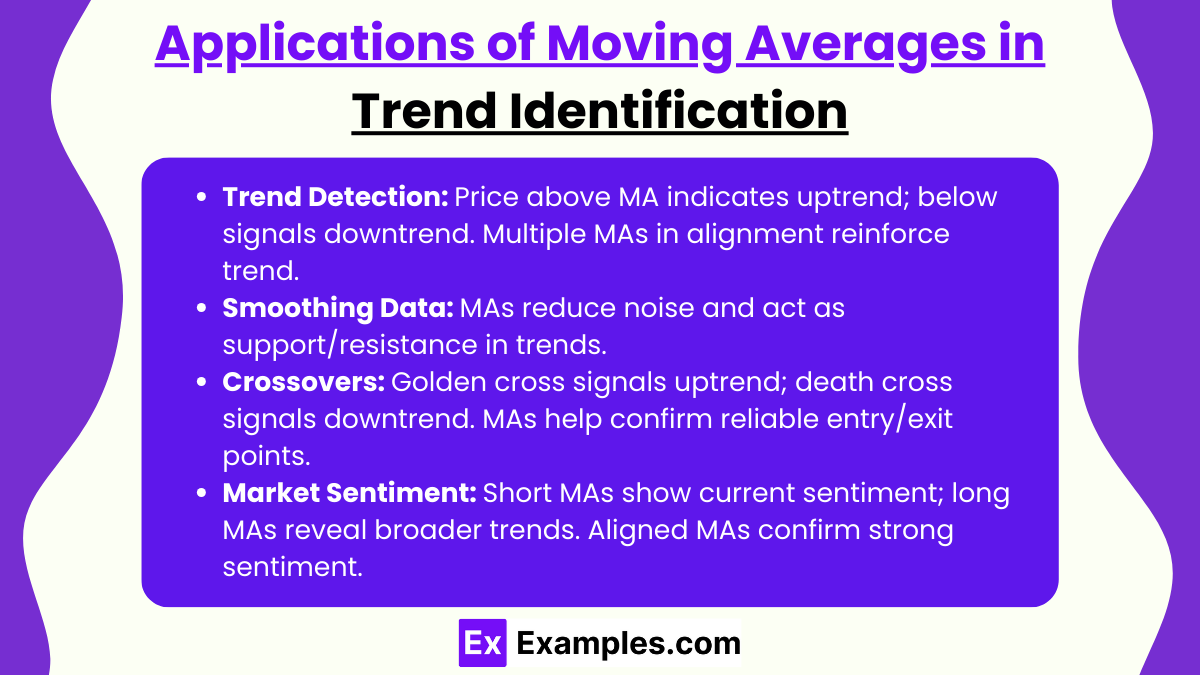
1. Trend Detection
Identifying the Direction of the Trend: Moving averages are powerful tools for determining the direction of a trend. When a stock or asset's price consistently stays above its moving average, it generally indicates an uptrend. Conversely, if the price remains below the moving average, it often signals a downtrend.
Application Across Timeframes: Moving averages can be applied across different timeframes (e.g., 10-day, 50-day, 200-day) to analyze trends over various periods. Shorter moving averages (e.g., 10-day) highlight short-term trends, while longer ones (e.g., 200-day) reveal long-term trends.
Signal Reinforcement: When multiple moving averages align (e.g., both 50-day and 200-day moving averages trending upward), they provide a stronger confirmation of the trend.
2. Smoothing Price Data
Reducing Market "Noise": Moving averages help reduce daily market noise by averaging out erratic price movements, allowing traders to see the overall trend rather than focusing on short-term fluctuations.
Clearer Visualization of Trends: By smoothing out price data, moving averages make it easier to visualize whether the market is moving upwards, downwards, or sideways.
Support and Resistance Levels: Moving averages often act as dynamic support or resistance levels. For instance, in an uptrend, the price may "bounce" off a moving average, using it as support. In a downtrend, the moving average may act as resistance, preventing the price from moving higher.
3. Crossovers as Trend Signals
Golden Cross and Death Cross: Crossovers between moving averages often signal changes in the trend. A "golden cross" occurs when a short-term moving average (e.g., 50-day) crosses above a long-term moving average (e.g., 200-day), indicating a potential shift to an uptrend. A "death cross," where the short-term average crosses below the long-term average, may signal a downtrend.
Entry and Exit Points: Traders use these crossover signals as entry and exit points. For instance, a golden cross may prompt a buy, while a death cross may prompt a sell or short position.
Reducing False Signals: Combining multiple moving averages (e.g., short-term and long-term) helps reduce false signals, as a crossover between them often provides a stronger indication of trend changes than relying on a single moving average.
4. Determining Market Sentiment
Shorter Moving Averages Reflect Market Sentiment: Short-term moving averages (like the 10-day EMA) quickly reflect current market sentiment, making them valuable for traders who want to capture quick shifts in trend.
Longer Moving Averages for Stable Trends: Long-term moving averages (like the 200-day SMA) reflect the broader market trend and sentiment, helping long-term investors remain focused on the big picture despite short-term volatility.
Aligning Short- and Long-Term Trends: When both short-term and long-term moving averages are moving in the same direction, it signals strong market sentiment. For example, an upward-sloping 50-day moving average along with a 200-day moving average indicates consistent bullish sentiment
Moving Average Crossovers
A moving average crossover occurs when two moving averages of different timeframes intersect on a price chart. Crossovers are powerful tools for technical analysts, as they often signal potential shifts in market direction, helping traders identify entry and exit points. Let’s explore the main types of crossovers and their applications:
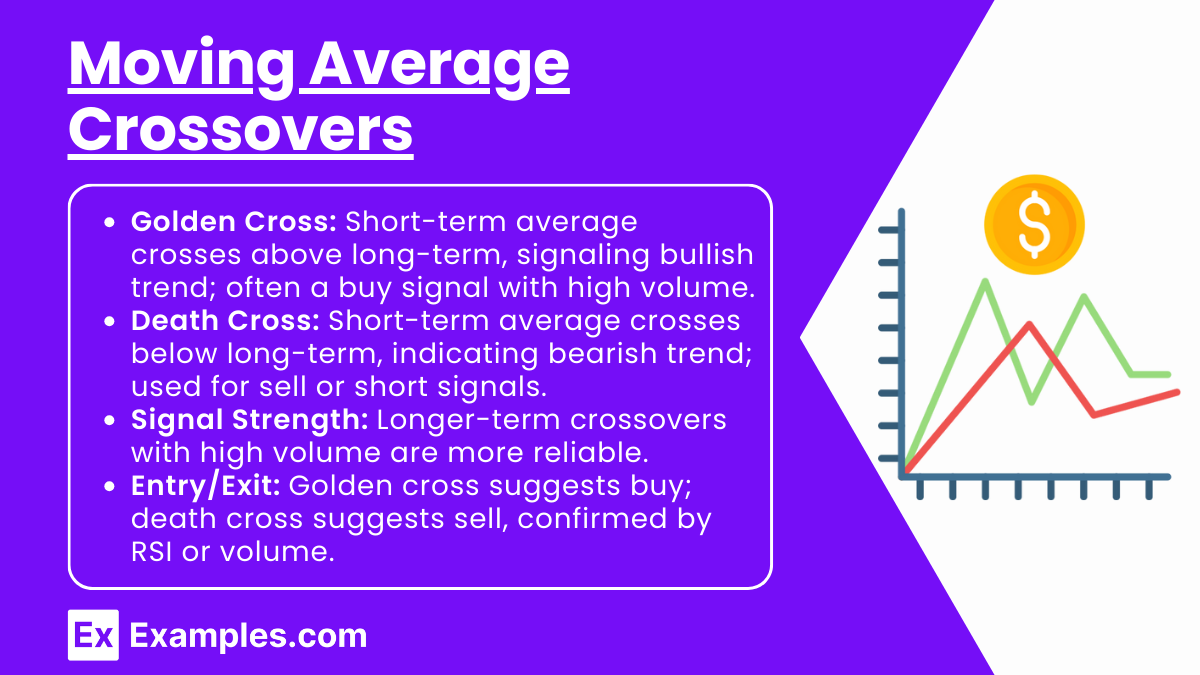
1. Golden Cross
Definition: A golden cross occurs when a shorter-term moving average crosses above a longer-term moving average. For instance, a common golden cross signal is when the 50-day moving average crosses above the 200-day moving average.
Interpretation: The golden cross is widely viewed as a bullish signal, indicating a potential shift from a downtrend to an uptrend. It suggests that short-term momentum is accelerating, often leading to a continuation of the upward trend.
Application: Traders may use the golden cross as a signal to initiate a buy position, expecting that prices may continue to rise. It’s especially strong when accompanied by high trading volume.
2. Death Cross
Definition: The death cross is the opposite of the golden cross. It occurs when a shorter-term moving average crosses below a longer-term moving average, commonly when the 50-day moving average falls below the 200-day moving average.
Interpretation: The death cross is generally considered a bearish signal, suggesting a potential shift from an uptrend to a downtrend. It indicates that short-term momentum is weakening, often leading to a continuation of the downward trend.
Application: Traders often view the death cross as a signal to sell or initiate a short position, expecting prices to decline further.
3. Signal Strength and Market Context
Timeframes and Reliability: Crossovers on longer timeframes (e.g., 50-day and 200-day) tend to provide more reliable signals than shorter timeframes (e.g., 5-day and 20-day), as they reflect more stable trends. However, shorter-term crossovers are often used in active trading strategies to capitalize on rapid price changes.
Confirming Signals with Volume: Crossovers are considered more reliable when accompanied by high trading volume, as volume confirms the strength of the move. For example, a golden cross with high volume signals strong bullish momentum, increasing the likelihood of an extended uptrend.
Using Multiple Crossovers: Traders may use multiple moving averages (e.g., 10-day, 50-day, and 200-day) to gain a more comprehensive view of the trend. For example, if the 10-day crosses above the 50-day and 50-day is already above the 200-day, it shows a strong uptrend.
4. Entry and Exit Points
Golden Cross Entry Point: When the golden cross occurs, traders often enter a buy position or add to an existing position, anticipating further price gains.
Death Cross Exit Point: When the death cross occurs, traders may exit a long position or open a short position, expecting further price declines.
Minimizing False Signals: While crossovers are powerful indicators, they can occasionally produce false signals in choppy markets. To avoid this, traders often combine moving average crossovers with other indicators, such as the Relative Strength Index (RSI) or volume analysis, for added confirmation.
Interpreting Moving Averages in Technical Analysis
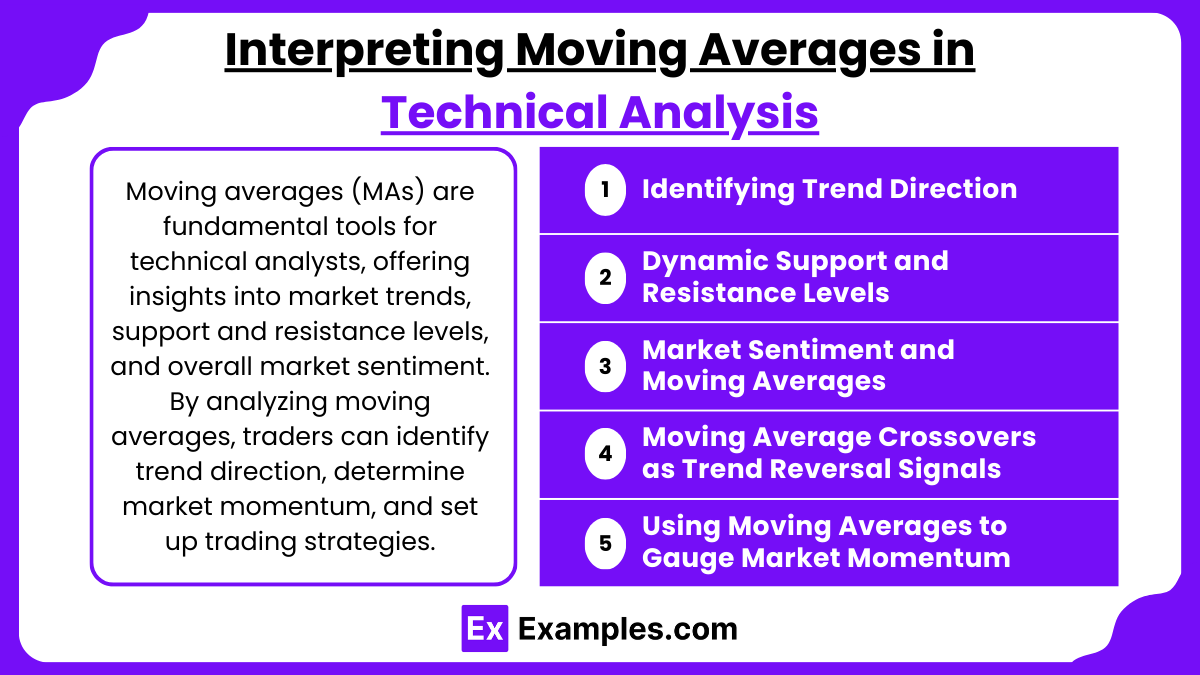
Moving averages (MAs) are fundamental tools for technical analysts, offering insights into market trends, support and resistance levels, and overall market sentiment. By analyzing moving averages, traders can identify trend direction, determine market momentum, and set up trading strategies. Here’s a closer look at the ways moving averages are interpreted:
1. Identifying Trend Direction
Uptrend: When the price remains above a moving average (e.g., 50-day or 200-day), it typically signals an uptrend. This suggests that demand is outpacing supply, driving prices higher.
Downtrend: If the price is consistently below a moving average, it’s often a sign of a downtrend, indicating supply is outpacing demand and pushing prices lower.
Flat/Sideways Trend: When the price hovers around a moving average, it usually indicates a sideways or consolidating market with no strong directional bias. This period can precede a breakout in either direction.
2. Dynamic Support and Resistance Levels
Support in an Uptrend: In an uptrend, moving averages can act as dynamic support levels. For instance, if the price approaches the 50-day MA during a pullback but doesn’t break below it, the moving average is acting as a support level.
Resistance in a Downtrend: In a downtrend, moving averages may act as resistance levels, capping price advances. If the price rises toward the moving average but fails to move above it, this indicates that the moving average is providing resistance.
Trend Continuation or Reversal Signals: A bounce off the moving average in the trend direction reinforces the trend, while a break of the moving average can signal a potential trend reversal.
3. Market Sentiment and Moving Averages
Short-Term Sentiment with Shorter MAs: Shorter moving averages (e.g., 10-day, 20-day) are sensitive to recent price changes and reflect current market sentiment. For example, a rising 20-day MA suggests bullish short-term sentiment, while a falling 20-day MA suggests bearish sentiment.
Long-Term Sentiment with Longer MAs: Longer moving averages (e.g., 200-day MA) represent the broader market trend and overall sentiment. When the price is above the 200-day MA, it reflects bullish long-term sentiment, while staying below it reflects bearish sentiment.
Confirming Market Sentiment with Multiple MAs: Traders often use multiple MAs to confirm sentiment. For instance, when the 50-day MA is above the 200-day MA, it suggests sustained bullish sentiment. Conversely, when the 50-day MA is below the 200-day MA, it indicates bearish sentiment.
4. Moving Average Crossovers as Trend Reversal Signals
Golden Cross and Death Cross: A golden cross (shorter MA crossing above a longer MA) indicates a potential bullish reversal, while a death cross (shorter MA crossing below a longer MA) signals a potential bearish reversal.
Timing Entries and Exits: Traders may interpret crossovers as entry or exit signals, using them as cues to enter long positions in a golden cross scenario or short positions in a death cross scenario.
Avoiding False Signals: To avoid false signals in volatile markets, traders often combine crossover signals with other indicators, such as volume or relative strength, to improve accuracy.
5. Using Moving Averages to Gauge Market Momentum
Slope of the Moving Average: The angle or slope of a moving average provides clues about market momentum. A steeply rising MA suggests strong upward momentum, while a steeply declining MA indicates strong downward momentum.
Periods of Consolidation: When the moving average flattens, it usually signals a loss of momentum and a possible consolidation period. This flattening can serve as a warning of a potential reversal or continuation of a trend.
Momentum Shift Signals: A flattening or change in the slope of the moving average may indicate a shift in market momentum, prompting traders to prepare for potential changes in trend direction.
Examples
Example 1
A trader uses a 50-day simple moving average (SMA) to identify the long-term trend of a stock. When the stock price consistently stays above the 50-day SMA, the trader interprets it as an uptrend and holds a long position. When the price drops below the 50-day SMA, they consider selling or exiting the position as it signals a potential trend reversal.
Example 2
An investor uses the 200-day SMA as a benchmark for market sentiment. When a stock trades above the 200-day SMA, it’s considered to be in a bullish phase, suggesting favorable long-term momentum. Conversely, if the stock remains below the 200-day SMA, the investor sees it as a bearish signal, indicating possible weakness in the market.
Example 3
A day trader applies the 10-day and 20-day exponential moving averages (EMAs) to monitor short-term trends in a volatile market. When the 10-day EMA crosses above the 20-day EMA (a golden cross), it signals a potential buying opportunity. If the 10-day EMA later crosses below the 20-day EMA (a death cross), the trader considers it a sell signal.
Example 4
A technical analyst uses moving averages to identify dynamic support and resistance levels. In an uptrend, the analyst notices the price repeatedly bounces off the 50-day EMA, which acts as support. When the price touches the moving average but does not break below it, they interpret this as a signal to add to their long position.
Example 5
A swing trader uses multiple moving averages to gauge market momentum. They monitor the slope of the 50-day and 100-day moving averages. If both are sharply sloping upward, the trader interprets this as strong upward momentum and a good time to hold long positions. If the moving averages begin to flatten, the trader anticipates a loss of momentum and prepares for a potential trend reversal
Practice Questions
Question 1
What is the primary purpose of using a moving average in technical analysis?
A) To predict the exact future price of a stock
B) To smooth out price data and reveal trends
C) To determine the intrinsic value of a stock
D) To calculate the dividend yield of a stock
Answer: B) To smooth out price data and reveal trends
Explanation:
Moving averages are used in technical analysis primarily to smooth out price fluctuations and highlight the direction of the trend. They provide a clearer view of whether a stock is trending up, down, or sideways, without attempting to predict exact future prices.
Question 2
In a "golden cross" signal, which of the following typically occurs?
A) A long-term moving average crosses below a short-term moving average
B) A short-term moving average crosses above a long-term moving average
C) Both moving averages remain equal
D) The stock price falls below both moving averages
Answer: B) A short-term moving average crosses above a long-term moving average
Explanation:
A golden cross occurs when a short-term moving average, such as the 50-day MA, crosses above a long-term moving average, like the 200-day MA. This crossover is generally considered a bullish signal, suggesting a potential upward trend.
Question 3
Which type of moving average is generally more responsive to recent price changes?
A) Simple Moving Average (SMA)
B) Exponential Moving Average (EMA)
C) Weighted Moving Average (WMA)
D) Linear Moving Average (LMA)
Answer: B) Exponential Moving Average (EMA)
Explanation:
The Exponential Moving Average (EMA) places more weight on recent prices, making it more responsive to recent price changes compared to the Simple Moving Average (SMA) and other types. This responsiveness makes EMA a popular choice for traders looking to capture short-term market moves.

