Preparing for the CMT Exam requires a comprehensive understanding of “Multiple Time Frames,” a vital aspect of technical analysis. This concept emphasizes the importance of analyzing price action across various time intervals to obtain a clearer market perspective. By examining longer time frames, traders can identify overarching trends, while shorter time frames highlight potential entry and exit points. Multiple Time Frame analysis allows traders to synchronize their strategies with broader market movements, minimizing risks and maximizing opportunities. Mastery of this approach enhances a trader’s ability to align short-term tactics with long-term objectives, increasing the precision and reliability of trading decisions.
Learning Objectives
In studying Multiple Time Frames for the CMT Exam, you should learn to understand its importance in analyzing market trends across different time horizons to gain a comprehensive perspective. Effective multiple time frame analysis involves examining longer time frames to identify primary trends while using shorter time frames for precise entry and exit points. This process includes correlating price action, volume, and trend strength across intervals to validate signals. Techniques such as top-down analysis, alignment of time frame strategies, and integration with broader market contexts help enhance decision-making. Mastery of multiple time frame analysis is crucial for improving trading precision and achieving success in the CMT Exam.
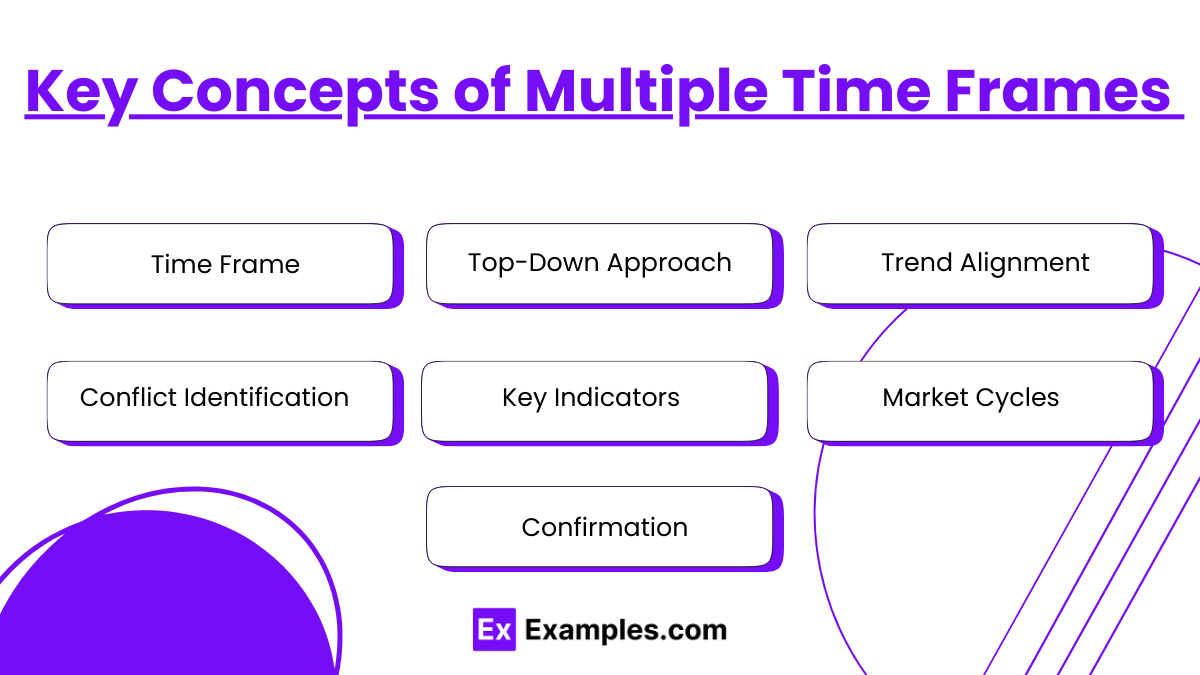
Key Concepts of Multiple Time Frames

- Time Frame :
- Long-term: Defines the overarching trend (e.g., monthly or weekly charts).
- Intermediate-term: Refines the analysis of the main trend (e.g., daily charts).
- Short-term: Pinpoints specific entry and exit points (e.g., hourly or minute charts).
- Top-Down Approach: Start with higher time frames to understand the macro trend, then drill down to lower time frames for detailed insights.
- Trend Alignment: Analyze if trends on different time frames align (e.g., bullish trend on daily and weekly charts).
- Conflict Identification: Recognize divergences between time frames to spot potential trend reversals or consolidation phases.
- Key Indicators: Use consistent technical indicators across time frames for comparative analysis (e.g., moving averages, RSI, MACD).
- Market Cycles: Multiple time frames can reveal the stage of a market cycle (accumulation, trend, or distribution).
- Confirmation: Use smaller time frames to confirm signals from larger time frames before executing trades.
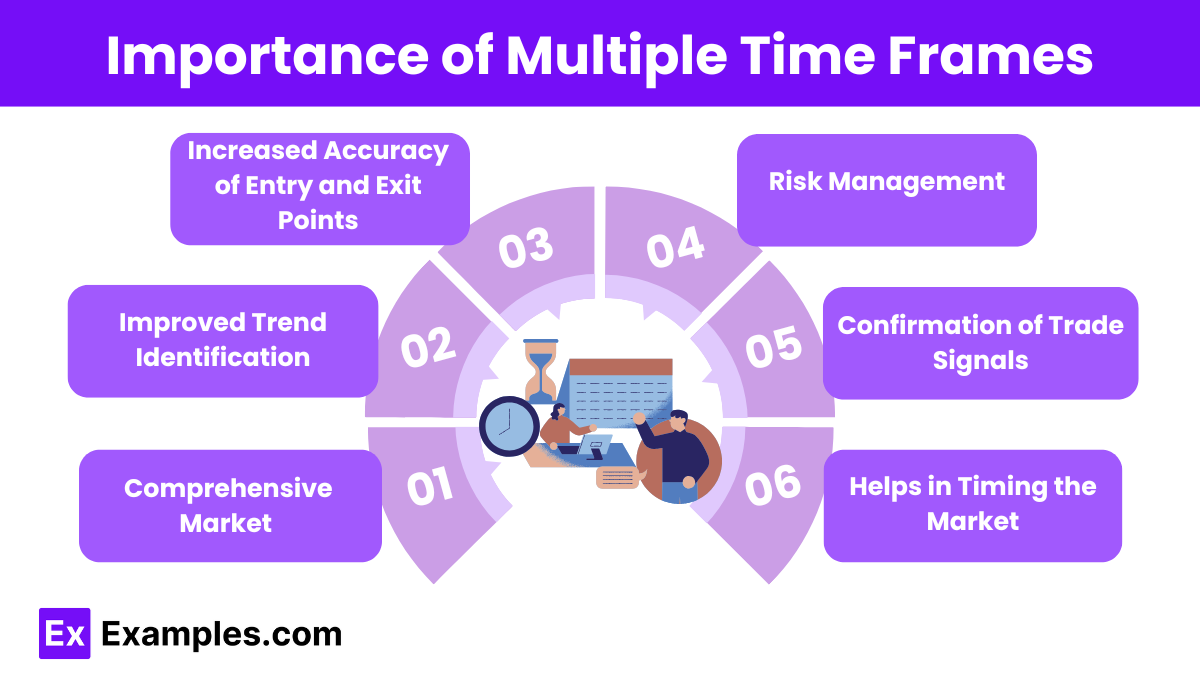
Importance of Multiple Time Frames

In both technical analysis and decision-making processes, multiple time frames (MTF) refer to the practice of analyzing a particular asset, trend, or market situation from the perspective of various time scales. This approach offers a broader view and deeper understanding of market behavior, providing several benefits:
- Comprehensive Market Overview
By analyzing an asset or trend across different time frames, traders and investors can gain a more complete picture of market dynamics. This includes identifying short-term fluctuations (e.g., on a 5-minute or hourly chart) while also understanding long-term trends (e.g., daily, weekly, or monthly charts). This broad view helps make more informed decisions. - Improved Trend Identification
Multiple time frames allow for better trend recognition. Short-term movements may present signals that are in line with the longer-term trend, indicating more robust opportunities. Conversely, a mismatch between short-term and long-term trends can act as a cautionary flag. - Increased Accuracy of Entry and Exit Points
Traders often use a combination of time frames to refine entry and exit strategies. A trader might observe a trade setup on a short-term chart, but confirm the trade’s strength using a longer-term chart. This reduces the risk of false signals and increases the probability of successful trades. - Risk Management
Analyzing multiple time frames allows traders and investors to gauge market conditions more effectively, helping them assess potential risks. If the short-term charts suggest volatility but the long-term charts show an overall upward trend, one can adjust their risk tolerance and strategy accordingly. - Confirmation of Trade Signals
Using multiple time frames enables traders to verify trade signals. For instance, a signal on a smaller time frame (such as an hour) might be confirmed by a larger time frame (like a daily chart), adding confidence to the decision to enter or exit a trade. - Helps in Timing the Market
Multiple time frames provide insights into both market timing and longer-term market behavior. Traders can balance between short-term momentum plays and long-term position trades, adjusting their strategies based on prevailing market conditions over different time spans.
Purpose of Multiple Time Frames

- Comprehensive Market View: Allows for analysis of both short-term and long-term trends, offering a broader perspective of the market.
- Increased Accuracy: Helps in confirming signals across different time frames, improving the reliability of market analysis.
- Better Entry and Exit Points: Identifying trends on multiple time frames can provide optimal points for entering or exiting trades.
- Risk Reduction: Reduces the risk of relying solely on a single time frame, ensuring a more balanced approach to decision-making.
- Enhanced Strategy Effectiveness: Harmonizes insights from various time frames, refining trading strategies and enhancing overall effectiveness.
Examples
Example 1. Stock Market Analysis
Traders often use multiple time frames to analyze stock market trends. For instance, a trader may start by looking at a daily chart to get an overview of the market’s long-term trend, and then zoom into a 15-minute chart to make more immediate decisions about entry and exit points. This dual approach allows traders to capture the bigger picture while making timely decisions based on short-term movements.
Example 2. Cryptocurrency Investment Strategy
Investors in cryptocurrencies can benefit from using multiple time frames to assess both long-term potential and short-term volatility. By analyzing the daily, weekly, and monthly charts, an investor can identify broad trends while also assessing short-term fluctuations that may present opportunities for quick profits or risks to avoid.
Example 3. Project Management
In project management, using multiple time frames helps balance long-term goals with immediate tasks. For example, a manager may review the project’s overall timeline (months or years) while also focusing on weekly or daily milestones. This layered approach ensures that long-term objectives are met while short-term tasks are completed on schedule.
Example 4. Personal Finance Planning
In personal finance, employing multiple time frames allows individuals to plan for both short-term expenses and long-term goals. For instance, a person might create a budget for the next three months while also saving for a long-term goal, like retirement, using a 10- or 20-year plan. This strategy ensures that immediate financial needs are met without neglecting future financial stability.
Example 5. Marketing Strategy
Marketers often use multiple time frames to evaluate the success of campaigns. A company might track daily engagement metrics to monitor the immediate effectiveness of an ad campaign while also analyzing monthly or quarterly performance to gauge its long-term impact on brand awareness and customer loyalty. This combination of short- and long-term insights ensures the marketing strategy is both effective and sustainable.
Practice Questions
Question 1
Which of the following best explains the concept of multiple time frames in technical analysis?
A) Analyzing price data using only one time frame to identify trends.
B) Analyzing price data from different time frames to form a comprehensive trading strategy.
C) Using only short-term charts to make long-term predictions.
D) Analyzing only long-term charts to make short-term decisions.
Answer: B) Analyzing price data from different time frames to form a comprehensive trading strategy.
Explanation:
In technical analysis, multiple time frames refer to the practice of using different time frames (e.g., short-term, medium-term, and long-term charts) to make more informed decisions. Traders use this technique to gain a fuller perspective of the market by considering both the macro (long-term) and micro (short-term) trends. Analyzing multiple time frames helps validate the signal across different time horizons, enhancing the reliability of the trading decision.
Question 2
What is the primary benefit of using multiple time frames when making trading decisions?
A) It helps identify the strongest trend in the market.
B) It reduces the risk of trading during periods of high volatility.
C) It provides a more accurate prediction of stock prices.
D) It helps align short-term trades with the overall long-term trend.
Answer: D) It helps align short-term trades with the overall long-term trend.
Explanation:
The key benefit of using multiple time frames is that it helps traders align their short-term trading decisions with the prevailing long-term trend. For example, if the long-term trend is bullish, a trader may seek short-term buying opportunities within that broader uptrend. This strategy increases the likelihood of making profitable trades as it avoids trading against the dominant trend and allows traders to make decisions that are in line with the larger market movement.
Question 3
When using multiple time frames, which time frame is typically used for confirming trends?
A) The shortest time frame available.
B) The longest time frame available.
C) The medium-term time frame.
D) Multiple time frames should be used interchangeably.
Answer: B) The longest time frame available.
Explanation:
In multiple time frame analysis, the longest time frame (e.g., weekly or monthly chart) is typically used for confirming the overall trend. This is because longer time frames offer a broader view of market movements and trends. Traders then look at shorter time frames (e.g., daily, hourly, or minute charts) to pinpoint entry and exit points. By using the long-term trend to confirm the market’s direction, traders can make more informed decisions when assessing shorter-term signals.


