Preparing for the CMT Exam requires a strong grasp of regression analysis, a key tool for understanding relationships between market variables. Mastery of linear and non-linear regression helps in predicting price movements, trend analysis, and identifying market patterns. This knowledge is crucial for developing trading strategies and optimizing investment portfolios, boosting CMT Exam success.
Learning Objective
In studying “Regression” for the CMT Level 2 Exam, you should learn to understand the application of linear and non-linear regression in technical analysis. Analyze how these models predict market trends, identify price patterns, and evaluate relationships between variables. Explore concepts like regression coefficients, goodness-of-fit, and residuals to enhance trading and investment strategies. Evaluate the use of multiple regression, polynomial regression, and logistic regression techniques to capture complex market behaviors. Additionally, apply these methods to interpret historical data, forecast asset movements, and optimize risk management, strengthening your analytical proficiency for CMT Exam success.
Understanding Regression Analysis
Regression analysis is a powerful statistical tool used in technical analysis to examine and model the relationship between a dependent variable (target) and one or more independent variables (predictors). By quantifying this relationship, regression helps technical analysts make data-driven predictions about market behavior, trends, and price movements. Here’s a detailed explanation of its components:
- Definition and Types of Regression
Regression analysis aims to find the best-fit line or curve that describes the relationship between variables. The most common type is linear regression, which assumes a straight-line relationship between variables. Non-linear regression can capture more complex, curved relationships, offering greater flexibility for modeling market behavior. - Key Components
Regression involves several key elements, including coefficients, intercepts, and slopes. The coefficient measures the strength and direction of the relationship between a predictor and the target variable. The intercept represents the expected value of the dependent variable when all predictors are zero. The slope indicates the rate of change in the dependent variable for each unit increase in the independent variable. - Application in Technical Analysis
Regression analysis is widely used to predict asset prices, market trends, and patterns. Technical analysts use it to identify relationships between market variables, such as how interest rate changes affect stock prices or the correlation between commodity prices and currency values. By establishing these relationships, regression provides a quantitative foundation for making trading decisions. - Assumptions and Limitations
Linear regression assumes a linear relationship between variables, homoscedasticity (constant variance of residuals), and normally distributed errors. These assumptions may not always hold in complex, real-world financial markets, potentially limiting its accuracy. Non-linear models can capture more complex behaviors, but they may also increase the risk of overfitting or reduced interpretability. - Predictive Capabilities
Regression models can forecast future asset prices and market movements based on historical data. This predictive power makes it valuable for traders and investors seeking to gain a competitive edge. However, analysts must remain cautious of changing market conditions that may alter the relationships captured by the model.
Linear and Non-Linear Regression Models
Regression models are essential tools in technical analysis, providing ways to quantify relationships between variables and forecast trends in market data. These models can be categorized into linear and non-linear, each with unique applications, strengths, and limitations. Here is a detailed explanation:
Linear Regression Models
Linear regression assumes a straight-line relationship between a dependent variable (target) and one or more independent variables (predictors). It is represented by the equation:
![]()
where ( y ) is the dependent variable, ![]() is the intercept,
is the intercept, ![]() is the slope (or coefficient) of the independent variable ( x ), and
is the slope (or coefficient) of the independent variable ( x ), and ![]() represents the error term.
represents the error term.
- Simple Linear Regression focuses on the relationship between one independent variable and the dependent variable, often used to model price trends or predict changes in market behavior.
- Multiple Linear Regression extends this to include two or more independent variables, enabling a more comprehensive analysis of factors influencing an asset’s price or performance.
Applications of Linear Regression
Linear regression is widely used in technical analysis to predict asset prices, identify trends, and evaluate the impact of various market factors. For example, analysts might use linear regression to examine how a stock’s price is influenced by changes in interest rates or market indices. By fitting a linear regression line to historical data, analysts can make informed predictions about future movements.
Non-Linear Regression Models
Unlike linear regression, non-linear regression captures more complex relationships that are not accurately represented by a straight line. These models are useful when data patterns exhibit curves, changes in direction, or more intricate behavior.
Polynomial Regression extends linear regression by adding polynomial terms, creating curves in the data relationship. For example, a quadratic regression model includes a squared term to represent parabolic trends.
Logistic Regression models binary outcomes (e.g., an asset moving up or down), useful for predicting market trends or classification problems. Logistic regression produces probabilities bounded between 0 and 1, making it particularly suitable for certain trading signals.
Goodness-of-Fit and Residual Analysis
Both linear and non-linear regression models are evaluated for their goodness-of-fit using metrics such as the R-squared value, which measures how well the model explains variability in the data. Residual analysis (examining the differences between observed and predicted values) helps determine if the model accurately captures data patterns or if adjustments are needed.
Model Selection and Interpretation
Choosing the appropriate regression model depends on the data’s structure and the specific relationships being analyzed. Linear models are simpler and easier to interpret, making them a good starting point. However, non-linear models may be necessary to capture more complex market behaviors. Analysts must balance complexity and interpretability, avoiding overfitting while maximizing predictive power.
Advanced Regression Techniques
Advanced regression techniques extend beyond basic linear and non-linear models, providing technical analysts with more sophisticated tools to capture complex market behaviors, relationships, and trends. These techniques help analysts make better predictions, identify intricate patterns, and develop more robust trading strategies. Here is a detailed explanation:
- Multiple Regression Analysis
Multiple regression involves using more than one independent variable to predict the value of a dependent variable. By including multiple predictors, analysts can account for a broader range of factors that may influence asset prices. This technique is useful in situations where multiple market indicators, such as interest rates, GDP growth, and sector indices, collectively impact a stock’s performance. It provides a more comprehensive view of market dynamics. - Polynomial Regression Applications
Polynomial regression extends linear regression by including higher-order terms (e.g., squared, cubic). This approach captures non-linear relationships between variables, such as parabolic or curved trends. Polynomial regression is valuable when market behavior exhibits non-linear patterns, allowing analysts to better fit data and understand complex market movements. For example, it can help model the relationship between market volatility and asset prices over time. - Logistic Regression for Market Prediction
Logistic regression is used to model binary outcomes, such as predicting whether an asset will increase or decrease in value. Unlike linear regression, logistic regression produces probabilities bounded between 0 and 1, making it useful for classification problems. In technical analysis, logistic regression can be used to predict the likelihood of a trend reversal, breakout, or other market events, providing valuable trading signals. - Rolling and Dynamic Regression Models
These models analyze how the relationship between variables changes over time by using a moving window or dynamically adjusting the data set. Rolling regression, for example, involves recalculating regression parameters over a set period (e.g., weekly or monthly). This technique helps analysts identify evolving relationships in volatile markets and adapt their strategies accordingly, capturing trends that may shift with market conditions. - Residual and Goodness-of-Fit Analysis
Advanced regression analysis often involves examining residuals (differences between observed and predicted values) to evaluate the model’s accuracy and identify patterns that the model may have missed. Goodness-of-fit metrics, such as the R-squared value, indicate how well the model explains data variability. Advanced techniques may include evaluating residual distributions, heteroscedasticity, and autocorrelation to improve model precision. - Handling Non-Stationary Data
In financial markets, data is often non-stationary, meaning its statistical properties change over time. Techniques like differencing, detrending, or using integrated models (e.g., autoregressive integrated moving average, or ARIMA) allow analysts to manage non-stationary data. This ensures accurate regression analysis in dynamic and volatile markets, reducing the risk of false conclusions and improving model reliability. - Regularization Methods
Techniques like ridge regression and Lasso regression help address issues of overfitting in regression models. These methods introduce penalty terms to shrink regression coefficients, improving model generalization and reducing complexity. In technical analysis, regularization can refine model predictions, ensure robust performance on unseen data, and prevent misleading outcomes caused by noisy data. - Application in Risk Management and Hedging
Advanced regression models are used in developing sophisticated risk management and hedging strategies. By capturing complex market relationships, analysts can better identify risk exposure and develop tailored hedging techniques that adapt to market changes, minimizing losses and optimizing portfolio performance.
Practical Applications in Technical Analysis
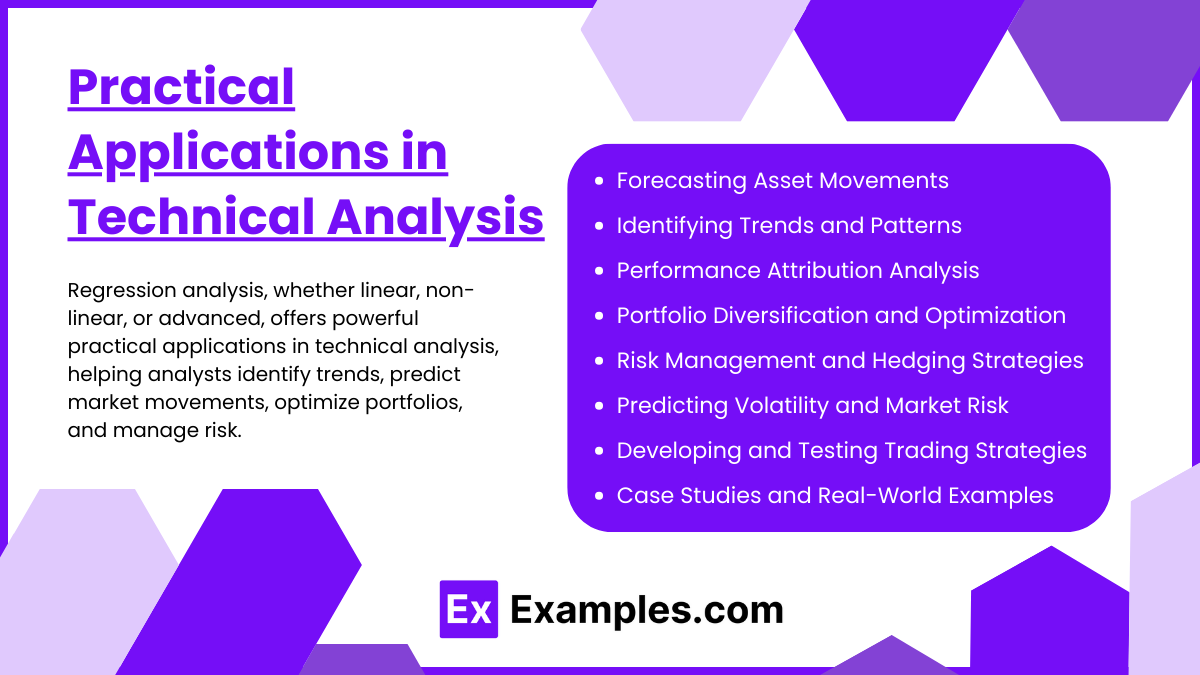
Regression analysis, whether linear, non-linear, or advanced, offers powerful practical applications in technical analysis, helping analysts identify trends, predict market movements, optimize portfolios, and manage risk. Here is a detailed overview of its practical use cases:
- Forecasting Asset Movements
Regression models are widely used to forecast future price movements of assets. By analyzing historical data and identifying relationships between variables, technical analysts can predict the direction and magnitude of price changes. For example, regression can help forecast how a stock might respond to changes in market sentiment, macroeconomic factors, or other market indicators. - Identifying Trends and Patterns
Regression lines are often used to identify and confirm trends in asset prices. In technical analysis, a regression line can serve as a trendline, helping analysts visually assess the direction and strength of a market trend. By examining how prices deviate from the regression line, analysts can also spot potential reversals, breakouts, or periods of consolidation. - Portfolio Diversification and Optimization
Correlation and regression analysis enable analysts to evaluate the relationships between different assets in a portfolio. By understanding how assets move in relation to one another, analysts can create diversified portfolios that minimize risk and maximize returns. Regression models can quantify the impact of adding or removing assets, helping optimize portfolio allocations based on changing market conditions. - Risk Management and Hedging Strategies
Regression models are integral to risk management, providing insights into how market factors influence asset prices and overall portfolio risk. Analysts can use regression to develop hedging strategies that reduce exposure to adverse market movements. For example, they may identify correlations between a stock and a commodity, creating hedges that protect against unfavorable market changes. - Analyzing Market Sentiment and Macroeconomic Factors
Regression analysis helps analysts understand how macroeconomic factors, such as interest rates, inflation, or GDP growth, impact asset prices. By incorporating these variables into regression models, analysts can assess their influence on market behavior and anticipate market reactions to economic news or changes in policy. - Predicting Volatility and Market Risk
By analyzing the relationship between market variables and historical price volatility, regression models can predict future market volatility levels. This information is vital for options trading, risk assessment, and capital allocation decisions. For example, analysts might use regression to estimate how volatility indices relate to equity market movements. - Developing and Testing Trading Strategies
Regression analysis provides a quantitative framework for testing and validating trading strategies. Analysts can evaluate the effectiveness of technical indicators, moving averages, or other trading signals by measuring their relationship with market outcomes. This data-driven approach helps refine strategies, maximize profitability, and minimize risks. - Case Studies and Real-World Examples
Regression techniques are applied to real-world data to develop actionable insights. For instance, analysts may examine how specific news events correlate with stock price movements using regression models. These case studies allow technical analysts to apply theory to practice, gaining a better understanding of market behaviors and refining their analytical techniques.
Examples
Example 1: Linear Regression for Stock Price Prediction
A technical analyst uses linear regression to predict the future price of a stock based on past data. By fitting a regression line through historical prices, the analyst can estimate potential future movements, helping to identify trends and price targets for entry or exit strategies.
Example 2: Multiple Regression to Analyze Market Influences
An analyst applies multiple regression to assess the impact of various factors, such as interest rates, GDP growth, and sector performance, on a stock index. This analysis provides insights into which factors are most influential and helps refine market predictions and trading decisions.
Example 3: Polynomial Regression for Complex Market Patterns
A trader observes that a stock’s price trend is non-linear and applies polynomial regression to capture the curve in price movements. This approach allows the trader to model complex market patterns, such as parabolic moves, providing more accurate predictions and trading signals.
Example 4: Logistic Regression to Predict Trend Reversals
An analyst uses logistic regression to classify whether a security is likely to experience a trend reversal or continue its current trajectory. By analyzing past price data and market indicators, logistic regression provides probabilities for potential market movements, enhancing trading strategy development.
Example 5: Rolling Regression to Track Evolving Correlations
A technical analyst employs rolling regression to study how the relationship between two assets, such as stocks and commodities, evolves over time. This technique helps identify shifts in correlations due to changing market conditions, providing valuable insights for diversification and hedging strategies.
Practice Questions
Question 1
Which of the following best describes the purpose of linear regression in technical analysis?
A) Identifying non-linear relationships between assets
B) Estimating future values of a dependent variable based on past data
C) Classifying assets into different categories
D) Measuring the volatility of a financial instrument
Answer: B) Estimating future values of a dependent variable based on past data
Explanation:
Linear regression is primarily used to estimate the future values of a dependent variable by modeling the relationship between it and one or more independent variables using past data. This makes it an essential tool for predicting trends and market movements in technical analysis. Unlike logistic regression, it focuses on continuous values, and unlike volatility measures, it does not measure dispersion directly.
Question 2
Which type of regression is most suitable for modeling binary outcomes, such as whether a stock price will increase or decrease?
A) Simple linear regression
B) Polynomial regression
C) Multiple linear regression
D) Logistic regression
Answer: D) Logistic regression
Explanation:
Logistic regression is used to model binary outcomes, where the dependent variable can take only two possible outcomes, such as “increase” or “decrease.” It predicts the probability of these outcomes and is commonly used in technical analysis to forecast trend changes and market behaviors. Linear and polynomial regression focus on continuous data, not classification.
Question 3
In a regression model, what does an R-squared value of 0.95 indicate?
A) The model explains 95% of the variability in the dependent variable
B) There is no linear relationship between the variables
C) The model is poorly fitted to the data
D) The model predicts future values with 95% accuracy
Answer: A) The model explains 95% of the variability in the dependent variable
Explanation:
An R-squared value of 0.95 indicates that 95% of the variability in the dependent variable is explained by the independent variables in the regression model. It is a measure of how well the model fits the data, but it does not imply a 95% prediction accuracy or guarantee predictive power outside the data range used for fitting.

