Preparing for the CMT Exam requires a deep understanding of regression analysis, a key tool in evaluating market relationships. Mastery of linear, multiple, and non-linear regression models is essential for predicting market trends, assessing asset movements, and optimizing portfolios. This knowledge enhances technical analysis and aids in developing effective trading strategies.
Learning Objective
In studying “Regression Analysis” for the CMT Level 2 Exam, you should learn to apply linear, multiple, and non-linear regression techniques for market analysis. Understand how regression models identify relationships between variables, forecast market trends, and assess asset price movements. Evaluate key concepts such as coefficients, residuals, and goodness-of-fit for model accuracy. Explore advanced regression techniques, including polynomial and logistic regression, to capture complex market behaviors. Analyze how these methods optimize portfolio strategies, enhance risk management, and inform data-driven trading decisions. Apply your knowledge to real-world scenarios and historical data for technical analysis mastery.
Foundations of Regression Analysis
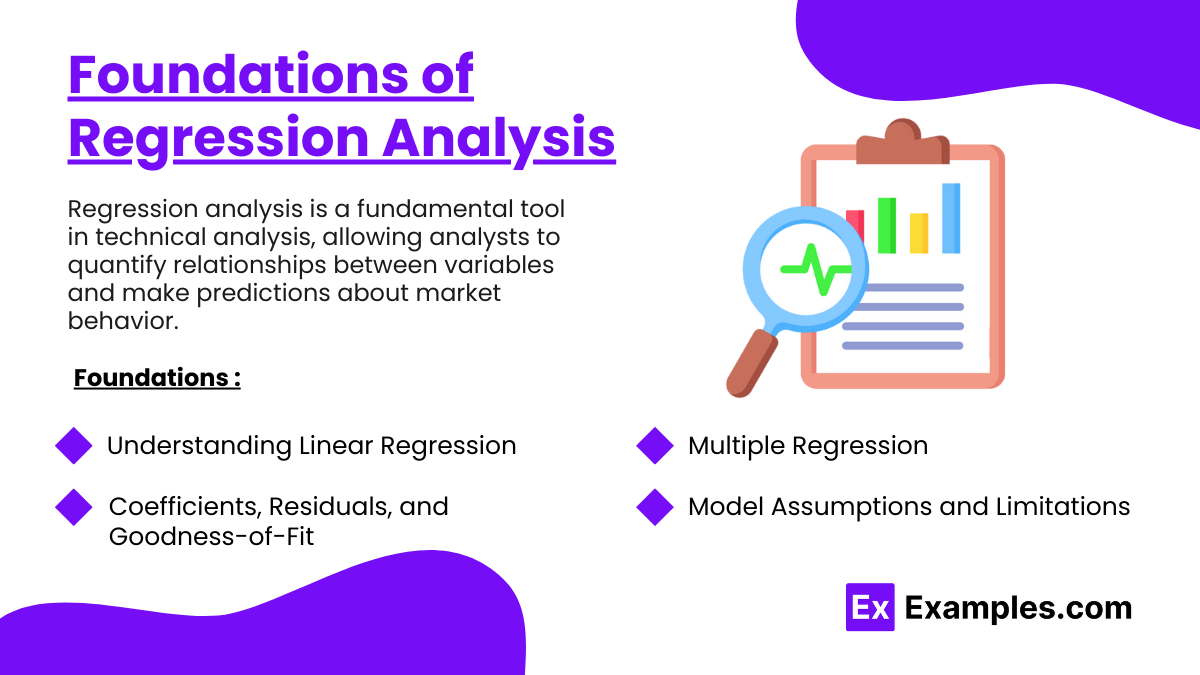
Regression analysis is a fundamental tool in technical analysis, allowing analysts to quantify relationships between variables and make predictions about market behavior. This foundational overview covers key principles, components, and the use of regression models in market analysis.
- Understanding Linear Regression
Linear regression examines the linear relationship between a dependent variable (target) and one or more independent variables (predictors). The goal is to find a line that best fits the data, minimizing the sum of squared differences between observed and predicted values. The model is expressed as:
y = β0 + β1x + ε,
where y is the dependent variable, β0 is the intercept, β1 is the slope, x is the independent variable, and ε represents the error term. This model helps analysts predict how changes in the predictors affect the target variable. - Multiple Regression
Multiple regression expands on linear regression by incorporating two or more independent variables to predict the dependent variable. This approach allows for a more comprehensive analysis, capturing the combined impact of various factors on market behavior. For example, an analyst might use multiple regression to assess how interest rates, inflation, and sector performance jointly influence a stock’s price. - Key Concepts: Coefficients, Residuals, and Goodness-of-Fit
- Coefficients measure the strength and direction of the relationship between each independent variable and the dependent variable. A positive coefficient means an increase in the predictor leads to an increase in the target, while a negative coefficient indicates the opposite effect.
- Residuals are the differences between observed and predicted values. Examining residuals helps assess model accuracy and identify potential issues, such as outliers or deviations from linearity.
- Goodness-of-Fit metrics, such as the R-squared value, indicate how well the model explains the variability in the data. Higher R-squared values suggest a better fit, while lower values imply weaker predictive power.
- Model Assumptions and Limitations
Linear regression models rely on several assumptions:- Linearity: The relationship between variables is linear.
- Independence of Errors: Residuals (errors) should not be correlated.
- Homoscedasticity: Residuals should have constant variance.
- Normality of Errors: Residuals should follow a normal distribution.
Advanced Regression Techniques
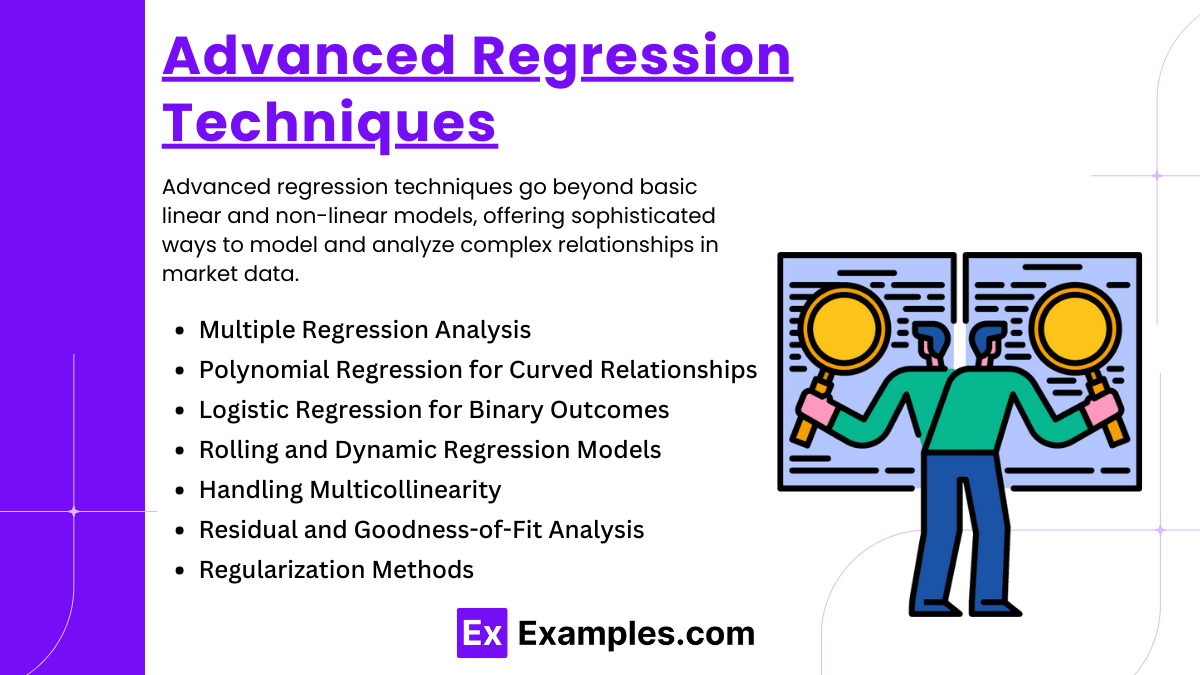
Advanced regression techniques go beyond basic linear and non-linear models, offering sophisticated ways to model and analyze complex relationships in market data. These techniques are valuable for technical analysts aiming to capture intricate market behaviors, improve predictive accuracy, and enhance trading strategies.
- Multiple Regression Analysis
Multiple regression involves using more than one independent variable to predict the value of a dependent variable. This technique allows analysts to assess how multiple market factors influence an asset’s price. For example, a multiple regression model can analyze how economic indicators, such as interest rates, GDP growth, and inflation, collectively impact stock prices. By capturing these relationships, analysts gain a deeper understanding of market dynamics and can create more accurate models. - Polynomial Regression for Curved Relationships
Polynomial regression extends linear regression by introducing higher-order terms (e.g., squared, cubic) to model non-linear relationships. This approach is useful for capturing data patterns that exhibit curves or changes in direction. For instance, polynomial regression can help model parabolic trends in stock prices, providing a more accurate depiction of complex market movements than linear regression alone. - Logistic Regression for Binary Outcomes
Unlike linear regression, which predicts continuous values, logistic regression is used to model binary outcomes. It estimates the probability that a particular event will occur, such as whether an asset’s price will rise or fall. Logistic regression is especially useful for classification problems, trend reversals, and market prediction, offering probabilities bounded between 0 and 1. This makes it a valuable tool for decision-making in trading strategies. - Rolling and Dynamic Regression Models
Rolling regression involves recalculating regression parameters over a moving window of time. This allows analysts to track how the relationship between variables evolves, making it especially useful for dynamic and volatile markets. By using rolling or dynamic regression, analysts can identify shifts in market behavior, detect changing correlations, and adjust their strategies accordingly to capitalize on emerging trends. - Handling Multicollinearity
Multicollinearity occurs when independent variables in a regression model are highly correlated with each other, potentially leading to unreliable coefficient estimates. Advanced techniques like ridge regression and Lasso regression introduce penalty terms to reduce multicollinearity, improving model robustness and interpretability. These methods shrink coefficients and mitigate the impact of multicollinearity, enhancing model performance. - Residual and Goodness-of-Fit Analysis
Advanced regression techniques often involve a detailed examination of residuals (the differences between observed and predicted values) to evaluate model accuracy. Analyzing residuals helps identify patterns, such as autocorrelation or heteroscedasticity, which can indicate issues in the model. Additionally, metrics such as adjusted R-squared and other goodness-of-fit indicators provide insights into how well the model captures the data’s variability. - Regularization Methods
Regularization techniques like ridge regression and Lasso regression introduce penalties for larger coefficient values, preventing overfitting and enhancing the generalizability of the model. Ridge regression penalizes the sum of squared coefficients, while Lasso regression penalizes the absolute sum. These methods ensure that the model remains accurate and robust when applied to new data. - Application in Risk Management and Hedging
Advanced regression models help develop tailored risk management and hedging strategies by capturing complex relationships among market variables. Analysts use these models to identify exposure, forecast volatility, and create portfolios that adapt to market changes, minimizing risk and maximizing returns.
Regression Applications in Technical Analysis
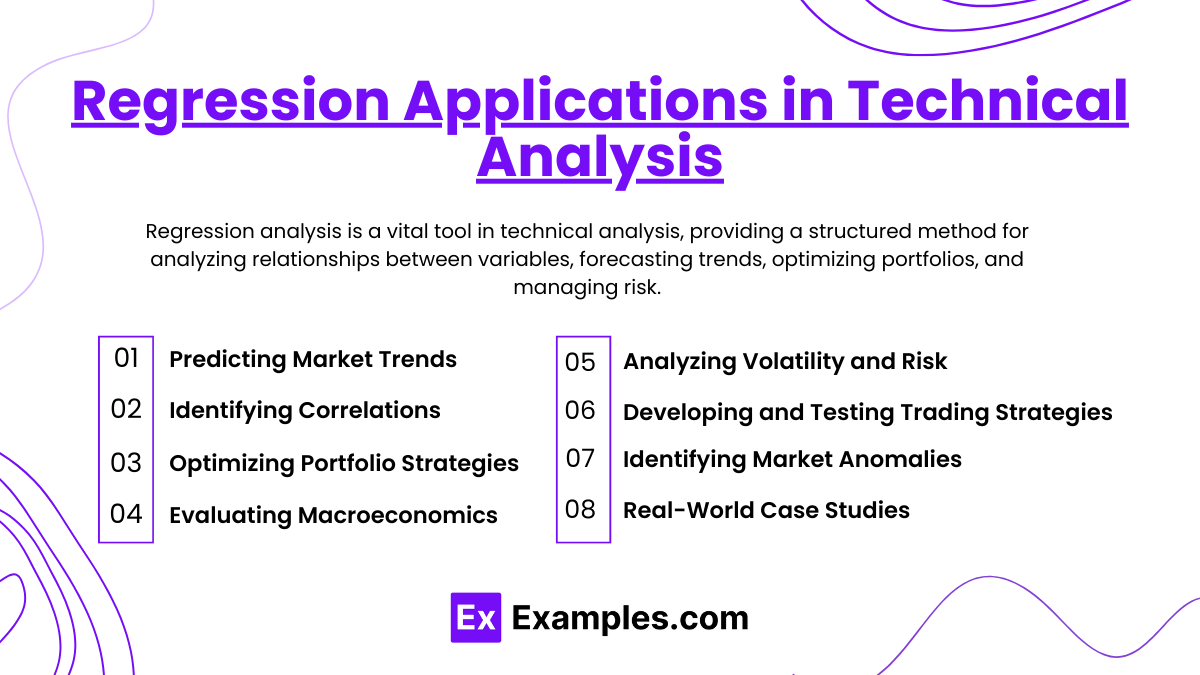
Regression analysis is a vital tool in technical analysis, providing a structured method for analyzing relationships between variables, forecasting trends, optimizing portfolios, and managing risk. By leveraging regression techniques, technical analysts can gain deeper insights into market behavior and enhance their trading strategies. Here’s how regression is practically applied in technical analysis:
- Predicting Market Trends
Regression models are used to forecast future movements in asset prices based on historical data. By identifying relationships between variables, analysts can make informed predictions about the direction and magnitude of price changes. For example, linear regression lines can help identify trends, offering valuable insights into potential price targets or reversal points in trading. - Identifying Correlations and Causal Relationships
Regression analysis helps analysts understand how different market variables interact with each other. For instance, by examining the relationship between a stock’s price and macroeconomic indicators, such as interest rates or GDP growth, analysts can determine if changes in these factors are likely to influence the stock’s performance. Identifying such correlations and causal relationships provides a basis for more effective trading and investment decisions. - Optimizing Portfolio Strategies
Regression models play a key role in portfolio management by analyzing the correlation between assets. By understanding how assets move in relation to one another, analysts can construct diversified portfolios that minimize risk while maximizing returns. For example, multiple regression can identify which factors most strongly impact asset prices, enabling strategic asset allocation and reducing overall portfolio volatility. - Evaluating Macroeconomic and Market Factors
Regression analysis is used to assess the impact of macroeconomic factors on market behavior. Analysts can model how variables such as inflation, unemployment rates, or commodity prices influence asset classes. This analysis helps traders anticipate market reactions to economic data releases or policy changes, making regression a powerful tool for strategic positioning. - Analyzing Volatility and Risk
By examining the relationship between historical price volatility and market factors, regression models can predict future volatility levels. This information is crucial for options trading, hedging, and capital allocation decisions. For example, understanding how changes in volatility indices correlate with equity prices enables traders to make more informed decisions in volatile markets. - Developing and Testing Trading Strategies
Regression provides a quantitative framework for evaluating and testing trading strategies. Analysts can assess the effectiveness of technical indicators, moving averages, or other trading signals by measuring their relationship with market outcomes. This data-driven approach helps refine strategies, maximize profitability, and minimize risks by ensuring that trading decisions are based on statistically significant relationships. - Identifying Market Anomalies
Regression analysis can detect market anomalies, such as periods of excessive volatility, trend reversals, or abrupt changes in asset correlations. By identifying these patterns, analysts can adapt their trading strategies to capitalize on unique market conditions or protect against potential risks. - Real-World Case Studies
Regression models are often applied to real-world scenarios, helping analysts understand how specific events influence market behavior. For example, studying the impact of major news events, earnings releases, or geopolitical developments on asset prices using regression analysis provides actionable insights that inform trading strategies.
Practical Considerations and Case Studies
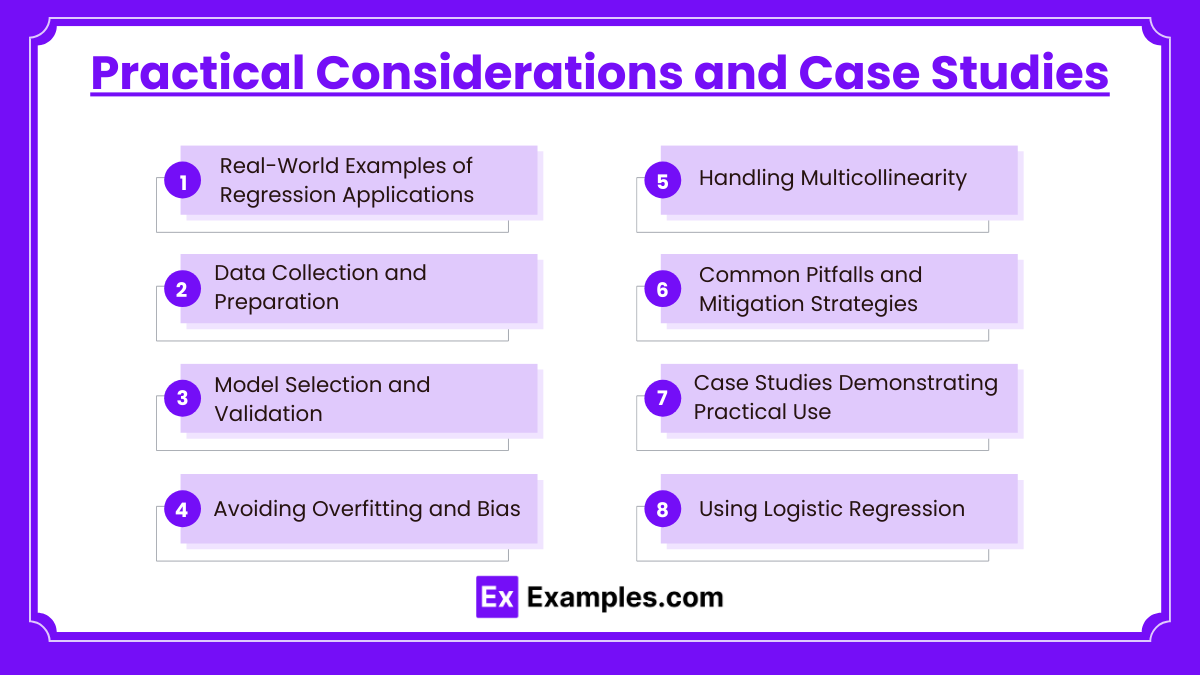
When applying regression analysis in technical analysis, it’s essential to consider practical aspects that ensure the models’ accuracy, reliability, and effectiveness. These considerations encompass data collection, model selection, and validation, and are illustrated through case studies demonstrating real-world applications. Here is an in-depth look at these practical aspects:
- Real-World Examples of Regression Applications
Regression analysis is widely applied in technical analysis to understand market dynamics and create actionable strategies. For example, an analyst might use multiple regression to evaluate how various macroeconomic indicators influence a stock index, helping anticipate market movements. Another common use case involves logistic regression for predicting market reversals, providing traders with valuable entry and exit points. - Data Collection and Preparation
High-quality data is crucial for accurate regression analysis. Analysts must collect data from reliable sources and ensure it is cleaned and preprocessed. This involves handling missing data, outliers, and inconsistencies, which can otherwise distort model results. Data preparation also includes transforming data into the appropriate format, such as normalizing variables for consistent interpretation. - Model Selection and Validation
Selecting the appropriate regression model depends on the complexity and nature of the data. Linear models work well for simple relationships, while non-linear, polynomial, or logistic regression may be necessary for more complex behaviors. Validation is essential to test the model’s predictive power and avoid overfitting. Techniques like cross-validation and evaluating out-of-sample performance help ensure the model generalizes well to new data. - Avoiding Overfitting and Bias
Overfitting occurs when a model captures noise or random fluctuations in the data, reducing its predictive accuracy on new data. To mitigate overfitting, analysts can use regularization techniques, such as ridge or Lasso regression, which penalize large coefficients. Balancing model complexity and predictive power is key to building robust regression models that accurately reflect market realities. - Handling Multicollinearity
Multicollinearity arises when independent variables are highly correlated with each other, making it challenging to assess their individual impacts on the dependent variable. This can lead to unstable coefficient estimates. Techniques like variance inflation factor (VIF) analysis, ridge regression, or eliminating redundant variables can help manage multicollinearity and improve model stability. - Common Pitfalls and Mitigation Strategies
Regression models are susceptible to various pitfalls, such as assumptions violations (e.g., linearity, homoscedasticity, independence of errors) and data limitations. Analysts must test for assumptions using residual plots and other diagnostic tools to ensure the model’s validity. Addressing issues like heteroscedasticity (unequal variance of residuals) or autocorrelation is critical for accurate predictions. - Case Studies Demonstrating Practical Use
- Case Study 1: Predicting Stock Prices Using Multiple Regression
An analyst applies multiple regression to model the impact of factors like interest rates, industry performance, and market indices on a company’s stock price. By analyzing historical data, the model identifies key predictors, guiding investment decisions based on expected market behavior. - Case Study 2: Using Logistic Regression for Trend Reversals
Logistic regression is employed to classify whether a market trend is likely to reverse based on technical indicators. This model predicts reversal probabilities, helping traders time their trades effectively. - Case Study 3: Tracking Correlation Changes with Rolling Regression
Rolling regression is used to study how correlations between asset classes change over time. For instance, an analyst observes shifting correlations between equities and commodities during market volatility, enabling dynamic portfolio adjustments to reduce risk exposure.
- Case Study 1: Predicting Stock Prices Using Multiple Regression
Examples
Example 1: Stock Price Prediction with Linear Regression
A technical analyst uses linear regression to predict the future price of a stock by analyzing its historical prices. By fitting a regression line through past data, the analyst can estimate price targets and potential market trends, providing a basis for entry and exit decisions.
Example 2: Multiple Regression for Market Factors
An analyst employs multiple regression to evaluate the impact of macroeconomic factors such as interest rates, inflation, and GDP growth on a stock index. By incorporating multiple predictors, this model provides insights into the key drivers of market movements, aiding in informed trading and risk management.
Example 3: Logistic Regression for Trend Reversal Prediction
Logistic regression is used to predict the probability of a market trend reversal based on historical data and technical indicators. The model classifies whether an asset is likely to continue its trend or reverse, giving traders valuable insights for timing their trades and managing market risk.
Example 4: Polynomial Regression for Non-Linear Price Movements
An analyst applies polynomial regression to capture non-linear patterns in market data, such as parabolic price movements or changes in trend direction. By fitting a curved regression line, the model better represents complex market behaviors, improving the accuracy of predictions for volatile assets.
Example 5: Rolling Regression to Monitor Changing Correlations
Rolling regression is used to track how correlations between two or more assets evolve over time. For example, an analyst may observe changing correlations between stocks and commodities during periods of market stress, enabling dynamic adjustments to portfolio allocations and hedging strategies to mitigate risk.
Practice Questions
Question 1
Which of the following is true about the slope in a linear regression model?
A) It represents the predicted value when the independent variable is zero
B) It indicates the strength and direction of the relationship between variables
C) It represents the error term in the regression equation
D) It is only used in non-linear regression models
Answer: B) It indicates the strength and direction of the relationship between variables
Explanation:
The slope in a linear regression model represents how much the dependent variable changes for each unit increase in the independent variable. It indicates the strength and direction of the relationship between the variables. A positive slope indicates a positive relationship, while a negative slope shows an inverse relationship. Option A describes the intercept, C refers to the error term, and D is incorrect as slopes are also used in linear models.
Question 2
In a regression analysis, what does a high R-squared value indicate?
A) The model is overfitting the data
B) The independent variables explain a large portion of the variability in the dependent variable
C) There is no correlation between variables
D) The model is poorly fitted to the data
Answer: B) The independent variables explain a large portion of the variability in the dependent variable
Explanation:
A high R-squared value means that the regression model explains a large portion of the variability in the dependent variable. This indicates a strong fit of the model to the data. However, a high R-squared alone does not guarantee model validity and may require further examination to avoid overfitting (Option A). Option C is incorrect because it contradicts the meaning of high R-squared, and D is also incorrect as high R-squared implies a good fit.
Question 3
What is a key limitation of using linear regression in market analysis?
A) It can only model binary outcomes
B) It assumes a linear relationship between variables
C) It does not require any assumptions about data distribution
D) It is only useful for short-term market trends
Answer: B) It assumes a linear relationship between variables
Explanation:
Linear regression assumes a linear relationship between the independent and dependent variables, which can be a limitation if the true relationship is non-linear. While this assumption simplifies the analysis, it may lead to inaccurate predictions if the data does not exhibit a linear trend. Option A describes logistic regression, C is incorrect as linear regression does make assumptions about data distribution, and D is unrelated to the general applicability of linear regression.

