Preparing for the CMT Exam requires a comprehensive understanding of Relative Strength Strategies, a crucial aspect of technical analysis. Mastery of measuring asset performance relative to peers or benchmarks is essential. This knowledge helps identify market leaders, spot trends, and enhance investment decisions, providing critical insights to achieve a high CMT score.
Learning Objective
In studying "Relative Strength Strategies for Investing" for the CMT Level 2 Exam, you should learn to assess asset performance relative to benchmarks or other securities to identify market leaders and laggards. Analyze how relative strength metrics, such as price ratios and moving average comparisons, help spot trends and momentum shifts. Evaluate different applications of these strategies in market timing, sector rotation, and asset allocation. Additionally, explore how these techniques integrate with other technical indicators and market analysis methods to optimize portfolio performance. Apply your understanding to interpret relative strength data for practical investment decisions and trading strategy development.
Understanding Relative Strength Metrics

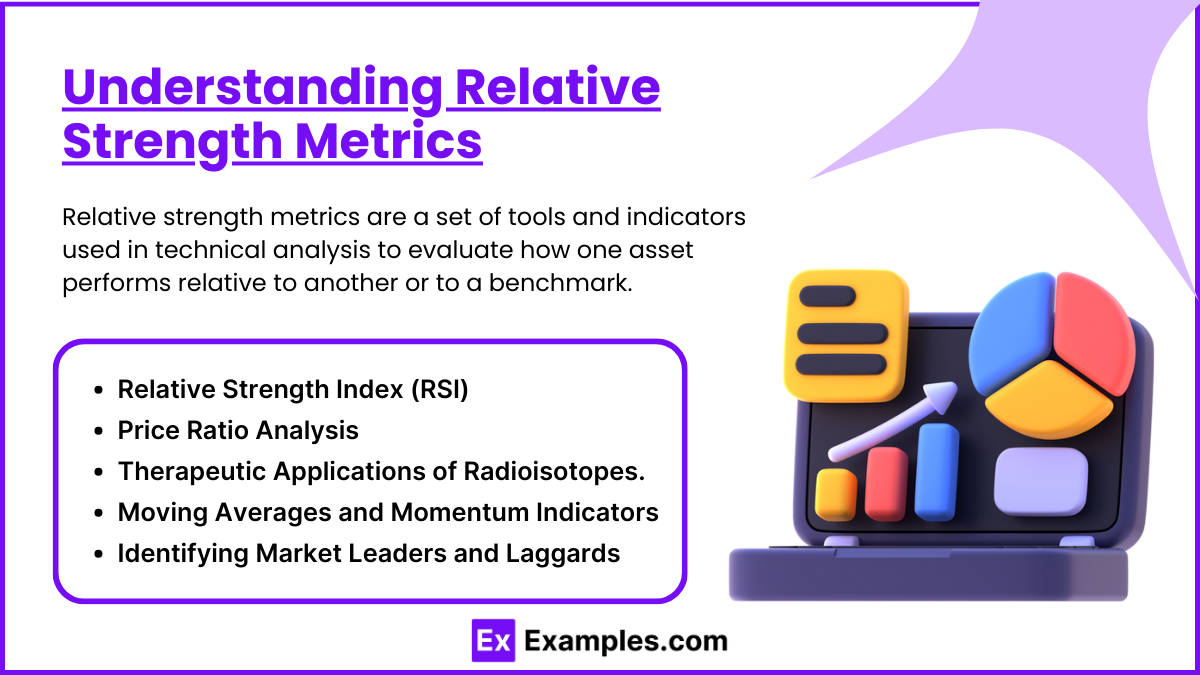
Relative strength metrics are a set of tools and indicators used in technical analysis to evaluate how one asset performs relative to another or to a benchmark. This concept helps traders and investors identify the strongest and weakest performing assets within a given market, sector, or across different asset classes. By focusing on relative performance, these metrics can provide insights into market trends, momentum shifts, and potential investment opportunities, enhancing decision-making and risk management.
Relative Strength Index (RSI): RSI is a momentum oscillator that measures the speed and change of price movements. It is commonly used to identify overbought or oversold conditions, where readings above 70 typically indicate an overbought market, and readings below 30 suggest oversold conditions. RSI can also highlight potential reversals or confirm existing trends.
Price Ratio Analysis: This involves comparing the price performance of one asset relative to another (e.g., stock vs. sector index). By examining this ratio over time, analysts can determine whether an asset is outperforming or underperforming relative to its peers or a market benchmark, helping guide investment decisions.
Moving Averages and Momentum Indicators: Relative strength analysis often incorporates moving averages and momentum indicators to better understand trend direction and strength. Combining these tools can help confirm whether an asset's outperformance is sustainable or likely to reverse.
Identifying Market Leaders and Laggards: By ranking assets based on their relative strength performance, traders can focus on market leaders for potential long positions and avoid or short weaker assets. This approach aligns with momentum-based investing and improves portfolio allocation.
Understanding relative strength metrics provides a deeper perspective on market dynamics, allowing for better asset selection, trend analysis, and risk management. This makes it an essential component of successful trading and investing strategies.
Applications in Market Timing and Sector Rotation

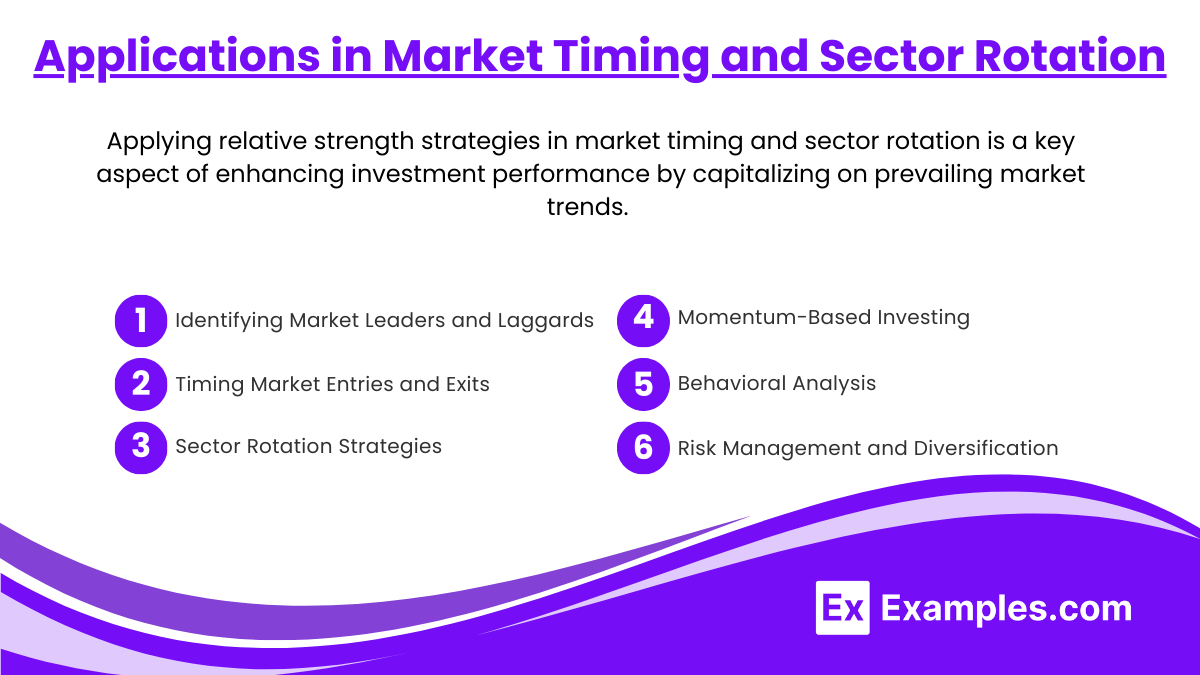
Applying relative strength strategies in market timing and sector rotation is a key aspect of enhancing investment performance by capitalizing on prevailing market trends. This approach focuses on identifying which market sectors, asset classes, or individual securities are outperforming or underperforming at a given time, allowing investors to make strategic adjustments to their portfolios. By timing market entries and exits or shifting exposure to different sectors, traders can align their investments with the strongest market trends, maximize returns, and mitigate risk.
Identifying Market Leaders and Laggards: Relative strength analysis helps pinpoint the sectors, industries, or individual stocks that are outperforming or lagging behind the broader market. By focusing on market leaders, investors can allocate capital to high-performing assets, while avoiding or exiting weaker assets.
Timing Market Entries and Exits: By observing the relative strength of different assets, traders can time their market entries and exits more effectively. For example, entering a position when an asset’s relative strength is rising or outperforming a benchmark indicates strong momentum, whereas exiting when relative strength starts to weaken can preserve gains and minimize losses.
Sector Rotation Strategies: This approach involves shifting investments between different market sectors based on their relative strength. For example, during periods of economic expansion, cyclical sectors such as technology and consumer discretionary may exhibit strong relative strength. In contrast, during periods of economic uncertainty or downturns, defensive sectors like utilities and healthcare may outperform. Sector rotation capitalizes on these cyclical trends to enhance returns.
Momentum-Based Investing: Relative strength strategies often align with momentum investing, where traders follow assets that are already showing strong performance trends. By riding the momentum of high-performing assets or sectors, investors can increase their chances of capitalizing on continued strength, while avoiding weaker-performing investments.
Risk Management and Diversification: Applying relative strength metrics allows investors to diversify their portfolios more effectively by allocating funds to sectors with strong relative strength while reducing exposure to lagging sectors. This dynamic reallocation can improve overall portfolio risk-adjusted returns and reduce the impact of market downturns.
By leveraging these applications in market timing and sector rotation, traders and investors can better align their portfolios with prevailing market conditions, capture profitable opportunities, and enhance overall portfolio performance. This approach integrates relative strength analysis into a broader investment strategy, optimizing risk management and return potential.
Integrating Relative Strength with Other Technical Methods

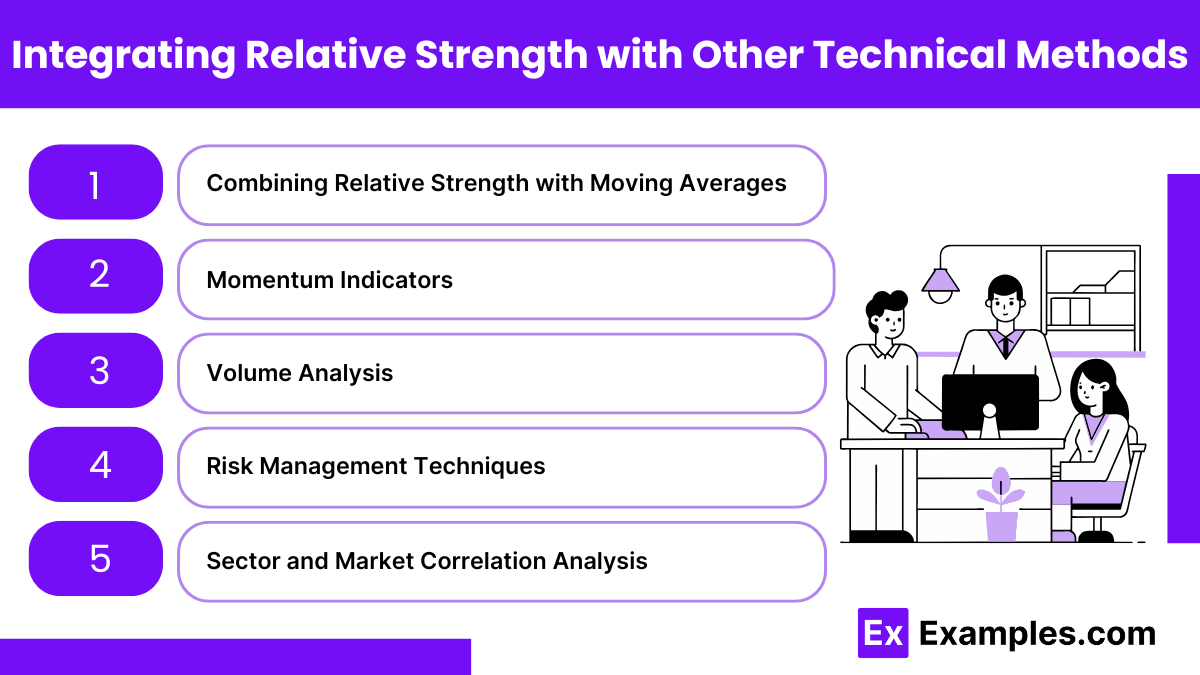
Integrating relative strength strategies with other technical methods enhances market analysis, trend identification, and decision-making. By combining relative strength with other tools, traders and investors can gain a more comprehensive view of market dynamics, validate signals, and optimize trading strategies for better risk management and return potential. Here’s how this integration works:
Combining Relative Strength with Moving Averages: Using moving averages alongside relative strength analysis helps confirm trend direction and strength. For example, when an asset’s relative strength line is rising and its price remains above key moving averages, it signals a strong uptrend and potential buying opportunities. Conversely, if relative strength declines and prices dip below moving averages, it may indicate a reversal or weakening trend.
Momentum Indicators: Relative strength is often used in conjunction with momentum indicators such as the Relative Strength Index (RSI) and Moving Average Convergence Divergence (MACD). These indicators help measure the speed and magnitude of price movements. By combining relative strength and momentum analysis, traders can better gauge market sentiment, identify overbought or oversold conditions, and time their market entries and exits effectively.
Volume Analysis: Volume is an essential confirmation tool in technical analysis. When integrating relative strength strategies with volume analysis, traders can assess whether price movements and relative strength changes are supported by strong trading volumes. An increase in relative strength accompanied by high volume indicates strong buying interest, while declining relative strength with low volume may signal a lack of conviction.
Risk Management Techniques: Relative strength can be integrated with stop-loss strategies, trailing stops, and position sizing to improve risk management. By focusing on assets with high relative strength, traders can allocate capital more effectively and set tighter stops on weaker-performing assets to limit potential losses.
Sector and Market Correlation Analysis: Integrating relative strength with sector or market correlation analysis helps traders spot trends and divergences across asset classes. For example, by comparing relative strength across different sectors, investors can identify rotation opportunities, determine which sectors are gaining momentum, and adjust their portfolios accordingly.
Integrating relative strength with other technical methods allows for a more nuanced analysis of market behavior, helping to confirm trends, identify market shifts, and make informed trading decisions. This comprehensive approach enhances both risk management and potential returns, making it a powerful tool for investors and traders.
Examples
Example 1: Using RSI to Identify Overbought and Oversold Conditions
Description: Apply the Relative Strength Index (RSI) to measure the speed and magnitude of recent price changes. Identify overbought levels when RSI surpasses 70 and oversold levels when it drops below 30, signaling potential trend reversals or momentum shifts for informed trading decisions.
Example 2: Price Ratio Analysis for Stock Comparison
Description: Compare the performance of a specific stock to its sector index or a major benchmark using price ratios. Identify outperforming and underperforming stocks, helping traders and investors allocate capital more effectively based on relative strength within a sector or the broader market.
Example 3: Sector Rotation Strategy Based on Relative Strength
Description: Utilize relative strength analysis to shift investments into outperforming sectors while reducing exposure to weaker sectors. Identify market trends where cyclical sectors gain strength compared to defensive sectors, creating opportunities for rotation and maximizing returns during different market cycles.
Example 4: Combining Relative Strength and Moving Averages
Description: Use a combination of relative strength indicators and moving averages to confirm market trends and strength. For example, when the relative strength line is rising and prices are above key moving averages, it can signal a strong uptrend and potential buying opportunities.
Example 5: Relative Strength in Portfolio Risk Management
Description: Employ relative strength to mitigate risk by reducing exposure to underperforming assets. Shift capital from weaker assets to stronger-performing ones based on relative strength comparisons, thereby enhancing overall portfolio performance and managing downside risk in volatile markets.
Practice Questions
Question 1
Which of the following best describes the concept of relative strength in investing?
A) Comparing an asset’s return to its historical averages
B) Identifying an asset’s value using fundamental ratios
C) Evaluating an asset’s performance relative to a benchmark or peer group
D) Predicting future prices solely based on news headlines
Answer: C) Evaluating an asset’s performance relative to a benchmark or peer group
Explanation:
Relative strength compares the performance of an asset to a broader market benchmark, index, or peer group to determine whether it is outperforming or underperforming. This analysis helps traders identify strong-performing assets and make informed investment decisions. Unlike A or B, relative strength is based on comparative analysis, not intrinsic valuation or historical returns.
Question 2
When using a relative strength strategy, what does it generally indicate if a stock consistently outperforms its benchmark?
A) The stock is likely to continue its trend
B) The stock is highly overvalued
C) The stock should be immediately sold
D) There is no significance to this behavior
Answer: A) The stock is likely to continue its trend
Explanation:
Relative strength strategies are based on the idea that assets exhibiting strong performance relative to their peers or benchmarks often maintain their momentum. This concept, known as the momentum effect, suggests that outperformance may persist, making it an attractive candidate for further gains. However, traders must still consider market conditions and other factors before investing.
Question 3
Which of the following technical indicators is often used to measure relative strength?
A) Moving Average Convergence Divergence (MACD)
B) Relative Strength Index (RSI)
C) Bollinger Bands
D) Fibonacci Retracement
Answer: B) Relative Strength Index (RSI)
Explanation:
The Relative Strength Index (RSI) is a popular momentum indicator used to measure the speed and change of price movements. It compares recent gains and losses to evaluate overbought or oversold conditions, reflecting an asset’s relative strength over a specific period. While MACD, Bollinger Bands, and Fibonacci Retracement provide other valuable analyses, RSI directly relates to measuring relative strength.


