Preparing for the CMT Exam requires a comprehensive understanding of “Sentiment Measures from Market Data,” a vital component of technical analysis. This area emphasizes an analyst’s ability to evaluate market sentiment indicators, gauge investor psychology, and interpret the collective mood of the market. Mastering these skills ensures analysts can accurately predict potential market movements, identify trends, and provide valuable insights for strategic decision-making, which is essential for success on the CMT Exam.
Learning Objectives
In studying “Sentiment Measures from Market Data” for the CMT, you should learn to understand the significance of sentiment indicators as they reflect investor psychology and market emotion. Familiarize yourself with commonly used sentiment measures such as the put/call ratio, volatility indices (e.g., VIX), and investor sentiment surveys (e.g., AAII). Recognize how extreme sentiment levels can signal potential market turning points, indicating overbought or oversold conditions.
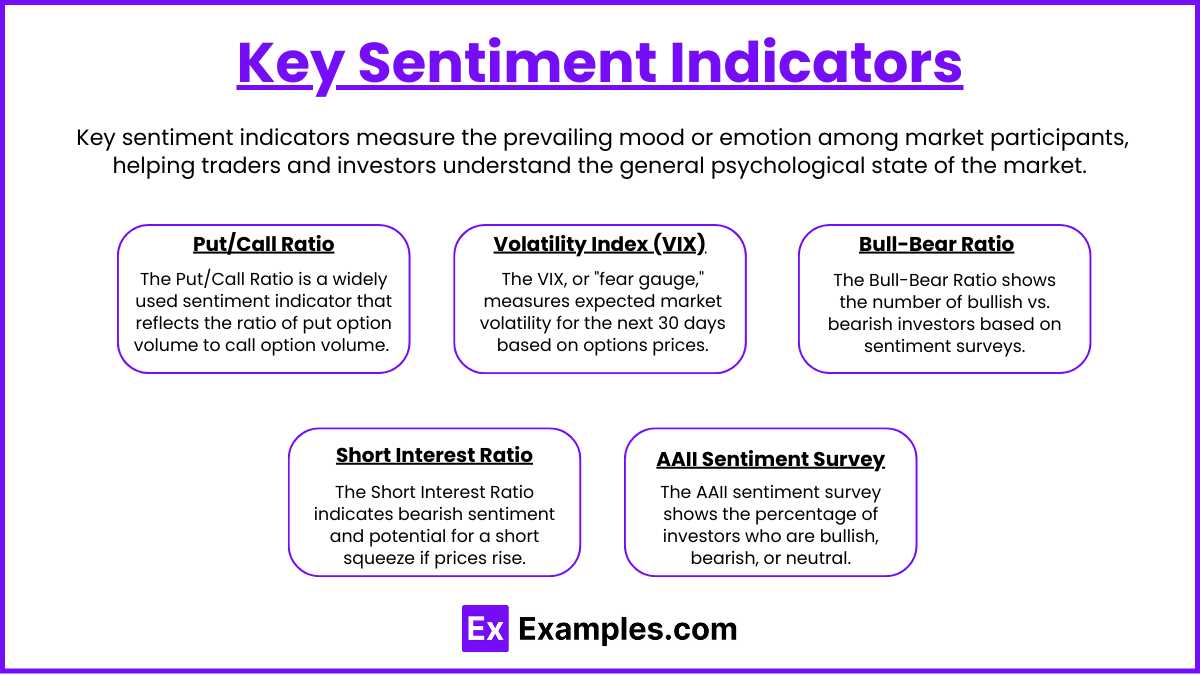
Key Sentiment Indicators

1. Put/Call Ratio
The Put/Call Ratio is a widely used sentiment indicator that reflects the ratio of put option volume to call option volume. Generally, a high put/call ratio suggests bearish sentiment as investors buy more puts to hedge against possible declines, while a low ratio indicates bullish sentiment with a higher demand for calls. This ratio can serve as a contrarian indicator, with extreme high or low levels often signaling potential reversals in the opposite direction of the prevailing sentiment.
2. Volatility Index (VIX)
The Volatility Index, or VIX, often called the “fear gauge,” measures expected market volatility over the next 30 days, derived from options prices. High VIX levels signal increased fear and uncertainty among investors, while low levels suggest complacency and stability. For technical analysts, a rising VIX in a declining market confirms bearish sentiment, but extreme VIX levels can also suggest that a reversal may be near, as market panic reaches its peak.
3. Bull-Bear Ratio
The Bull-Bear Ratio, based on surveys of investor sentiment, reflects the number of bullish versus bearish investors. A high bull-bear ratio indicates excessive optimism, potentially signaling an overbought market, while a low ratio points to pessimism and a potential market bottom. Analysts use this ratio as a contrarian indicator, with extreme optimism or pessimism hinting at potential turning points.
4. Short Interest Ratio
The Short Interest Ratio measures the volume of shares currently short-sold. High short interest may indicate bearish sentiment or the potential for a short squeeze if prices rise sharply, causing short-sellers to buy back shares. Low short interest, on the other hand, suggests bullish sentiment with limited pessimistic bets. This indicator helps analysts assess the market’s underlying sentiment and the risk of sudden reversals.
5. AAII Sentiment Survey
The American Association of Individual Investors (AAII) conducts a sentiment survey that measures the percentage of investors who are bullish, bearish, or neutral. This survey provides insights into retail investor sentiment, which can differ from institutional sentiment. Extreme bullish or bearish readings in the AAII survey can act as contrarian signals, hinting at potential market tops or bottoms.
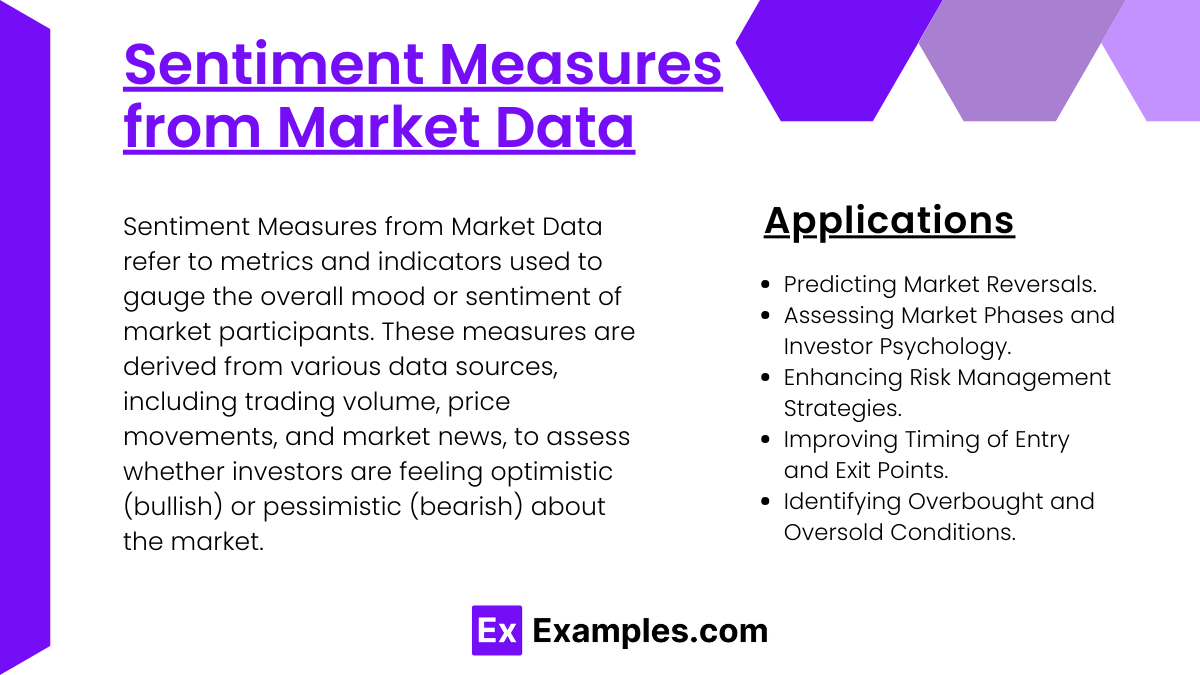
Applications of Sentiment Measures from Market Data

1. Predicting Market Reversals
Sentiment measures are powerful tools for predicting market reversals, often by serving as contrarian indicators. For example, when the Put/Call Ratio reaches an extreme high, it signals a heavy bearish sentiment in the market, often indicating that a reversal to the upside may be near. Similarly, extreme levels in the Bull-Bear Ratio can signal over-optimism or excessive pessimism, both of which may precede market turning points. By identifying these extremes, analysts can position themselves ahead of potential reversals, whether in individual assets or broader market indices.
2. Assessing Market Phases and Investor Psychology
Understanding where the market is within its cycle can be significantly enhanced by sentiment analysis. For example, the VIX, or “fear gauge,” is commonly used to assess market sentiment and the level of uncertainty or fear among investors. High VIX readings during a downtrend may suggest that the market is nearing a panic stage, potentially signaling a bottom. In contrast, a low VIX level in a mature uptrend may indicate investor complacency, suggesting that a correction could be on the horizon. By interpreting these sentiment indicators, analysts gain insights into investor psychology and can better identify the current market phase.
3. Enhancing Risk Management Strategies
Sentiment indicators provide valuable information for risk management. For instance, during periods of high optimism, as indicated by a low Put/Call Ratio or a high Bull-Bear Ratio, risk-averse investors might consider reducing their exposure, as these conditions can signal an overheated market. Conversely, high levels of short interest can indicate a bearish sentiment, suggesting increased downside risk. Analyzing these indicators helps in adjusting portfolio risk exposure based on the market’s sentiment climate, which can enhance overall risk management strategies.
4. Improving Timing of Entry and Exit Points
Sentiment analysis assists in determining the optimal timing for market entries and exits. For example, if the AAII Sentiment Survey shows extreme bearishness, it may be a good time to enter the market, as it often signals a buying opportunity. Similarly, high levels of bullish sentiment may signal a potential exit point as optimism reaches unsustainable levels. Using sentiment data in conjunction with technical indicators like moving averages or RSI can help traders refine their timing and make more effective investment decisions.
5. Identifying Overbought and Oversold Conditions
Sentiment measures can signal when an asset or market is overbought or oversold. The Put/Call Ratio, for instance, can indicate when there is excessive demand for puts or calls, signaling overbought or oversold conditions. The Short Interest Ratio also serves this purpose, as high short interest may suggest an oversold condition, especially if other indicators align. By identifying these conditions, analysts can prepare for potential corrections or rebounds, depending on the sentiment extremes.
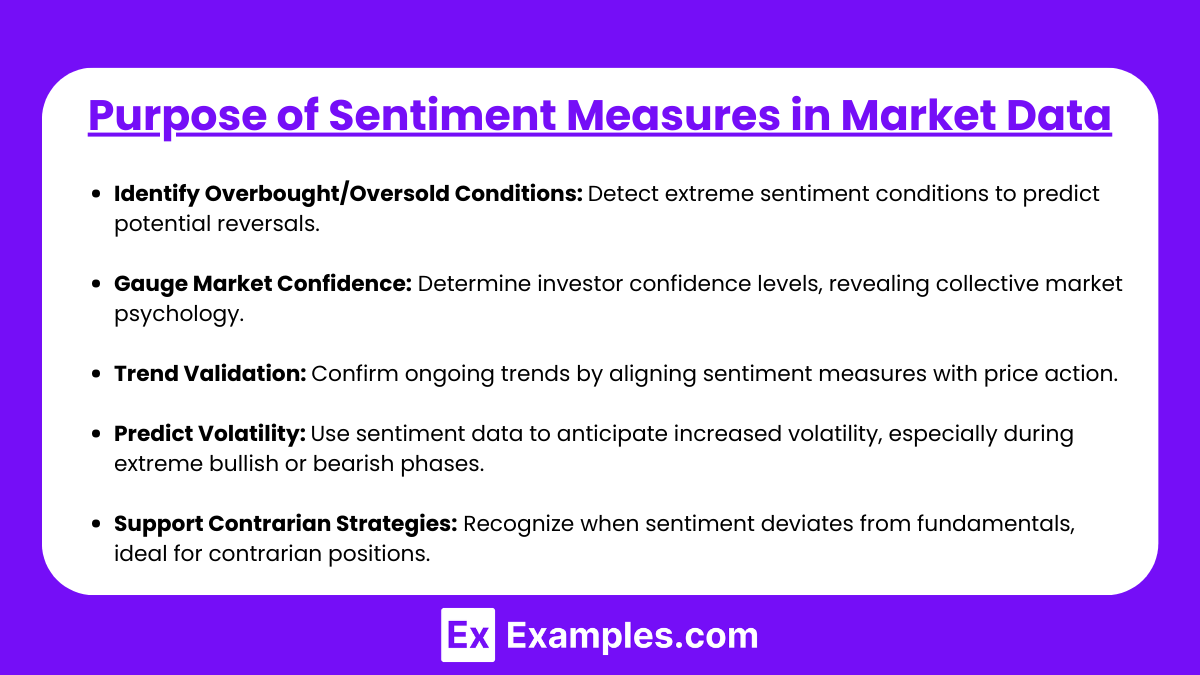
Purpose of Sentiment Measures in Market Data

- Identify Overbought/Oversold Conditions: Detect extreme sentiment conditions to predict potential reversals.
- Gauge Market Confidence: Determine investor confidence levels, revealing collective market psychology.
- Trend Validation: Confirm ongoing trends by aligning sentiment measures with price action.
- Predict Volatility: Use sentiment data to anticipate increased volatility, especially during extreme bullish or bearish phases.
- Support Contrarian Strategies: Recognize when sentiment deviates from fundamentals, ideal for contrarian positions.
Examples
Example 1: Monitoring Investor Sentiment in Stock Markets
Sentiment measures are commonly used in stock markets to gauge investor emotions, providing insights into bullish or bearish market trends. For instance, metrics such as the put/call ratio or social media sentiment analysis can reveal whether investors are optimistic or pessimistic about future market movements. This information aids investors in making informed decisions, as high levels of bullish sentiment might indicate overvaluation, while bearish sentiment could suggest undervaluation.
Example 2 : Assessing Sentiment Impact on Cryptocurrency Prices:
In the volatile cryptocurrency market, sentiment measures are crucial for predicting price swings. Analysts often use social media sentiment, particularly from platforms like Twitter and Reddit, to assess the mood around specific cryptocurrencies. Positive sentiment may drive up demand and prices, while negative sentiment could lead to sell-offs. Understanding these sentiment trends helps traders make timely decisions in a rapidly changing market.
Example 3 : Analyzing Sentiment for Economic Indicators:
Sentiment measures are also applied to economic indicators, where consumer confidence indexes and business sentiment surveys reflect broader economic outlooks. For instance, a positive trend in consumer sentiment may signal strong economic growth, leading to higher stock prices and increased investments. These measures allow investors to align their portfolios with expected economic conditions, managing risks associated with economic downturns.
Example 4 : Using Sentiment for Predicting Bond Market Movements:
Bond markets can also benefit from sentiment analysis, as it helps identify shifts in investor confidence and risk appetite. When sentiment indicates a risk-off environment, investors might prefer safer assets, such as government bonds, causing bond yields to drop. In contrast, positive sentiment might result in a shift toward riskier assets, impacting bond prices and yields. Bond traders can use these insights to adjust their strategies accordingly.
Example 5 : Incorporating Sentiment into Algorithmic Trading:
Many algorithmic trading strategies now incorporate sentiment data as a key factor in their models. By analyzing sentiment scores derived from news articles, social media posts, and financial reports, algorithms can generate buy or sell signals in response to shifts in market sentiment. This approach enhances the speed and precision of trading decisions, enabling traders to capitalize on sentiment-driven market changes effectively.
Practice Questions
Question 1
Which of the following is not commonly used as a sentiment measure in financial markets?
A) Put-Call Ratio
B) Moving Average Convergence Divergence (MACD)
C) Short Interest Ratio
D) Investor Sentiment Index
Answer: B) Moving Average Convergence Divergence (MACD)
Explanation:
Sentiment measures in financial markets assess the mood or outlook of investors, which can indicate future price movements. The Put-Call Ratio, Short Interest Ratio, and Investor Sentiment Index are all sentiment indicators that gauge investor behavior and sentiment directly. MACD is a trend-following momentum indicator that shows the relationship between two moving averages of an asset’s price; it’s used for trend identification rather than sentiment measurement. MACD analyzes price momentum, while sentiment indicators provide insights into investor emotions, fear, or optimism.
Question 2
The Put-Call Ratio is primarily used as a measure of?
A) Volatility
B) Market Trend
C) Market Sentiment
D) Interest Rates
Answer: C) Market Sentiment
Explanation:
The Put-Call Ratio compares the volume of put options (bearish) to call options (bullish) being traded. It serves as a sentiment indicator because a high ratio suggests a bearish outlook (more puts are bought, indicating fear or pessimism), whereas a low ratio indicates bullish sentiment (more calls are bought, signaling optimism). This ratio helps market participants assess if sentiment is excessively bullish or bearish, potentially signaling overbought or oversold conditions, but it does not directly measure volatility, trend, or interest rates.
Question 3
A high Short Interest Ratio is generally interpreted as?
A) Bullish sentiment, indicating that prices are likely to rise
B) Bearish sentiment, indicating that prices are likely to fall
C) A neutral sentiment, indicating no change in price
D) Indication of low market liquidity
Answer: B) Bearish sentiment, indicating that prices are likely to fall
Explanation:
The Short Interest Ratio measures the total number of shares currently sold short compared to the average daily trading volume. A high short interest ratio indicates that a large proportion of investors expect the price to fall, as they have taken short positions. This is generally interpreted as a bearish sentiment. However, if the short interest ratio becomes excessively high, it can also lead to a short squeeze if the price starts rising, forcing short sellers to cover their positions, potentially driving prices up rapidly. Therefore, a high short interest ratio shows bearish sentiment initially but may also indicate potential for sharp upward moves if sentiment shifts.


