Short-term patterns are essential tools in technical analysis, allowing traders to interpret rapid price movements within a few days to weeks. These patterns, including flags, pennants, and candlestick formations like Doji and hammers, signal brief consolidations or potential reversals, helping traders make quick, informed decisions. By understanding the formation and significance of these patterns, traders can pinpoint entry and exit points, manage risk, and anticipate market trends. Recognizing volume’s role in pattern validation further enhances the reliability of these patterns in short-term trading strategies.
Learning Objectives
In studying Short-Term Patterns for the CMT Exam, you should learn to identify and interpret key short-term chart patterns, such as flags, pennants, and triangles. Understand how these patterns indicate brief consolidations or continuations in the prevailing trend. Evaluate the significance of single-candle patterns like Doji, hammer, and engulfing patterns for detecting potential reversals. Analyze how volume supports pattern reliability and assess the implications for entry and exit points in trading strategies. Apply your knowledge to evaluate real-world chart examples, enhancing your ability to anticipate short-term price movements effectively.
Introduction to Short-Term Patterns
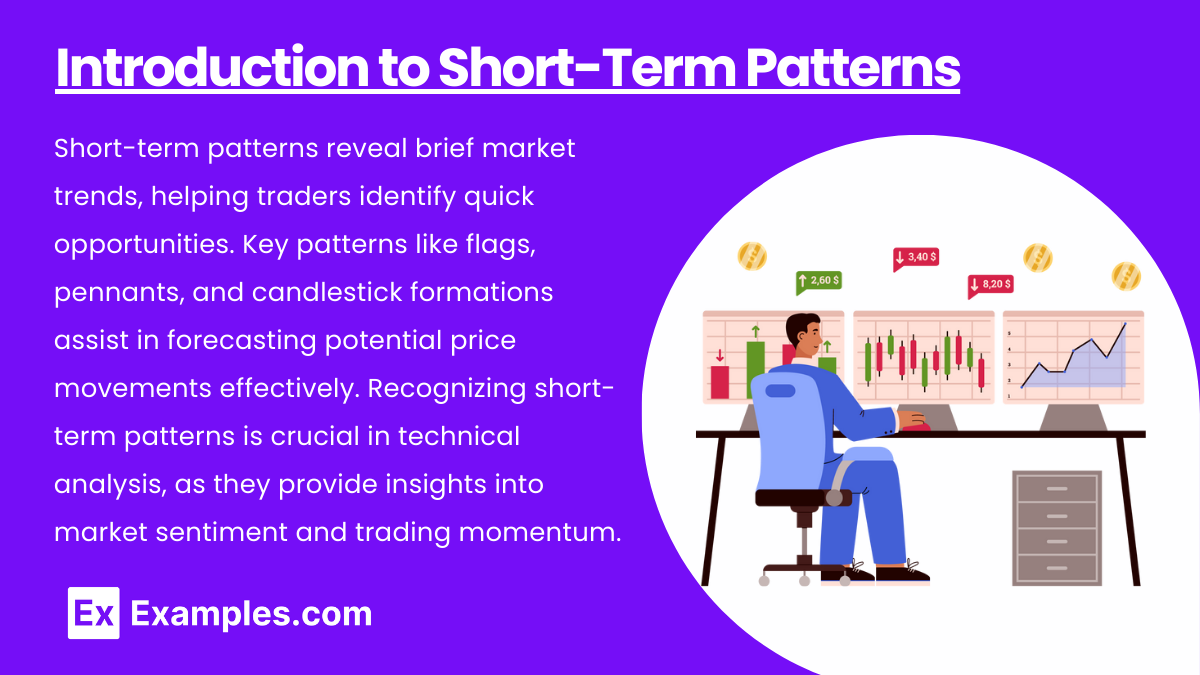
Short-term patterns are typically price patterns that last from a few days to a few weeks, signaling potential price reversals or continuations. Short-term patterns reveal brief market trends, helping traders identify quick opportunities. Key patterns like flags, pennants, and candlestick formations assist in forecasting potential price movements effectively. Traders analyze these patterns to capitalize on quick market movements, often using candlestick charts or bar charts. Recognizing short-term patterns is crucial in technical analysis, as they provide insights into market sentiment and trading momentum.
Types of Short-Term Patterns
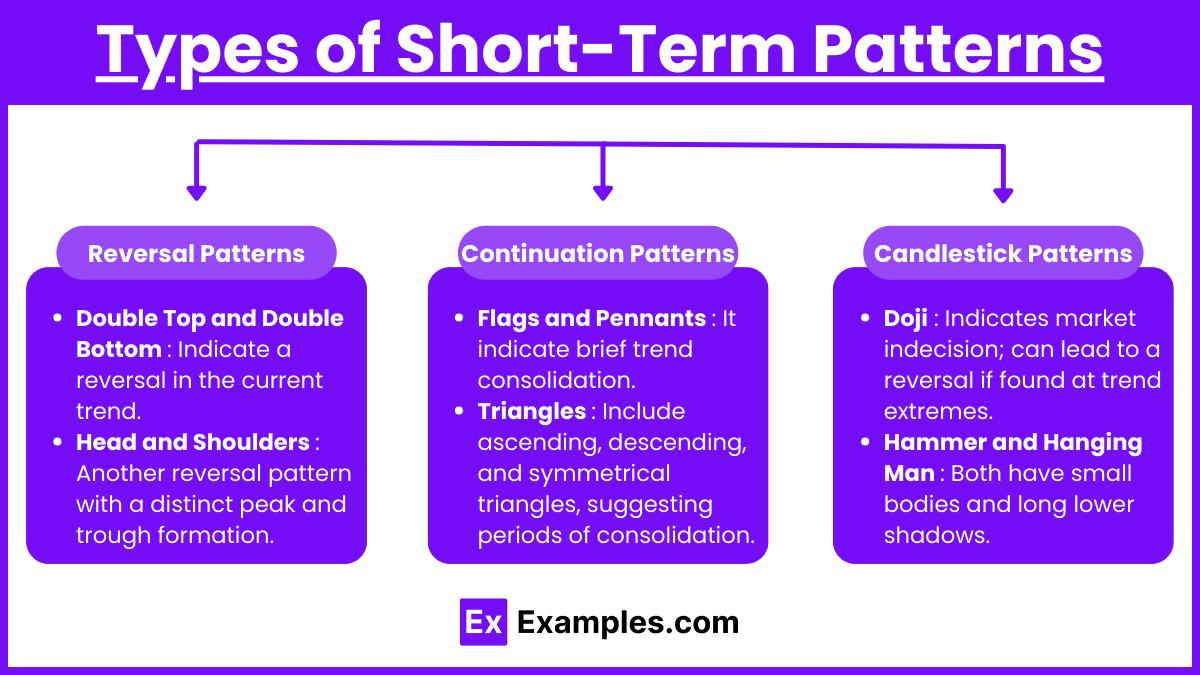
- Reversal Patterns
- Double Top and Double Bottom: Indicate a reversal in the current trend. A double top signals a potential downward reversal, while a double bottom suggests a potential upward reversal.
- Head and Shoulders: Another reversal pattern with a distinct peak and trough formation. A head and shoulders top marks the end of an uptrend, while an inverse head and shoulders signifies a bullish reversal in a downtrend.
- Continuation Patterns
- Flags and Pennants: Small, short-term formations signaling a brief consolidation before the prior trend resumes. Flags have parallel sides, while pennants resemble small symmetrical triangles.
- Triangles: Include ascending, descending, and symmetrical triangles, suggesting periods of consolidation. They often break in the direction of the prevailing trend.
- Candlestick Patterns
- Doji: Indicates market indecision; can lead to a reversal if found at trend extremes.
- Hammer and Hanging Man: Both have small bodies and long lower shadows, indicating potential reversals. A hammer in a downtrend is bullish, while a hanging man in an uptrend is bearish.
- Engulfing Patterns: Bullish and bearish engulfing patterns show strong momentum and can indicate reversals.
Key Considerations in Short-Term Pattern Analysis
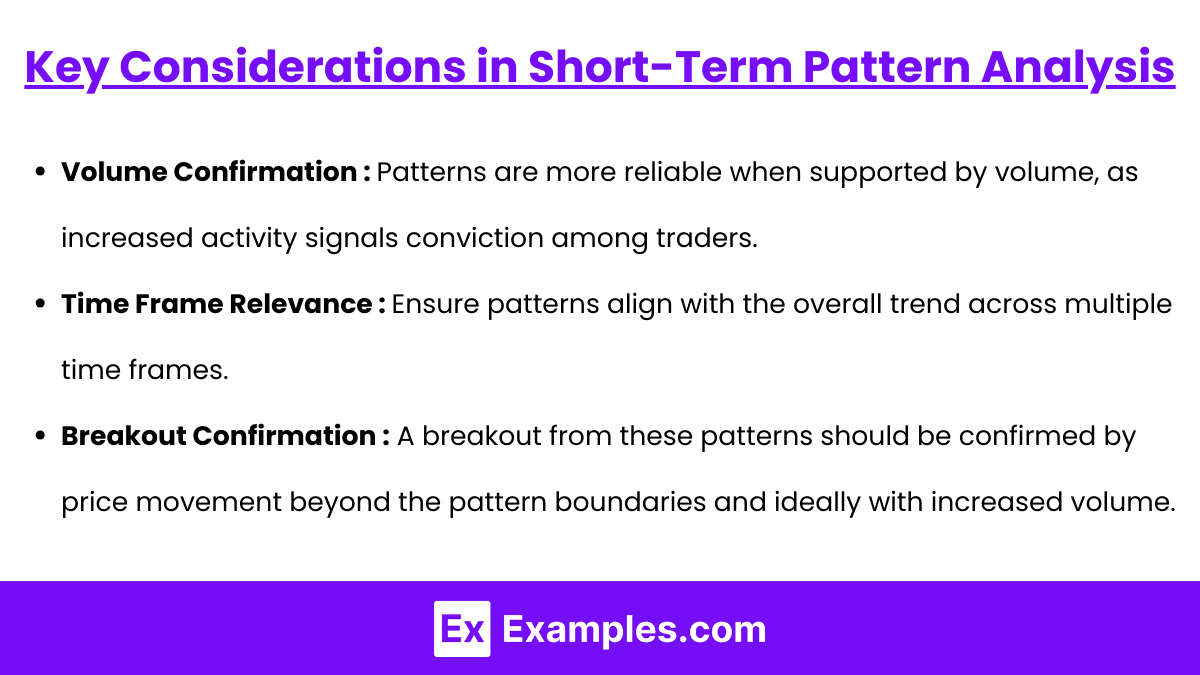
- Volume Confirmation: Patterns are more reliable when supported by volume, as increased activity signals conviction among traders.
- Time Frame Relevance: Ensure patterns align with the overall trend across multiple time frames.
- Breakout Confirmation: A breakout from these patterns should be confirmed by price movement beyond the pattern boundaries and ideally with increased volume.
Application and Trading Strategies
- Entry and Exit Points: Use these patterns to establish precise entry and exit points. For example, enter on the breakout of a flag or pennant in the trend direction.
- Stop-Loss Placement: Stop-loss orders are often placed slightly outside the boundaries of the pattern to mitigate risk.
- Risk-Reward Ratio: Always calculate a favorable risk-reward ratio based on the expected price movement from the pattern’s formation.
Examples
Example 1 : Flag Pattern
A flag pattern is a short-term continuation pattern that forms after a strong price move, typically lasting from a few days to a few weeks. The pattern resembles a small rectangle that slopes against the prevailing trend and signifies a brief consolidation before the trend resumes. It is confirmed by a breakout in the original trend’s direction, often accompanied by increased volume. Flag patterns are highly useful for identifying entry points during trend retracements, with stop-losses placed just outside the flag structure for risk management.
Example 2: Pennant Pattern
Similar to the flag, a pennant is a continuation pattern that appears as a small, symmetrical triangle following a sharp price movement. Unlike flags, pennants have converging trendlines, giving them a triangular shape. This pattern represents a period of indecision before the market chooses a direction, often resuming the trend with a breakout. Traders can enter trades in the direction of the breakout and use the pennant structure to set stop-loss levels. Pennants are valuable in momentum trading, where quick movements offer significant short-term profit potential.
Example 3: Doji Candlestick
The Doji candlestick is a single-candle reversal pattern that signals market indecision. It forms when the open and close prices are nearly equal, resulting in a very small body with long shadows. A Doji at the peak of an uptrend or the trough of a downtrend may indicate a potential reversal. While the Doji alone is not enough to confirm a trend change, it becomes more powerful when observed alongside other technical indicators or in conjunction with support and resistance levels. In short-term trading, Doji patterns prompt traders to watch for possible trend reversals and adjust positions accordingly.
Example 4: Hammer and Hanging Man
These single-candle patterns indicate possible trend reversals and appear frequently in short-term trading. The hammer has a small body with a long lower shadow and appears at the end of a downtrend, signaling a potential upward reversal. The hanging man has a similar structure but occurs at the top of an uptrend, hinting at a bearish reversal. Both patterns are more effective when confirmed by volume and subsequent price movement in the expected direction. They provide clear entry signals for short-term trades, especially in volatile market conditions.
Example 5: Engulfing Patterns (Bullish and Bearish)
Engulfing patterns are two-candle reversal patterns where the body of the second candle completely engulfs the previous one. In a bullish engulfing pattern, a large white (or green) candlestick engulfs a smaller black (or red) one, signaling a potential upward reversal. Conversely, a bearish engulfing pattern occurs when a large black (or red) candle engulfs a smaller white (or green) one, suggesting a downward reversal. Engulfing patterns are more reliable when they appear near support or resistance levels and are confirmed by volume. These patterns offer short-term traders opportunities to enter positions with tight stop-losses, optimizing risk-reward ratios.
Practice Questions
Question 1
A flag pattern in technical analysis typically indicates which of the following?
A) A long-term reversal in trend
B) A short-term continuation in the existing trend
C) A period of prolonged market consolidation
D) An immediate reversal without a clear trend
Answer: B) A short-term continuation in the existing trend
Explanation: A flag pattern is a short-term continuation pattern that occurs after a strong price movement. The flag typically forms as a brief, rectangular-shaped consolidation period that slopes against the direction of the prevailing trend. It suggests that the market is pausing briefly before resuming its original direction. Flags are commonly used to identify continuation signals, as they often precede a breakout that aligns with the existing trend, confirming that the original momentum remains intact. This is why option B is correct.
Question 2
Which of the following is true about the Doji candlestick pattern?
A) It always indicates a trend reversal
B) It is formed when the open and close prices are almost the same
C) It signals strong buying pressure
D) It only occurs at the bottom of a downtrend
Answer: B) It is formed when the open and close prices are almost the same
Explanation: The Doji candlestick pattern forms when the opening and closing prices of a security are nearly equal, resulting in a small or non-existent body and often long shadows. This pattern reflects market indecision, where neither buyers nor sellers have control. While a Doji can indicate a potential reversal when found at the top or bottom of a trend, it does not guarantee one; additional confirmation from other technical indicators is usually needed. Option B is correct because it accurately describes how a Doji candlestick is formed.
Question 3
In an engulfing pattern, what does it signify if a large bullish candle engulfs a smaller bearish candle?
A) A likely continuation of the downtrend
B) A potential bullish reversal
C) A sign of market consolidation
D) A likely immediate bearish reversal
Answer: B) A potential bullish reversal
Explanation : A bullish engulfing pattern occurs when a large bullish (white or green) candle fully engulfs the body of the previous bearish (black or red) candle. This pattern typically appears at the end of a downtrend and signals strong buying pressure, potentially indicating the start of an upward reversal. The larger bullish candle shows that buyers have taken control, often leading to a shift in market sentiment. For this reason, option B is correct, as a bullish engulfing pattern suggests a potential reversal from a bearish to a bullish trend.

