Preparing for the CMT Exam involves a deep understanding of short-term patterns, a key aspect of technical analysis. Mastery of these patterns, including formations like flags, pennants, and triangles, is essential for analyzing market movements. This knowledge aids in identifying entry and exit points, enhancing trading precision and success.
Learning Objective
In studying “Short-Term Patterns” for the CMT Exam, you should learn to recognize and interpret key chart patterns that occur over short time frames, such as flags, pennants, wedges, and triangles. Analyze how these patterns reflect temporary price consolidations and the potential for breakout movements. Evaluate the principles of volume and price action that validate these formations, distinguishing continuation from reversal signals. Additionally, explore how short-term patterns can be utilized in technical trading strategies, enabling you to make informed decisions in fast-paced markets, and apply your understanding by analyzing chart examples and scenarios in CMT practice questions.
Key Short-Term Patterns

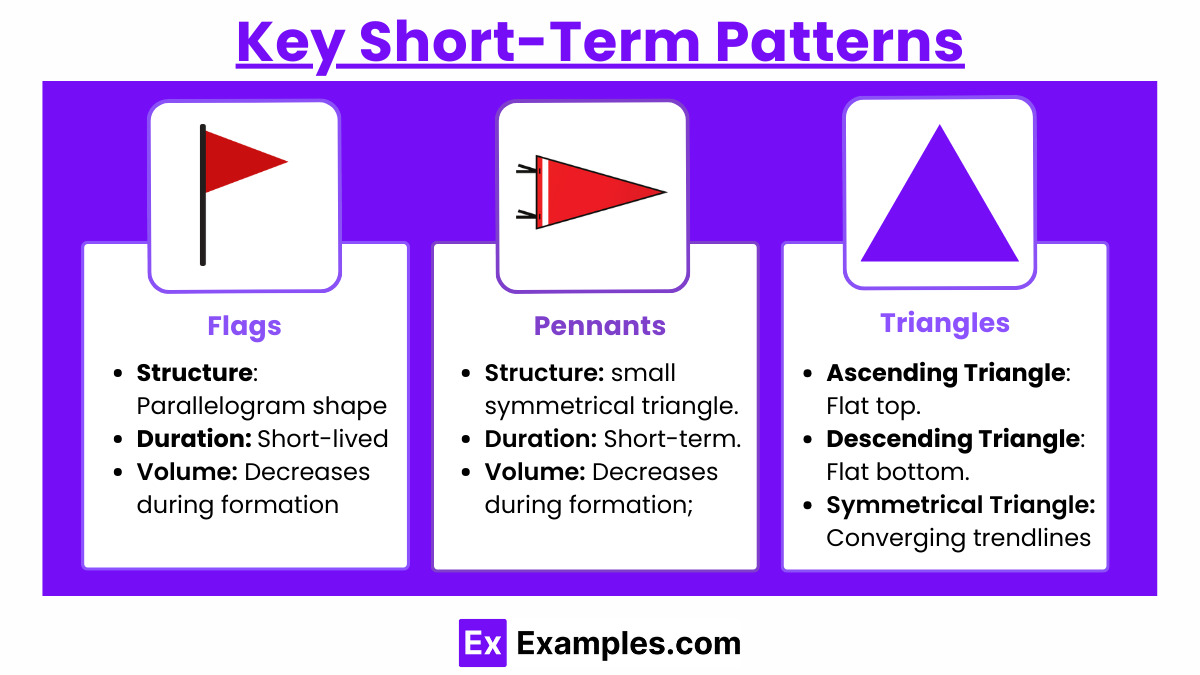
Understanding key short-term patterns is essential for recognizing price movements that may signal trading opportunities. These patterns—flags, pennants, and triangles—are formations within a trend that represent temporary pauses or consolidations before potential breakouts. Each pattern carries unique characteristics that help traders interpret market behavior and anticipate the continuation or reversal of trends. Here’s a breakdown of each:
1. Flags
Flags are small, rectangular patterns that slope against the prevailing trend. They represent a short consolidation period within an ongoing trend, often seen after a strong price movement, indicating that the market is temporarily “catching its breath” before resuming the trend. Flags are characterized by:
- Structure: A parallelogram shape, sloping counter to the trend (e.g., a bullish flag slopes downward during an uptrend).
- Duration: Typically short-lived, usually lasting from a few days to a few weeks.
- Volume: Volume usually decreases during the formation of the flag and surges on the breakout, confirming the trend’s continuation.
Flags are often interpreted as continuation patterns, meaning that once the price breaks out of the flag, it is likely to move in the direction of the initial trend.
2. Pennants
Pennants are similar to flags in that they appear after strong price moves, but they differ in shape and trendline structure. Instead of a parallelogram, a pennant is shaped like a small triangle with converging trendlines. Pennants represent brief periods of market indecision within a strong trend, characterized by:
- Structure: Two converging trendlines form a small, symmetrical triangle.
- Duration: Short-term, similar to flags, lasting a few days to a few weeks.
- Volume: Volume typically decreases during the formation of the pennant and then spikes upon breakout.
Pennants, like flags, are also continuation patterns. They suggest that after the brief pause or consolidation, the price is likely to break out in the same direction as the prevailing trend.
3. Triangles
Triangles can be either ascending, descending, or symmetrical. Unlike flags and pennants, triangles may not always signal a continuation; they can indicate both continuations and reversals, depending on their formation and breakout direction. Triangles develop as the price moves within a narrowing range, reflecting a battle between buyers and sellers, characterized by:
- Ascending Triangle: This pattern has a flat top with an upward-sloping bottom trendline. It’s typically bullish, with an expected breakout to the upside.
- Descending Triangle: This pattern has a flat bottom with a downward-sloping top trendline. It’s often bearish, signaling a potential breakdown.
- Symmetrical Triangle: With converging upper and lower trendlines, symmetrical triangles reflect indecision and can break out in either direction, depending on market sentiment.
Triangles indicate market consolidation and impending price movements. The volume generally diminishes as the triangle forms, with a significant volume increase upon breakout, confirming the direction of the move.
Volume Analysis in Short-Term Patterns

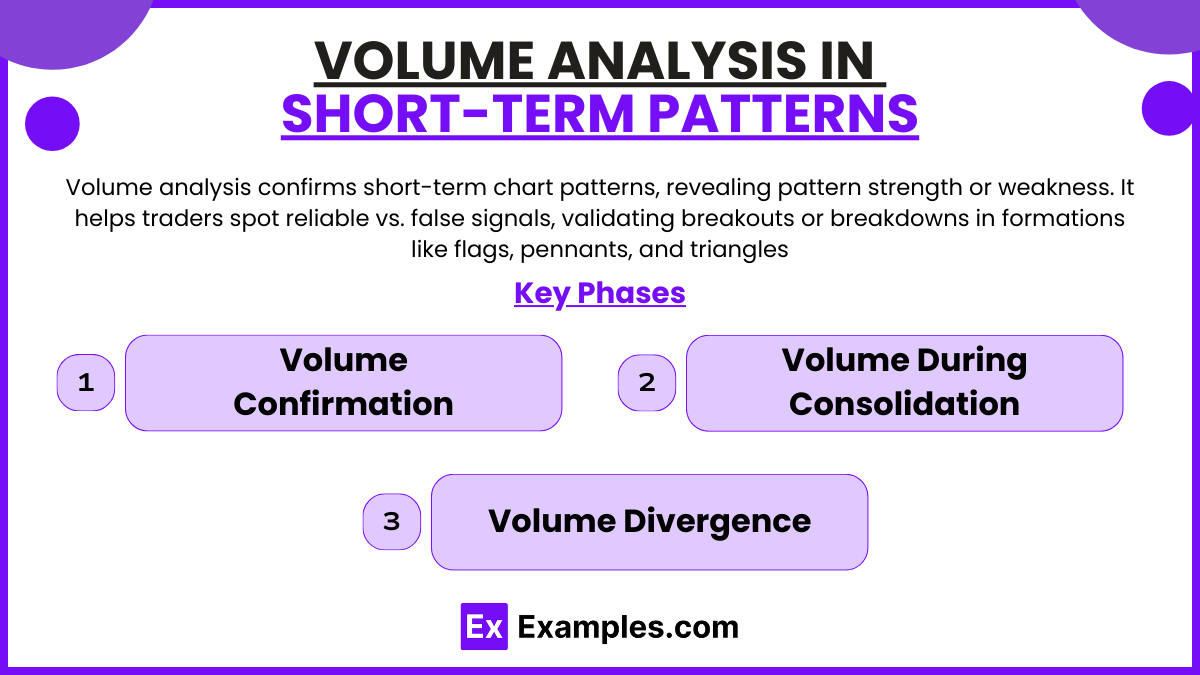
Volume analysis is a crucial tool for interpreting and confirming short-term chart patterns in technical analysis. It provides insight into the strength or weakness of a pattern and can help traders differentiate between reliable patterns and false signals. Volume patterns vary across different short-term formations, such as flags, pennants, and triangles, and play a key role in validating breakouts or breakdowns. Here’s a detailed explanation of volume analysis in these patterns:
1. Volume Confirmation
Volume serves as a confirming indicator in many chart patterns. In general, when volume aligns with the pattern’s anticipated breakout direction, it adds reliability to the pattern. For example:
- High Volume on Breakouts: When a breakout from a flag, pennant, or triangle occurs, a significant increase in volume indicates strong buying or selling interest, affirming the validity of the breakout. High volume suggests that many participants are active in the direction of the breakout, lending strength to the move.
- Low Volume on Breakouts: A breakout with low volume, on the other hand, raises concerns about the breakout’s sustainability. Low volume suggests a lack of enthusiasm or participation, which might signal a false breakout. In such cases, the price could potentially revert or fail to continue in the breakout direction.
2. Volume During Consolidation
During the formation phase of short-term patterns like flags, pennants, and triangles, volume often decreases. This phase represents a period of market “pause” or consolidation, where price movements are less intense. In this context:
- Decreasing Volume: As prices move sideways or slightly against the prevailing trend, volume usually declines, indicating that fewer market participants are actively trading. This reduced volume reflects indecision or a temporary pause in market enthusiasm.
- Increased Volume on Breakout: When the pattern reaches completion and a breakout occurs, an increase in volume is expected. This volume surge marks the reentry of traders and investors as the price begins to move in the breakout direction.
For instance, in a flag pattern, volume typically decreases during the flag’s formation, as the market takes a breather following a strong initial price movement. Once the breakout from the flag occurs, volume often rises, confirming that the trend is resuming.
3. Volume Divergence
Volume divergence occurs when price movements and volume trends don’t align. This can be a warning sign, indicating potential reversals or weakening trends within a pattern. Some key points to consider are:
- Volume Decreasing in a Rising Pattern: If volume decreases while the price is attempting to break out or trend higher, it can signal weakness. In the context of short-term patterns, this might suggest a potential reversal or a failed breakout.
- Increasing Volume with Declining Prices: If volume rises while prices are declining within a short-term pattern, it could indicate strong selling pressure. This is often seen as a bearish signal, suggesting that a breakdown might be more likely.
In short-term patterns, volume divergence helps traders assess whether a pattern is likely to fulfill its continuation or reversal expectation. If volume doesn’t confirm the price action, traders might reconsider the reliability of the breakout or breakdown.
Application of Short-Term Patterns in Trading Strategies

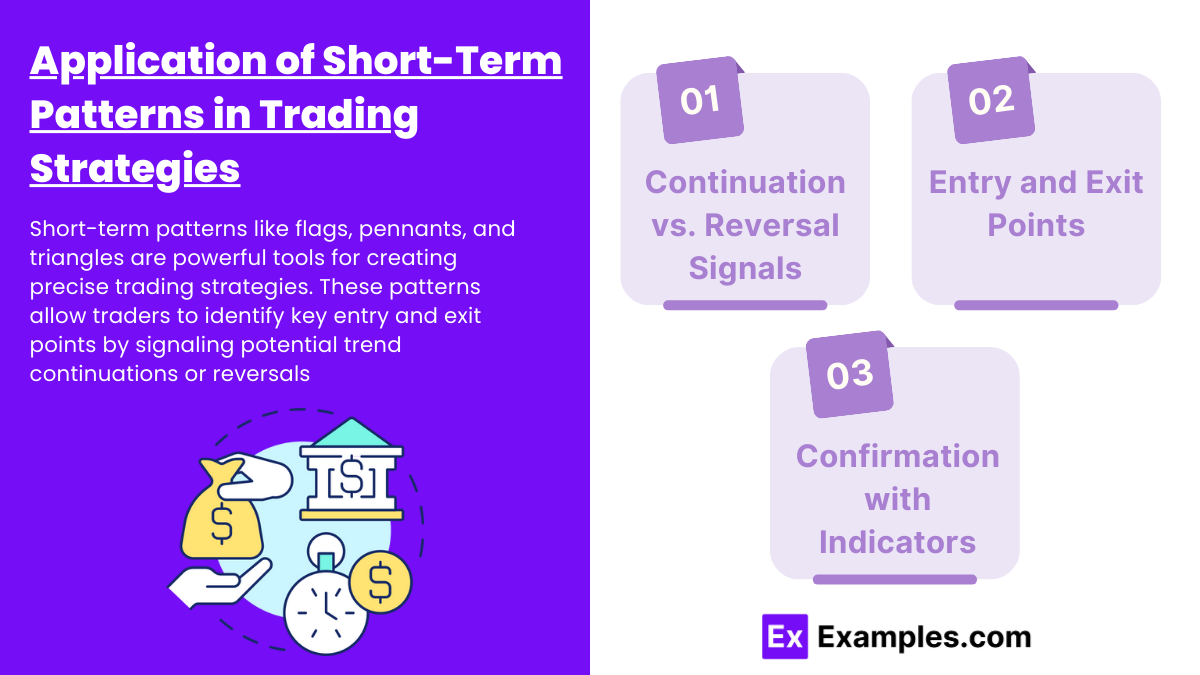
Short-term patterns like flags, pennants, and triangles are powerful tools for creating precise trading strategies. These patterns allow traders to identify key entry and exit points by signaling potential trend continuations or reversals. Here’s how they’re applied in trading:
- Continuation vs. Reversal Signals: Patterns can indicate whether the price is likely to continue in the trend’s direction or reverse. For example, flags and pennants usually signal trend continuation, while certain triangles can indicate reversals.
- Entry and Exit Points: Traders use breakouts from these patterns as entry points, with stop-loss orders placed near the pattern’s boundary to manage risk effectively. This approach helps capture the breakout momentum while limiting potential losses.
- Confirmation with Indicators: Short-term patterns are often combined with technical indicators like moving averages or RSI to confirm the trade. For instance, a flag breakout accompanied by high RSI can reinforce a buy signal.
Examples
Example 1: Bullish Flag Pattern
A stock is in an uptrend and experiences a strong price rally. After this upward movement, the price consolidates slightly downward, forming a rectangular, downward-sloping flag shape. Volume decreases during this consolidation phase. When the price breaks above the upper boundary of the flag with increased volume, this signals a continuation of the uptrend, and traders might consider entering a long position.
Example 2: Bearish Pennant Pattern
A stock is in a downtrend and experiences a sharp decline. Following this, the price consolidates sideways, forming a small symmetrical triangle (pennant) on the chart. Volume decreases during the consolidation, but as the price breaks below the pennant’s lower boundary with increased volume, it signals a continuation of the downtrend, prompting traders to consider a short position.
Example 3: Ascending Triangle in an Uptrend
A stock is trending upward and consolidates, forming an ascending triangle pattern where the price forms a flat resistance level on top and an upward-sloping trendline on the bottom. Volume typically decreases during the formation of the triangle. When the price breaks above the resistance level with a spike in volume, it indicates the continuation of the uptrend, suggesting an entry point for a long trade.
Example 4: Descending Triangle in a Downtrend
A stock is in a downtrend and consolidates, creating a descending triangle pattern with a flat support level at the bottom and a downward-sloping trendline on top. Volume diminishes as the triangle forms. When the price breaks below the support level with increased volume, it signals a continuation of the downtrend, suggesting an entry point for a short position.
Example 5: Symmetrical Triangle as a Reversal Signal
A stock is trading sideways and forms a symmetrical triangle, where both upper and lower trendlines converge. Volume decreases as the triangle narrows. In this case, the breakout direction isn’t predictable and can act as a reversal signal depending on market sentiment. If the price breaks above the upper trendline with increased volume, traders might go long, but if it breaks below the lower trendline with volume, they may consider a short trade.
Practice Questions
Question 1
Which of the following best describes a bullish flag pattern?
A. A pattern where the price consolidates in a downward-sloping rectangle after an uptrend, followed by a breakout upward
B. A triangle pattern that forms when both trendlines converge as the price moves sideways
C. A reversal pattern that indicates a change from an uptrend to a downtrend
D. A pattern that appears in a downtrend and signals a continuation of the trend
Answer: A
Explanation: A bullish flag pattern appears after a strong upward price movement, where the price consolidates in a downward-sloping rectangular shape. This consolidation is usually followed by a breakout to the upside, indicating a continuation of the uptrend.
Question 2
In a descending triangle pattern, what is the significance of a breakout below the support level?
A. It signals a potential reversal from a downtrend to an uptrend
B. It indicates a continuation of the downtrend
C. It represents market indecision and can lead to a breakout in either direction
D. It confirms that the price will remain in consolidation for a longer period
Answer: B
Explanation: A descending triangle pattern forms during a downtrend and typically signals a continuation of the trend. A breakout below the support level with increased volume confirms the downtrend’s continuation, often prompting traders to consider a short position.
Question 3
Which of the following patterns is typically used to signal indecision in the market and can break out in either direction?
A. Bullish flag
B. Pennant
C. Ascending triangle
D. Symmetrical triangle
Answer: D
Explanation: A symmetrical triangle reflects indecision in the market as it forms with converging trendlines. This pattern can break out in either direction, depending on market sentiment, and is not specifically a continuation or reversal pattern by itself.


