The “Single Candle Lines” topic is fundamental for the CMT Exam, focusing on the basics of candlestick charting, which aids in market analysis. Understanding single candle patterns, such as doji, hammer, and shooting star, allows analysts to interpret market sentiment, predict price movements, and make informed trading decisions.
Learning Objective
In studying “Single Candle Lines” for the CMT Exam, you should learn to identify and interpret individual candlestick patterns, such as doji, hammer, hanging man, and shooting star, which serve as key indicators of market sentiment. Develop an understanding of how each pattern signals potential price reversals or continuations, depending on its placement within a price trend. Evaluate the psychological implications behind these patterns and their significance in forecasting market movements. Additionally, apply these concepts in analyzing real-world trading scenarios, using single candle line analysis as a foundational tool for technical analysis and decision-making in financial markets.
Introduction to Single Candle Line Patterns

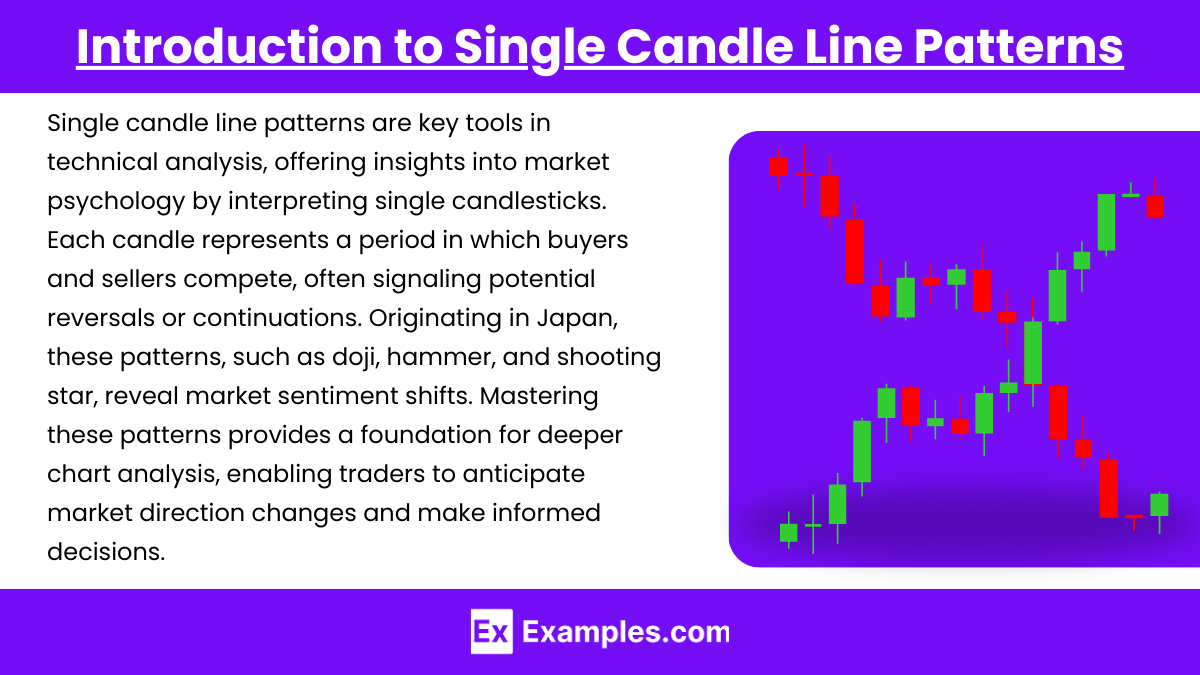
Single candle line patterns are essential tools in technical analysis, offering insights into market psychology through the interpretation of a single candlestick within a chart. Each candle represents a specific period, and its shape and position reveal the battle between buyers and sellers during that time. These patterns often signal potential price reversals or continuations, allowing traders to make more informed decisions.
Historically, candlestick charting originated in Japan, where traders used it to predict rice market movements. Over time, this technique has become a staple in modern financial markets due to its simplicity and effectiveness in visualizing price action. Key single candle lines, like doji, hammer, hanging man, and shooting star, serve as signals of market sentiment shifts, often indicating indecision, bullish optimism, or bearish pessimism.
Mastering single candle line patterns is critical for any technical analyst, as these patterns provide a foundation for more complex chart analysis and strategy formulation. By recognizing and understanding these patterns, traders can anticipate potential changes in market direction and adjust their positions accordingly.
Key Single Candle Line Patterns

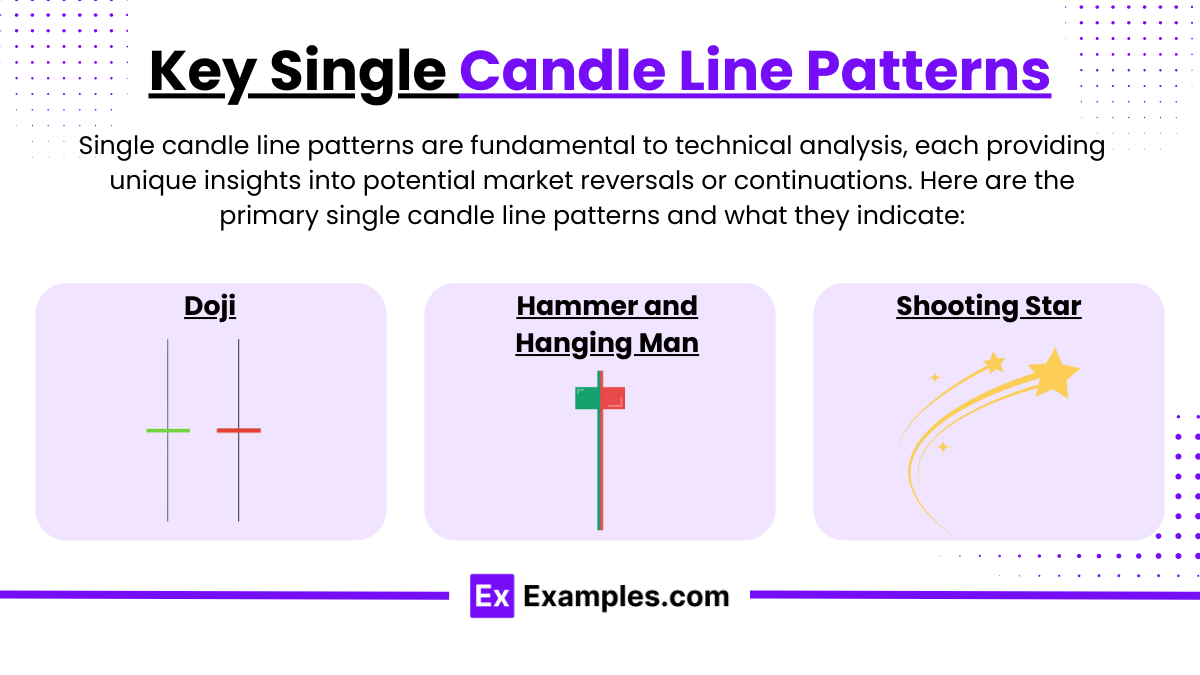
Single candle line patterns are fundamental to technical analysis, each providing unique insights into potential market reversals or continuations. Here are the primary single candle line patterns and what they indicate:
1. Doji
- A doji forms when the opening and closing prices are nearly identical, creating a small or nonexistent body with long or short wicks. This pattern signifies indecision in the market, as neither buyers nor sellers have control.
- Dojis are particularly meaningful after a strong trend. In an uptrend, a doji can signal that buying momentum may be weakening, suggesting a possible reversal. In a downtrend, it may indicate that sellers are losing steam.
2. Hammer and Hanging Man
- These patterns look similar, with a small body near the top and a long lower shadow, but they have different implications based on the trend they appear in.
- Hammer: Found at the bottom of a downtrend, the hammer signals potential reversal, as buyers step in after a strong selling phase, pushing prices back up. This pattern suggests that sellers are losing strength, and buyers may gain control.
- Hanging Man: Appears at the top of an uptrend and suggests a possible bearish reversal. While the price opens high, strong selling pressure drives it down during the session, although buyers manage to push it back up by the close. This may warn of diminishing buying power.
3. Shooting Star
- The shooting star is a bearish pattern that appears at the top of an uptrend. It has a small body at the bottom, with a long upper shadow and minimal or no lower shadow.
- This pattern shows that buyers initially pushed the price higher, but sellers took control by the end of the session, bringing the price down. It indicates a potential reversal as selling pressure increases, especially if it follows a strong uptrend.
Each of these patterns provides a glimpse into market sentiment and is valuable for anticipating trend shifts. While a single candle line alone may not confirm a reversal, these patterns can be powerful indicators when combined with other technical analysis tools, helping traders make better-informed decisions in response to potential market changes.
Analyzing Market Sentiment with Single Candle Lines

Single candle line patterns offer critical insights into market sentiment, helping traders understand the underlying psychology driving price movements. Each pattern reflects the behavior of buyers and sellers during a specific trading period, offering clues to whether a trend may continue or reverse. Here’s how these patterns reveal market sentiment:
1. Psychological Interpretation
- Each single candle pattern has a unique shape that represents different levels of market conviction. For instance, a doji suggests indecision, as neither buyers nor sellers dominate, creating a balance that could hint at a reversal. A hammer indicates that sellers initially had control but were overtaken by buyers, signaling potential bullish sentiment, especially in a downtrend.
- Understanding the psychology behind these patterns—such as fear, greed, optimism, or uncertainty—enables analysts to anticipate potential shifts in sentiment, which can affect price direction.
2. Reversal and Continuation Signals
- Single candle patterns often serve as indicators of trend reversals or continuations, depending on their context within a price trend. For example, a shooting star at the peak of an uptrend often signals a potential bearish reversal, as buyers lose momentum and sellers take control.
- Recognizing these signals helps traders make timely decisions. In a strong uptrend, a hanging man may caution that buying strength is waning, while a hammer in a downtrend suggests a possible end to selling pressure.
Examples
Example 1
A Doji pattern appears at the end of an uptrend. The candle has almost no body, with long upper and lower shadows, indicating indecision in the market. This pattern suggests that the buying pressure may be weakening, and a reversal could be on the horizon, potentially signaling a shift to a downtrend.
Example 2
A Hammer pattern forms at the bottom of a downtrend. It has a small body near the top of the candle and a long lower shadow. This pattern indicates that while sellers initially dominated the session, buyers stepped in and pushed the price up, suggesting a possible reversal to an uptrend.
Example 3
A Shooting Star appears at the top of an uptrend. The candle has a small body at the bottom, with a long upper shadow and little to no lower shadow. This pattern shows that buyers initially drove the price higher, but sellers took control by the close. It signals a potential bearish reversal.
Example 4
A Hanging Man pattern shows up in an uptrend. Similar to the hammer, it has a small body at the top and a long lower shadow. Although buyers managed to close the price near the open, the long shadow indicates increased selling pressure, warning of a possible reversal to a downtrend.
Example 5
A Gravestone Doji forms during an uptrend. This candle has no body, with only an upper shadow, resembling a “gravestone.” It suggests that buyers tried to push the price higher but were overpowered by sellers, closing at or near the opening price. This pattern typically signals a bearish reversal
Practice Questions
Question 1
What does a doji candlestick pattern generally indicate in a market trend?
A) Strong bullish trend continuation
B) Strong bearish trend continuation
C) Market indecision
D) Guaranteed trend reversal
Answer: C) Market indecision
Explanation: A doji pattern has nearly identical opening and closing prices, forming a small or nonexistent body. This shape indicates that neither buyers nor sellers have full control, which reflects market indecision. While it may hint at a possible trend reversal, it is not a guaranteed signal; further confirmation is often required.
Question 2
In which market condition is a hammer candlestick pattern most likely to signal a potential reversal?
A) Top of an uptrend
B) Bottom of a downtrend
C) Middle of a consolidation phase
D) Anywhere in the trend
Answer: B) Bottom of a downtrend
Explanation: The hammer pattern typically appears at the bottom of a downtrend, signaling potential bullish reversal. It has a small body and a long lower shadow, indicating that although sellers initially pushed prices down, buyers regained control by the close. This often suggests that selling pressure is weakening.
Question 3
A shooting star candlestick pattern usually indicates what type of market signal?
A) Bearish reversal at the top of an uptrend
B) Bullish reversal at the bottom of a downtrend
C) Continuation of a bullish trend
D) Continuation of a bearish trend
Answer: A) Bearish reversal at the top of an uptrend
Explanation: A shooting star forms at the top of an uptrend and has a small body with a long upper shadow, showing that buyers initially drove the price higher but sellers took over by the end of the session. This pattern often suggests a bearish reversal, signaling that buying pressure may be diminishing.


