Preparing for the CMT Exam requires a strong understanding of “Statistical Analysis” techniques that are vital for interpreting market data and making informed trading decisions. This involves understanding key concepts like central tendency (mean, median, and mode), variability (variance, standard deviation), and distribution shapes. Candidates should be familiar with correlation and regression analysis, which help assess relationships between different financial variables. Additionally, mastering time-series analysis is crucial for forecasting market trends and detecting patterns. A thorough understanding of probability theory, hypothesis testing, and p-values enables candidates to evaluate market behaviors and make data-driven decisions.
Learning Objectives
In studying Statistical Analysis for the CMT Exam, you should learn to understand its significance in analyzing market data and making informed trading decisions. Statistical analysis involves evaluating key measures such as mean, median, variance, and standard deviation to interpret price movements and volatility. Techniques like regression analysis, correlation, and time-series forecasting are essential for identifying trends and relationships between financial variables. By mastering these statistical methods, candidates can enhance their ability to analyze market conditions, optimize trading strategies, and manage risks effectively, which is crucial for success in the CMT Exam.
What is Statistical Analysis?
Statistical analysis refers to the process of collecting, organizing, interpreting, and presenting data in order to uncover patterns, relationships, and insights that can guide decision-making. It involves the application of various statistical techniques and methods to analyze data sets and derive meaningful conclusions. Statistical analysis is used in a wide range of fields, including business, healthcare, economics, social sciences, and many others, to inform decisions and make predictions based on empirical data.
Applications of Statistical Analysis
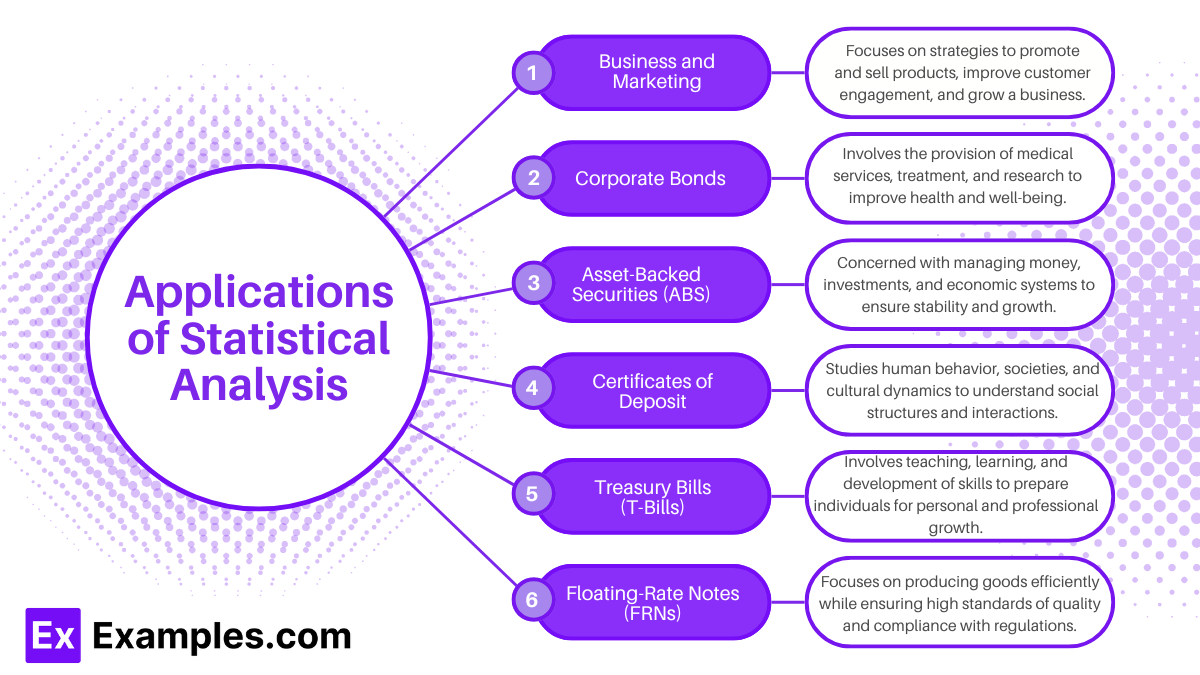
Statistical analysis plays a crucial role in many fields by allowing researchers, businesses, and governments to make informed decisions based on data. Below are some of the key areas where statistical analysis is widely applied:
1. Business and Marketing
- Market Research: Statistical analysis helps businesses understand consumer behavior, preferences, and market trends.
- Customer Segmentation: Identifying distinct customer groups and tailoring marketing efforts to each group.
- Sales Forecasting: Predicting future sales based on historical data and trends.
- A/B Testing: Comparing two versions of a marketing campaign to determine which performs better.
2. Healthcare
- Clinical Trials: Analyzing the effectiveness of drugs or treatments by comparing results from different groups.
- Epidemiology: Studying the spread and impact of diseases, and identifying risk factors.
- Public Health Policy: Using statistical models to determine the effectiveness of health policies and interventions.
3. Finance and Economics
- Risk Analysis: Assessing the risk of investments and financial portfolios.
- Market Prediction: Using statistical methods to predict stock prices, currency fluctuations, and other market movements.
- Econometric Models: Analyzing economic data to understand the relationships between variables such as inflation, unemployment, and GDP.
4. Social Sciences
- Survey Analysis: Collecting and interpreting data from surveys to understand public opinion, social trends, or behavior patterns.
- Political Polling: Statistical methods are used to predict election outcomes and analyze voter behavior.
- Sociology and Psychology: Analyzing data to study human behavior, societal trends, and mental health patterns.
5. Education
- Student Performance: Analyzing test scores, graduation rates, and other academic data to assess and improve educational systems.
- Curriculum Effectiveness: Evaluating the success of teaching methods or programs in enhancing student learning outcomes.
6. Manufacturing and Quality Control
- Process Optimization: Using statistical methods to improve production efficiency, reduce waste, and ensure quality.
- Six Sigma: A set of techniques used to improve process quality by identifying and removing causes of defects.
- Control Charts: Monitoring production processes to ensure they stay within acceptable quality limits.
7. Sports Analytics
- Performance Analysis: Assessing player and team performance using data such as scoring averages, win-loss records, and player metrics.
- Game Strategy: Using statistical models to predict the outcome of games and formulate strategies for success.
Key Components of Statistical Analysis
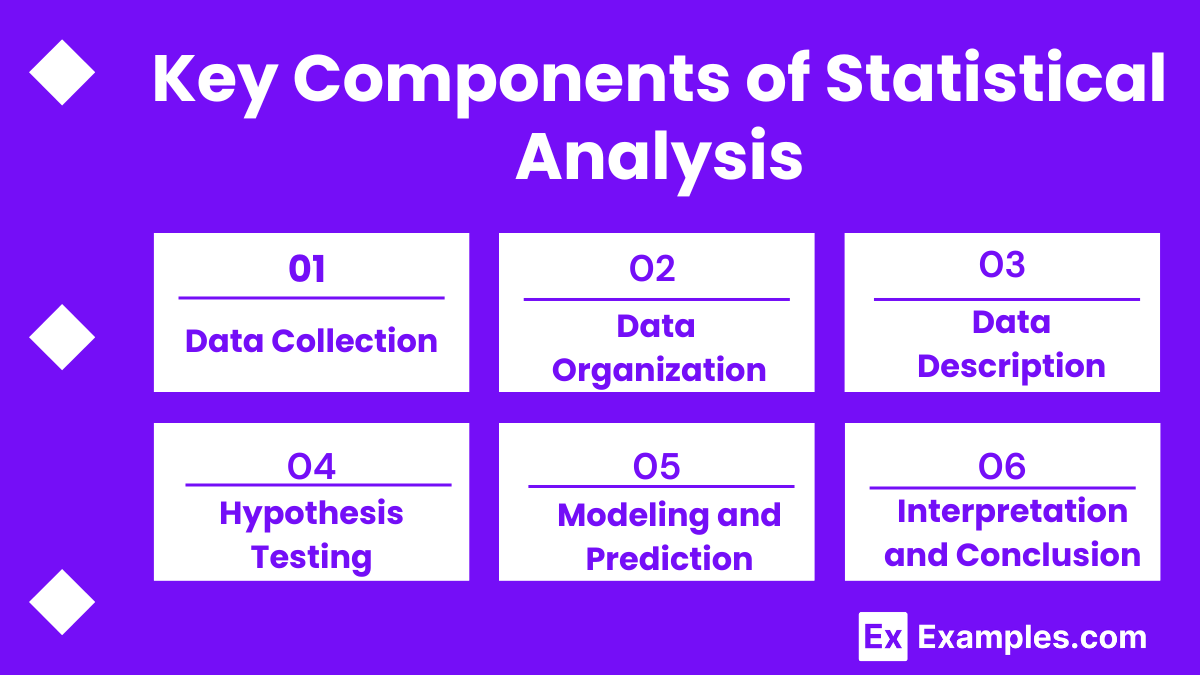
- Data Collection: Gathering data from various sources, such as surveys, experiments, or historical records, which is essential for analysis.
- Data Organization: Structuring the collected data in a way that allows it to be easily analyzed, often by using tools like spreadsheets, databases, or statistical software.
- Data Description: Using descriptive statistics to summarize and present the data through measures like mean, median, mode, and standard deviation.
- Hypothesis Testing: Formulating and testing hypotheses to determine if there is a statistically significant difference or relationship between variables.
- Modeling and Prediction: Applying statistical models, such as regression analysis or machine learning algorithms, to predict outcomes or relationships in the data.
- Interpretation and Conclusion: Drawing meaningful conclusions from the statistical results and making recommendations based on the findings.
Types of Statistical Analysis
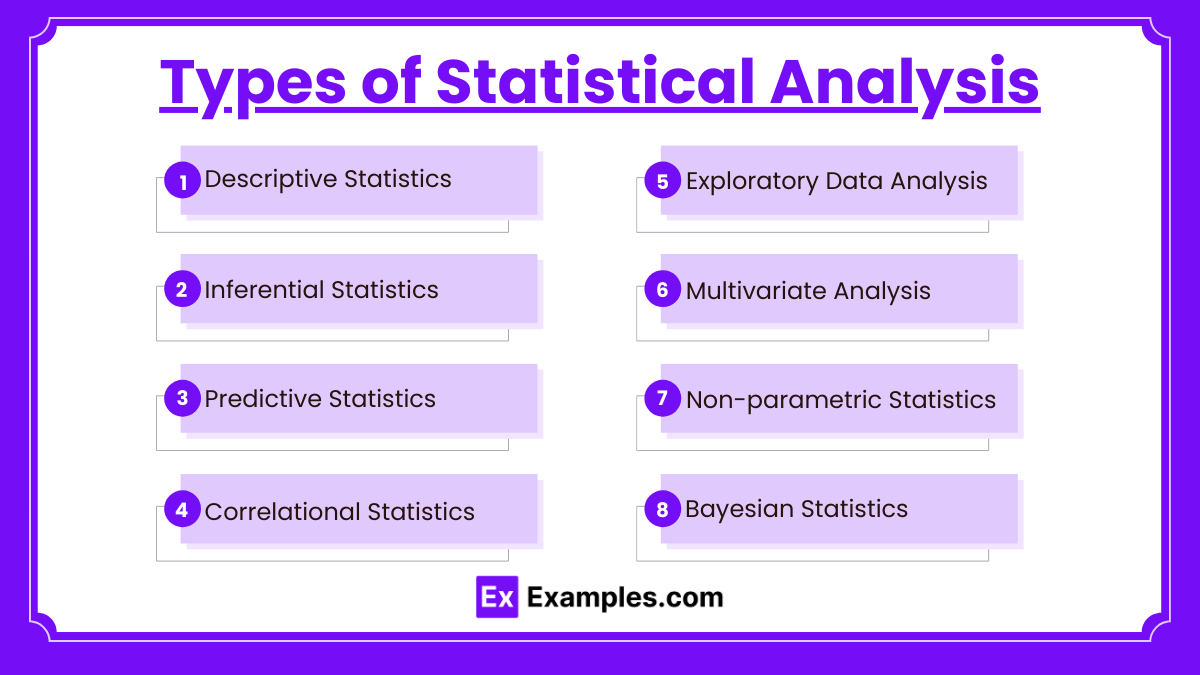
Statistical analysis is the process of collecting, reviewing, and interpreting data to uncover patterns and trends. It can be categorized into several types, each used for different purposes in data analysis. Here are the key types of statistical analysis:
- Descriptive Statistics
- Purpose: Summarizes and describes the features of a data set.
- Examples: Mean, median, mode, standard deviation, variance, and frequency distribution.
- Inferential Statistics
- Purpose: Makes predictions or inferences about a population based on a sample of data.
- Examples: Hypothesis testing, confidence intervals, regression analysis.
- Predictive Statistics
- Purpose: Uses data to predict future outcomes based on patterns observed in existing data.
- Examples: Time series analysis, machine learning algorithms.
- Correlational Statistics
- Purpose: Measures the relationship between two or more variables.
- Examples: Pearson correlation, Spearman’s rank correlation.
- Exploratory Data Analysis (EDA)
- Purpose: Analyzes data sets to summarize their main characteristics, often with visual methods.
- Examples: Boxplots, scatter plots, histograms.
- Multivariate Analysis
- Purpose: Examines the relationships between multiple variables simultaneously.
- Examples: Principal component analysis (PCA), factor analysis, multiple regression.
- Non-parametric Statistics
- Purpose: Analyzes data that doesn’t assume a specific distribution.
- Examples: Chi-square test, Kruskal-Wallis test, Wilcoxon test.
- Bayesian Statistics
- Purpose: Uses probability to model uncertainty about the world and updates predictions as new data becomes available.
- Examples: Bayesian inference, Markov Chain Monte Carlo (MCMC) methods.
Examples
Example 1. Environmental Impact Studies
Statistical analysis is instrumental in environmental science, particularly when assessing the impact of human activities on ecosystems. For instance, researchers use statistical methods to analyze the concentration of pollutants in air or water samples across different regions. By applying techniques such as time series analysis, they can detect trends, identify pollution hotspots, and predict the long-term effects on biodiversity, helping to shape environmental policies and regulations.
Example 2. Predictive Maintenance in Aerospace
In the aerospace industry, statistical analysis is used to predict when aircraft parts are likely to fail, improving safety and reducing downtime. Engineers apply statistical techniques such as survival analysis and regression modeling to historical maintenance data, identifying patterns in part failures. By predicting potential failures, airlines can schedule maintenance more efficiently, ensuring that critical components are replaced or repaired before they lead to serious issues.
Example 3. Retail Demand Forecasting
Retailers use statistical analysis to forecast product demand, which is crucial for inventory management. By analyzing historical sales data, seasonal trends, and customer purchasing behavior, businesses can create statistical models to predict future demand for products. For example, statistical analysis can be used to predict the number of umbrellas a store will sell during rainy months, helping to optimize stock levels and reduce costs associated with overstocking or stockouts.
Example 4. Agricultural Yield Prediction
In agriculture, statistical analysis is used to predict crop yields based on various factors such as soil quality, weather patterns, and irrigation practices. Farmers and agricultural scientists apply regression analysis to historical yield data to understand the relationship between these variables. This allows them to predict the expected harvest for a given year and optimize resource allocation, ensuring better planning for harvest time and minimizing losses.
Example 5. Customer Churn Analysis in Telecommunications
Telecommunication companies use statistical analysis to predict customer churn — when customers leave for competitors. By applying techniques like logistic regression and decision trees to customer data, including usage patterns, customer service interactions, and billing information, companies can identify high-risk customers and proactively offer retention strategies. This targeted approach helps businesses reduce churn rates and improve customer loyalty by offering personalized incentives or better service options.
Practice Questions
Question 1
Which of the following is the best measure of central tendency for a dataset with extreme outliers?
A) Mean
B) Median
C) Mode
D) Range
Answer: B) Median
Explanation:
The median is the best measure of central tendency when there are extreme outliers. The reason is that the median is the middle value of a dataset, and it is not influenced by extreme values (outliers) as much as the mean. The mean, on the other hand, can be heavily affected by outliers, making it an unreliable measure when the dataset includes extreme values. Mode may not be useful if there is no clear frequency of occurrence, and range provides information about spread but not central tendency.
Question 2
In hypothesis testing, which of the following p-values indicates strong evidence against the null hypothesis?
A) p-value = 0.05
B) p-value = 0.01
C) p-value = 0.10
D) p-value = 0.50
Answer: B) p-value = 0.01
Explanation:
In hypothesis testing, the p-value represents the probability of obtaining the observed results if the null hypothesis is true. A smaller p-value indicates stronger evidence against the null hypothesis. A p-value of 0.01 is typically below the common significance level of 0.05, meaning that the null hypothesis can be rejected with a high level of confidence. The lower the p-value, the stronger the evidence against the null hypothesis, making it more likely that the alternative hypothesis is true. Larger p-values (0.05, 0.10, and 0.50) suggest weak or no evidence against the null hypothesis.
Question 3
Which of the following is the correct interpretation of a correlation coefficient (r) of 0.85?
A) There is a weak positive linear relationship between the two variables.
B) There is a strong negative linear relationship between the two variables.
C) There is a strong positive linear relationship between the two variables.
D) The variables are unrelated.
Answer: C) There is a strong positive linear relationship between the two variables.
Explanation:
The correlation coefficient (r) measures the strength and direction of the linear relationship between two variables. The value of r ranges from -1 to +1. A value of 0.85 indicates a strong positive linear relationship, meaning that as one variable increases, the other also tends to increase. A correlation of 0.85 suggests that the relationship between the two variables is both strong and positive. If the value were negative (e.g., -0.85), it would indicate a strong negative relationship, but the positive value (0.85) indicates a positive correlation.

