The Anatomy of a Bubble explores the stages, characteristics, and psychological drivers of financial bubbles, providing critical insights into speculative market behavior. This topic examines the life cycle of a bubble—from formation and rapid price escalation to the peak and eventual collapse—highlighting factors like investor sentiment, media influence, and herd behavior. Understanding these dynamics helps technical analysts identify early warning signs and potential risks associated with unsustainable asset prices. Mastery of this concept is essential for recognizing market anomalies and applying strategies to mitigate exposure during periods of excessive speculation.
Learning Objectives
In studying “The Anatomy of a Bubble” for the CMT, you should learn to recognize the stages of a financial bubble, including the phases of stealth, awareness, mania, and blow-off. Understand the psychological and economic factors driving each stage, such as investor sentiment, speculative buying, and market euphoria. Analyze historical examples of asset bubbles, identifying common patterns and indicators, such as rapid price increases, excessive media attention, and irrational exuberance. Evaluate the role of fundamental and technical analysis in detecting potential bubbles early. Additionally, develop strategies for managing risk and protecting investments during bubble formations and bursts.
Recognizing the Stages of a Financial Bubble
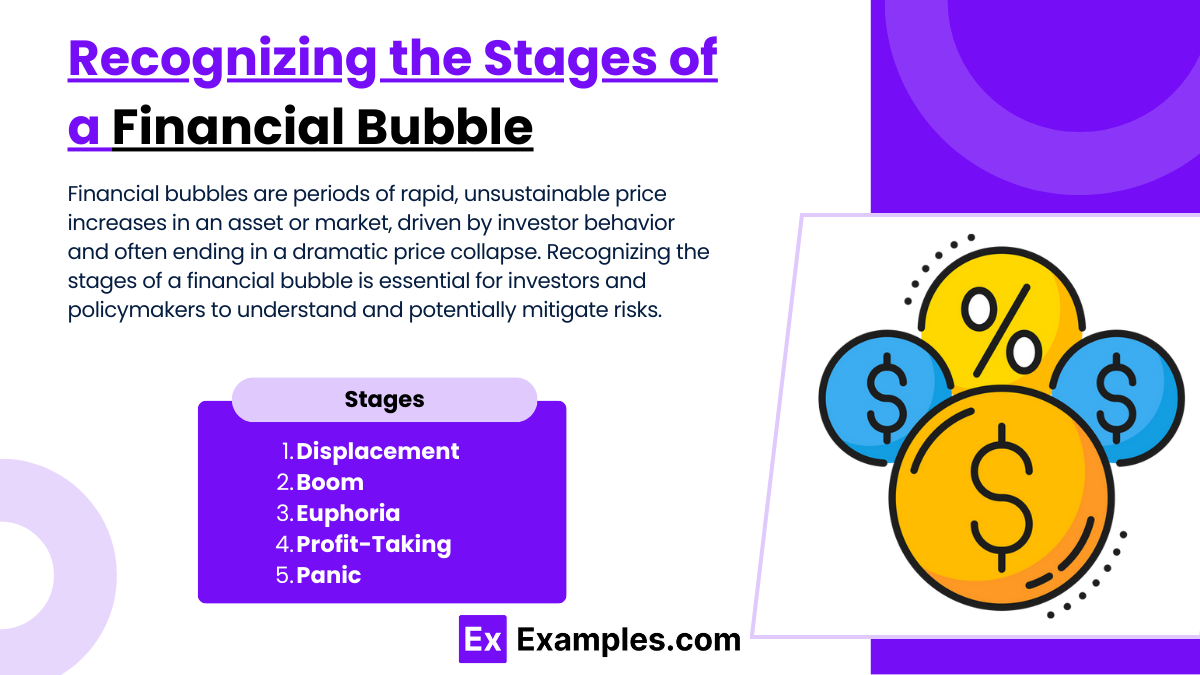
Financial bubbles are periods of rapid, unsustainable price increases in an asset or market, driven by investor behavior and often ending in a dramatic price collapse. Recognizing the stages of a financial bubble is essential for investors and policymakers to understand and potentially mitigate risks. Bubbles typically progress through a series of predictable stages: Displacement, Boom, Euphoria, Profit-Taking, and Panic. Here’s a closer look at each stage and its characteristics.
1. Displacement
The Displacement stage is the initial phase of a bubble, where a new technology, innovation, or economic change creates excitement about an asset or market. This change attracts investors as they see potential for substantial growth, but prices have not yet escalated dramatically.
Characteristics:
- Often triggered by a disruptive innovation, economic shift, or low-interest rates.
- Early adopters and informed investors recognize an opportunity, but it’s not widely publicized or understood.
- Prices begin to rise slowly as more people become aware of the asset’s potential.
Example: The rise of the internet in the early 1990s initially attracted investors to tech stocks, laying the groundwork for the dot-com bubble.
2. Boom
During the Boom stage, the asset gains widespread attention, and a larger number of investors start to buy in. As demand grows, prices increase steadily, which attracts even more investors, fueling further price appreciation. This phase is often marked by optimism and growing media coverage, which amplifies investor enthusiasm.
Characteristics:
- Increased media coverage and public awareness lead to growing investor interest.
- Prices rise quickly as more investors seek to profit from the opportunity.
- Speculative trading and investment start to increase, though the market’s fundamentals still provide some justification for price levels.
Example: In the mid-1990s, as more people started using the internet, tech stocks gained media attention, drawing retail and institutional investors into the booming technology sector.
3. Euphoria
The Euphoria stage represents the peak of excitement and price appreciation. Investors are driven by a strong fear of missing out (FOMO), leading to irrational exuberance. Prices rise exponentially, far exceeding the asset’s fundamental value, and risk is often ignored or underestimated.
Characteristics:
- Extreme optimism and speculation drive prices to unsustainable levels.
- Widespread investor participation, often including people with little knowledge of the asset or market.
- “Get rich quick” mentality spreads, with everyone from retail investors to major institutions buying in, regardless of valuation.
- Warning signs from financial experts and analysts may emerge, but they are often dismissed as overly cautious.
Example: By the late 1990s, the dot-com bubble reached a euphoric stage, with tech company stock prices skyrocketing, fueled by speculation and disregard for profitability or revenue potential.
4. Profit-Taking
In the Profit-Taking stage, some investors start to recognize that prices have reached unsustainable levels and begin to sell off their positions. This phase often starts with savvy or institutional investors who see the risks and want to lock in profits before a potential downturn.
Characteristics:
- A few early investors start selling to realize gains, which may cause small price declines.
- Signs of market instability may appear, but the general public still largely holds a positive outlook.
- Volatility increases as more investors start to sell in response to initial price drops.
Example: As some technology stocks reached their peak in early 2000, institutional investors began to sell, prompting minor price declines that signaled a turning point in the market.
5. Panic
The Panic stage, or crash, is the final phase, where prices plummet as investors rush to exit their positions. As more investors sell, prices drop further, creating a downward spiral. Fear overtakes the market, leading to significant losses and potential economic repercussions.
Characteristics:
- Mass selling as investors try to exit their positions, often at any price.
- Sharp, rapid declines in asset prices as panic spreads.
- Loss of investor confidence and negative media coverage compound the downward trend.
- The bubble “bursts,” and the asset returns to a value much closer to or below its fundamental worth.
Example: The dot-com bubble burst in 2000-2001, with technology stocks losing substantial value, some even becoming worthless. This crash had widespread economic effects, leading to a prolonged market downturn and significant losses for investors.
Psychological and Economic Factors Driving Each Stage

The journey of wealth management can be segmented into various stages, each influenced by unique psychological and economic factors. As clients progress from wealth accumulation to preservation and eventually to wealth transfer, their priorities and perspectives evolve. Understanding the psychological motivations and economic considerations at each stage helps wealth managers tailor strategies to meet client needs effectively.
1. Wealth Accumulation Stage
The wealth accumulation stage focuses on building and growing assets through investments, career advancement, and savings. Individuals in this stage are generally younger or in the earlier phases of their financial journey, often prioritizing growth and seeking opportunities to maximize wealth.
Psychological Factors
- Risk Appetite: Individuals in the accumulation stage tend to have a higher risk tolerance, driven by optimism about future earning potential and a desire to grow wealth. This encourages them to take on growth-oriented investments.
- Future Orientation: There is often a strong focus on long-term goals, such as homeownership, retirement, or financial independence, creating a psychological drive to save and invest aggressively.
- Confidence and Ambition: Many people in this stage feel motivated by career growth, entrepreneurial pursuits, and aspirations, often resulting in an open-minded approach to higher-risk investments like equities or real estate.
Economic Factors
- Income Growth: Rising incomes allow individuals to allocate more resources toward savings and investments, supporting portfolio growth.
- Market Opportunities: Economic factors like stock market cycles, interest rates, and inflation impact investment choices. For example, low-interest-rate environments encourage borrowing to invest in assets with higher growth potential.
- Cost of Living: Managing costs while balancing savings is essential, especially during early accumulation. Economic pressures can sometimes drive individuals to prioritize investments over lifestyle expenditures.
Example: A young professional with a high income might allocate most of their portfolio to equities and real estate, aiming for growth and capital appreciation, with a higher tolerance for market fluctuations.
2. Wealth Preservation Stage
In the wealth preservation stage, clients focus on protecting the wealth they have accumulated while still growing their assets, albeit at a more moderate pace. Typically, individuals in this phase are more established in their careers or nearing retirement, and they prioritize stability and risk management.
Psychological Factors
- Risk Aversion: As clients approach retirement or financial independence, they become more risk-averse, concerned about potential losses and preserving their wealth.
- Security Focus: The need for financial security becomes a priority, often motivated by responsibilities like family, health considerations, or future retirement needs.
- Shift from Growth to Stability: Psychologically, clients in this stage are less focused on rapid growth and more on steady returns, choosing conservative investments that ensure their wealth isn’t diminished by market volatility.
Economic Factors
- Economic Cycles: Economic downturns or uncertain market conditions significantly influence preservation strategies, as clients aim to protect capital from excessive volatility.
- Inflation Concerns: Maintaining purchasing power over time is important, so investments are chosen to counter inflation without taking excessive risk.
- Interest Rates: Lower-risk income-generating assets like bonds become more attractive, especially if they provide stable returns without high exposure to equity markets.
Example: An individual nearing retirement may shift a significant portion of their portfolio to bonds and dividend-paying stocks, prioritizing income generation and reduced volatility to preserve wealth.
3. Wealth Distribution or Transfer Stage
The wealth transfer stage, often associated with estate planning and legacy creation, focuses on ensuring that wealth is efficiently passed on to heirs or charitable causes according to the client’s wishes. Clients in this phase are typically older or have achieved significant financial security.
Psychological Factors
- Legacy and Family Values: Clients often feel a deep psychological desire to leave a legacy, emphasizing values and principles they wish to pass on to future generations.
- Desire for Control: There is a strong need for control over how wealth is distributed, ensuring that assets are passed on in a manner that reflects the client’s personal and family goals.
- Emotional Detachment: As clients move beyond wealth accumulation, their focus shifts from personal wealth growth to impact, often leading to a more detached view of money as a tool for broader purposes.
Economic Factors
- Tax Considerations: Estate taxes, capital gains taxes, and inheritance taxes significantly impact wealth transfer strategies, as clients seek tax-efficient methods to maximize wealth passed on to heirs.
- Inflation and Purchasing Power: Ensuring that wealth retains value over time is crucial, as economic factors like inflation can erode the real value of assets passed to future generations.
- Regulatory Environment: Estate and inheritance laws vary and affect wealth transfer strategies. Changes in tax policies or estate laws can shape how wealth managers advise clients on trusts, wills, and gifting.
Example: A high-net-worth individual may set up trusts for heirs, establish a donor-advised fund for charitable giving, or create a family foundation, utilizing tax-efficient methods to maximize wealth distribution.
Role of Fundamental and Technical Analysis in Detecting Bubbles Early
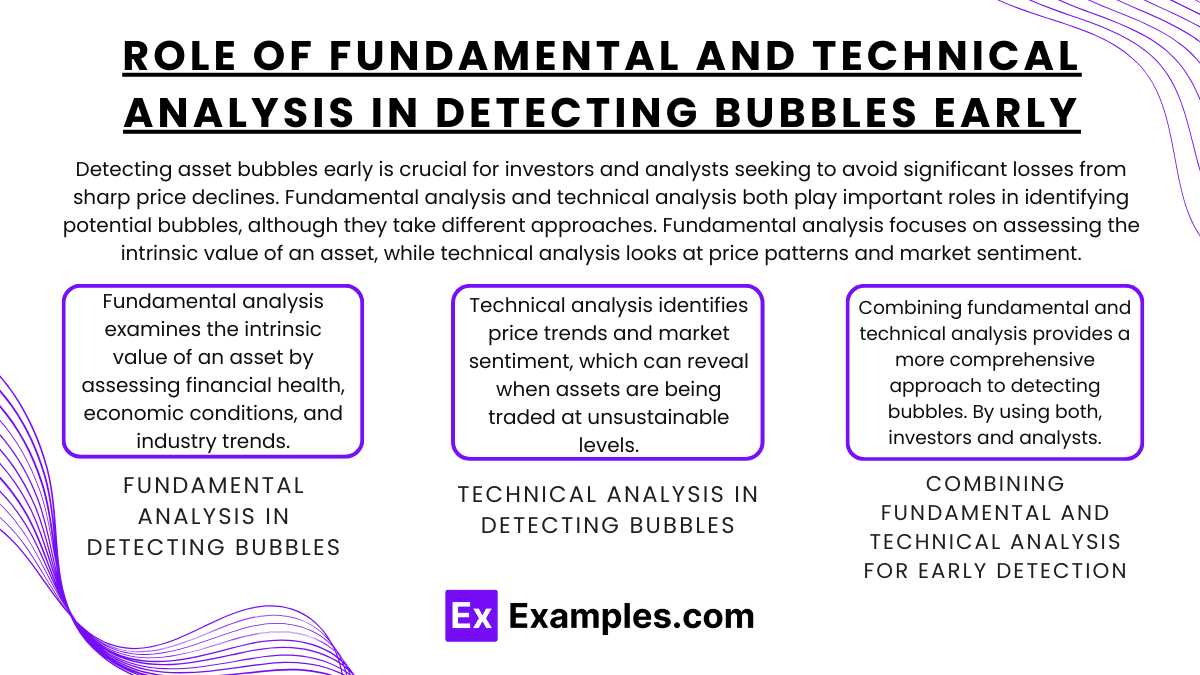
Detecting asset bubbles early is crucial for investors and analysts seeking to avoid significant losses from sharp price declines. Fundamental analysis and technical analysis both play important roles in identifying potential bubbles, although they take different approaches. Fundamental analysis focuses on assessing the intrinsic value of an asset, while technical analysis looks at price patterns and market sentiment. Together, these tools provide a comprehensive approach to recognizing when an asset may be overvalued and susceptible to a bubble.
1. Fundamental Analysis in Detecting Bubbles
Fundamental analysis examines the intrinsic value of an asset by assessing financial health, economic conditions, and industry trends. This approach can help identify bubbles by highlighting discrepancies between an asset’s market price and its actual value.
- Valuation Ratios: Ratios like the Price-to-Earnings (P/E), Price-to-Sales (P/S), and Price-to-Book (P/B) can indicate overvaluation. When these ratios are significantly higher than historical averages or industry norms, it suggests that asset prices may be unsustainably high. For example, a P/E ratio that far exceeds historical averages for a sector could signal that prices are inflated beyond fundamental value.
- Earnings and Revenue Growth: Fundamental analysis tracks earnings and revenue growth to see if it justifies rising asset prices. In a bubble, asset prices often rise faster than the growth in earnings or revenue, creating a disconnect between the asset’s price and its profitability. Persistent earnings shortfalls amid rising prices can be a red flag for a bubble.
- Interest Rates and Economic Indicators: Low interest rates and easy credit are often associated with bubbles, as they encourage excessive borrowing and risk-taking. Fundamental analysts monitor central bank policies, economic growth rates, and debt levels to assess whether low-interest-rate environments are artificially inflating asset values.
- Comparative Analysis with Historical Bubbles: Analyzing past bubbles (like the Dot-Com Bubble or the Housing Bubble) can provide benchmarks to assess current market conditions. For instance, high-tech stocks in the late 1990s were overvalued despite lacking consistent profits, a warning sign now used to evaluate new high-growth sectors.
Example: In the 2007-2008 housing bubble, fundamental analysis revealed that housing prices were far above historical norms relative to income levels, which suggested that prices were unsustainable. Rapid increases in home prices and reliance on subprime mortgages highlighted the risk of a bubble that eventually burst.
2. Technical Analysis in Detecting Bubbles
Technical analysis identifies price trends and market sentiment, which can reveal when assets are being traded at unsustainable levels. By examining historical price patterns and trading volume, technical analysis helps detect signs of exuberance or “irrational” buying, which often signal a bubble.
- Price Patterns and Chart Indicators: Indicators like parabolic price rises (a sharp, continuous price increase) often signal bubble-like conditions. Technical analysts look for price patterns that deviate significantly from historical norms, such as a rapid rise followed by periods of intense volatility, which can indicate that prices are climbing unsustainably.
- Momentum Indicators: Tools like the Relative Strength Index (RSI) and Moving Average Convergence Divergence (MACD) measure price momentum. An asset that shows consistently high RSI values or MACD divergence may indicate overbought conditions, suggesting that prices are being driven by speculation rather than fundamentals.
- Volume Analysis: During a bubble, trading volumes often increase as more investors buy into the asset, hoping to benefit from rising prices. A significant increase in volume, especially during upward price movements, can indicate that prices are driven more by speculation than by underlying value. Conversely, a sharp decrease in volume during a price increase might signal declining support, foreshadowing a potential correction.
- Sentiment Analysis and News Flow: Technical analysts monitor media sentiment and investor behavior for signs of “herding” or widespread optimism. News coverage often becomes overwhelmingly positive in a bubble, with frequent references to “new paradigms” or the idea that prices will keep rising. Increased search volumes and investor enthusiasm are indicators that prices may be rising due to sentiment rather than intrinsic value.
Example: The Bitcoin rally in late 2017 exhibited classic bubble signs, with RSI showing overbought conditions and trading volumes surging as more investors entered the market. As prices rose parabolically, technical indicators hinted at unsustainable levels, signaling a potential bubble.
3. Combining Fundamental and Technical Analysis for Early Detection
Combining fundamental and technical analysis provides a more comprehensive approach to detecting bubbles. By using both, investors and analysts can identify discrepancies between market prices and intrinsic values, while also observing the market behavior and sentiment that often accompany bubbles.
- Confirmation of Overvaluation: Fundamental analysis may reveal that asset prices are too high relative to intrinsic value, while technical analysis can confirm unsustainable price movements. For instance, if fundamental metrics indicate overvaluation and technical indicators show overbought conditions, there is a higher likelihood that a bubble is forming.
- Understanding Market Sentiment vs. Value: Fundamental analysis helps distinguish between value-driven and sentiment-driven price increases. Technical analysis, on the other hand, captures the sentiment and behavioral factors, like herd behavior, which often amplify bubbles. Recognizing both aspects enables a more nuanced assessment of whether prices are being driven by realistic expectations or speculative behavior.
- Risk Management and Timing: Technical analysis can help time an exit strategy by identifying early signs of weakening momentum or declining support, while fundamental analysis ensures that the decision to exit aligns with valuation metrics. This combination allows for more precise risk management, reducing potential losses when the bubble bursts.
Example: In the 2021 meme stock phenomenon, combining both analyses showed a clear bubble. Fundamental analysis indicated that companies like GameStop were overvalued, with stock prices far exceeding earnings potential. Simultaneously, technical analysis highlighted high RSI levels, trading volumes, and parabolic price rises driven by social media-fueled sentiment, signaling unsustainable levels.
Developing Strategies for Managing Risk and Protecting Investments During Bubbles
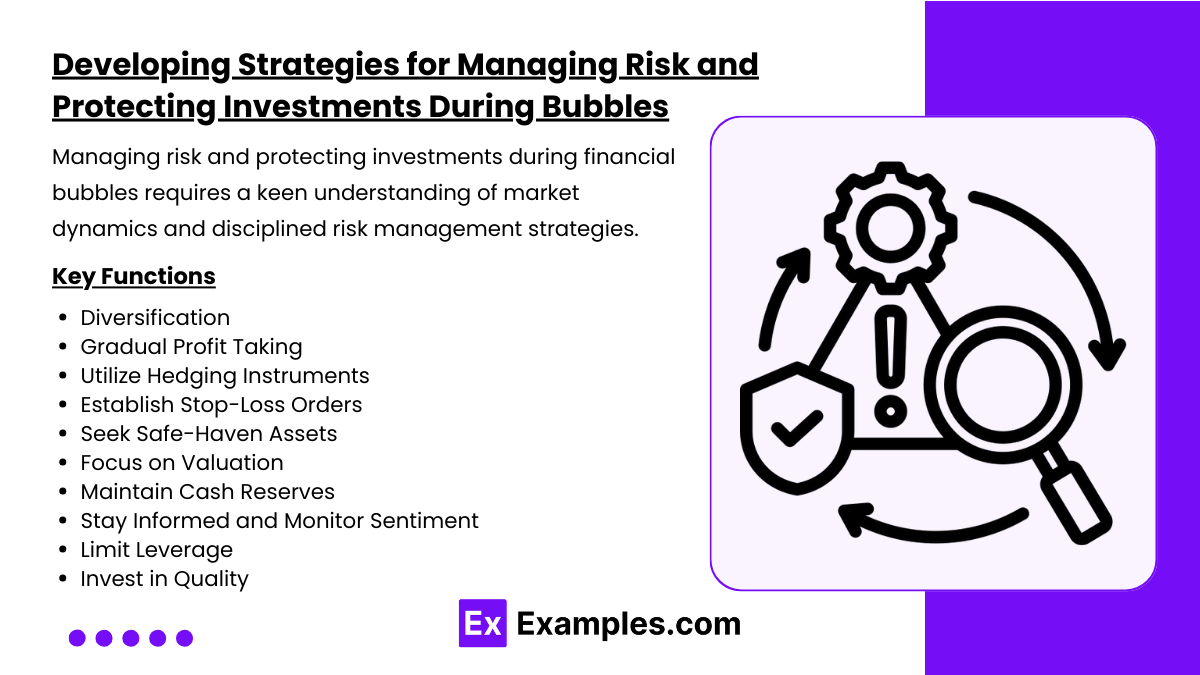
Managing risk and protecting investments during financial bubbles requires a keen understanding of market dynamics and disciplined risk management strategies. Here are some key strategies investors often use to navigate and protect assets during these volatile periods:
- Diversification: Allocate assets across a variety of investments to reduce risk exposure. By diversifying into different asset classes, such as stocks, bonds, real estate, and commodities, investors reduce the potential impact of a bubble in any single market.
- Gradual Profit Taking: As an asset class experiences rapid price increases, gradually take profits by selling portions of the investment. This approach, called “scaling out,” allows investors to lock in gains while maintaining some exposure if prices continue to rise.
- Utilize Hedging Instruments: Employ financial derivatives, such as options or futures, to protect against potential declines. For example, put options allow investors to sell a security at a set price, limiting losses if prices fall sharply.
- Establish Stop-Loss Orders: Setting automatic sell orders at predetermined price levels, called stop-losses, can protect portfolios from rapid declines. This strategy helps limit losses by ensuring that assets are sold once a price threshold is crossed.
- Seek Safe-Haven Assets: During bubble conditions, some investors shift a portion of their portfolios into safer assets, such as gold, government bonds, or cash. Safe-haven assets typically have low correlations with bubble-prone markets, providing stability in times of volatility.
- Focus on Valuation: Investment bubbles often involve assets trading far above intrinsic value. Focus on valuation metrics (like price-to-earnings or price-to-book ratios) to determine whether prices align with underlying fundamentals, avoiding overpriced assets.
- Maintain Cash Reserves: Keeping a portion of the portfolio in cash provides flexibility to capitalize on investment opportunities if prices correct. Cash reserves also reduce overall portfolio risk, as cash is a stable asset class in volatile markets.
- Stay Informed and Monitor Sentiment: Regularly assess market sentiment indicators, such as investor surveys, media coverage, and trading volumes, which can signal the maturity of a bubble. High levels of optimism and speculative trading often indicate bubble peaks.
- Limit Leverage: Reducing or avoiding leverage during bubble conditions is crucial, as borrowed funds can amplify losses if the market reverses. By minimizing debt, investors lower their risk exposure and reduce the potential for forced liquidation.
- Invest in Quality: Focus on high-quality assets with strong fundamentals, such as companies with robust cash flows, low debt, and a competitive advantage. Quality investments are often better positioned to withstand market downturns.
Examples
Example 1: Soap Bubbles
A soap bubble is a thin film of soapy water filled with air, creating a spherical shape due to surface tension. The surface tension of the soap film pulls the water molecules together, forming a bubble that traps air inside. The bubble’s structure consists of three layers: an outer and inner soap film with a thin layer of water between them. This balance of forces keeps the bubble intact as long as the surface tension is strong enough.
Example 2: Economic Bubbles
In the context of finance, an economic bubble occurs when asset prices are driven far beyond their intrinsic value, often due to speculative behavior. For example, during the housing bubble of the mid-2000s, real estate prices were inflated by excessive demand and loose lending practices. The “anatomy” of this bubble includes unsustainable price increases, speculation, and eventual collapse when the market corrects itself, causing the bubble to “burst.”
Example 3: Gas Bubbles in Water
When gas is introduced into water, such as when carbon dioxide is dissolved in soda, bubbles form as the gas tries to escape. The anatomy of these gas bubbles involves a thin film of liquid that contains gas. The pressure inside the bubble is higher than the surrounding liquid, causing the bubble to rise and eventually pop when the pressure is balanced, or the film breaks.
Example 4: Bubbles in Lava
As magma rises to the Earth’s surface, gas trapped within the molten rock forms bubbles. These gas bubbles, primarily consisting of water vapor, carbon dioxide, and other gases, can expand as the pressure decreases upon reaching the surface. The anatomy of a volcanic bubble involves a gas-rich core surrounded by molten lava, and when these bubbles burst, they can contribute to explosive volcanic eruptions, often resulting in ash and lava fountains.
Example 5: Bubble Wrap
Bubble wrap is a popular packaging material made of small, air-filled bubbles. Each bubble is made of two layers of plastic film and a thin layer of trapped air. The anatomy of a bubble wrap bubble includes the flexible outer layer, which absorbs pressure, and the air inside, which provides cushioning. When the bubble is popped, the air escapes, and the plastic layers collapse, demonstrating the simple mechanical principles behind the structure of these bubbles.
Practice Questions
Question 1
What is the primary force that keeps a soap bubble intact?
A) Gravity
B) Surface tension
C) Air pressure
D) Viscosity
Correct Answer: B) Surface tension.
Explanation: The primary force that keeps a soap bubble intact is surface tension, which acts to minimize the surface area of the liquid film. This force pulls the water molecules together, forming a thin layer that traps air inside. Gravity, air pressure, and viscosity are also involved but are secondary to surface tension in maintaining the bubble’s structure.
Question 2
Why do bubbles in a carbonated beverage rise to the surface?
A) Because they are lighter than the liquid
B) Because they are filled with air
C) Because of surface tension
D) Because of heat expansion
Correct Answer: A) Because they are lighter than the liquid.
Explanation: Bubbles in a carbonated beverage rise to the surface because the gas inside them (such as carbon dioxide) is less dense than the liquid. The difference in density causes the bubbles to float and rise to the surface. While surface tension helps maintain the shape of the bubble, buoyancy due to density differences is the main reason for the rise.
Question 3
What happens when the gas pressure inside a bubble becomes greater than the surrounding liquid pressure?
A) The bubble shrinks.
B) The bubble grows.
C) The bubble bursts.
D) The bubble maintains its size.
Correct Answer: C) The bubble bursts.
Explanation: When the gas pressure inside a bubble becomes greater than the surrounding liquid pressure, the bubble can no longer maintain its shape and bursts. This is because the pressure imbalance causes the thin film of liquid that forms the bubble to break. The result is the release of the trapped gas and the collapse of the bubble.

