Preparing for the CMT Exam requires a deep understanding of “The Anatomy of Elliott Wave Trading,” a key concept in technical analysis. Mastery of wave patterns, their predictive power, and trading applications is essential. This knowledge facilitates precise market forecasts and effective trading strategies, critical for excelling on the CMT.
Learning Objective
In studying “The Anatomy of Elliott Wave Trading” for the CMT Exam, you should aim to understand the core principles and patterns of the Elliott Wave Theory. Analyze how these patterns can predict market trends and reversals. Evaluate the significance of motive and corrective waves in analyzing market psychology and trader behavior. Additionally, explore the application of Fibonacci retracement levels to enhance wave analysis accuracy. Apply your knowledge to identify trading opportunities and mitigate risks by interpreting wave structures and forecasting market movements in practical trading scenarios, thereby strengthening your analytical skills for the CMT Exam.
Introduction to Elliott Wave Theory
Elliott Wave Theory is a form of technical analysis that finance professionals use to analyze financial market cycles and forecast market trends by identifying extremes in investor psychology, highs, and lows in prices, and other collective factors. Here’s a concise introduction to this influential theory:
Origin and Development
Developed in the 1930s by Ralph Nelson Elliott, after observing and identifying recurring fractal wave patterns. Elliott proposed that market prices unfold in specific patterns, which practitioners today call “Elliott Waves.”
Core Concepts
- Wave Structure: Elliott Wave Theory posits that market prices move in repetitive patterns, called “waves.” These waves are divided into two main types:
- Impulse Waves: These are waves that move in the direction of the underlying trend and are structured in a five-wave sequence (labeled as 1, 2, 3, 4, 5).
- Corrective Waves: These waves move against the trend and typically consist of a three-wave structure (labeled as A, B, C).
- Fractality: The waves are inherently fractal; each wave can be broken down into smaller waves that resemble the overall structure of larger waves.
- Fibonacci Sequence: Elliott discovered that the ratios of wave lengths typically align with Fibonacci numbers, which are used to calculate retracements and projections within the markets.
Core Patterns in Elliott Wave Theory
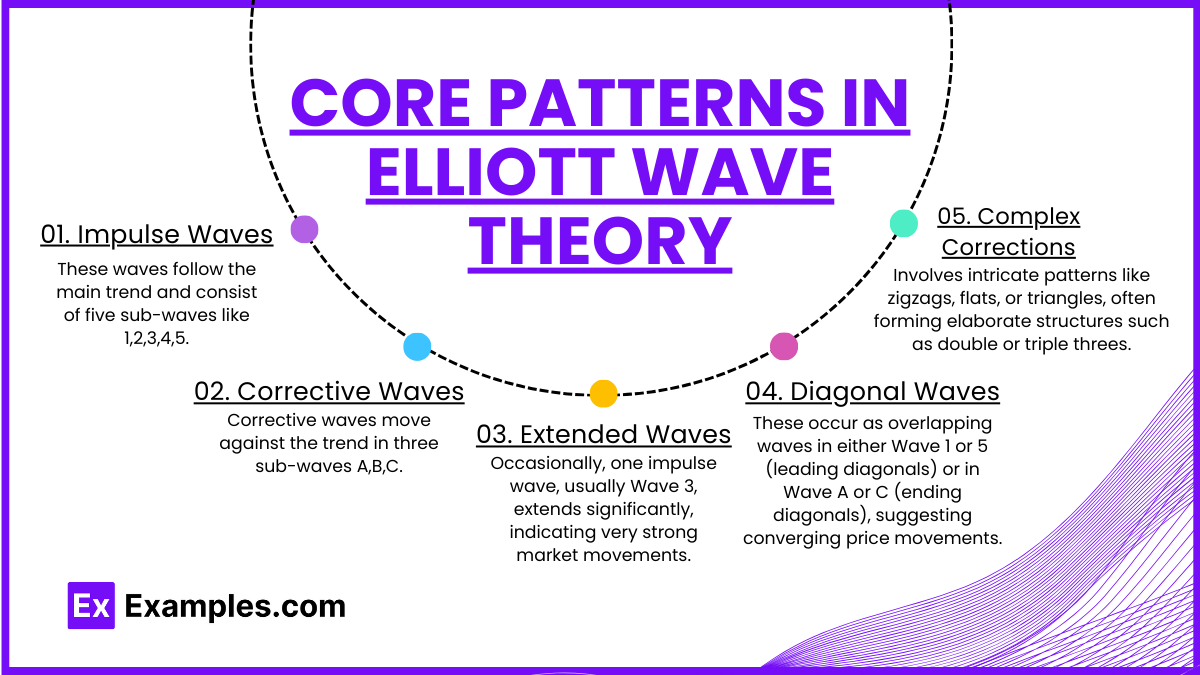
Elliott Wave Theory revolves around a complex system of price movements characterized by repetitive wave patterns. Understanding these core patterns is crucial for effectively applying the theory in market analysis. Here are the fundamental patterns in Elliott Wave Theory:
1. Impulse Waves
These waves follow the main trend and consist of five sub-waves:
- Wave 1: Begins the movement.
- Wave 2: Retraces but does not surpass the start of Wave 1.
- Wave 3: Typically the longest and strongest, cannot be the shortest.
- Wave 4: Does not overlap with Wave 1.
- Wave 5: Ends the trend movement, often shows exhaustion.
2. Corrective Waves
Corrective waves move against the trend in three sub-waves:
- Wave A: Moves against the impulse.
- Wave B: Partially retraces Wave A.
- Wave C: Extends beyond Wave A, completing the correction.
3. Extended Waves
Occasionally, one impulse wave, usually Wave 3, extends significantly, indicating very strong market movements.
4. Diagonal Waves
These occur as overlapping waves in either Wave 1 or 5 (leading diagonals) or in Wave A or C (ending diagonals), suggesting converging price movements.
5. Complex Corrections
Involves intricate patterns like zigzags, flats, or triangles, often forming elaborate structures such as double or triple threes.
Fibonacci Relationships in Wave Patterns
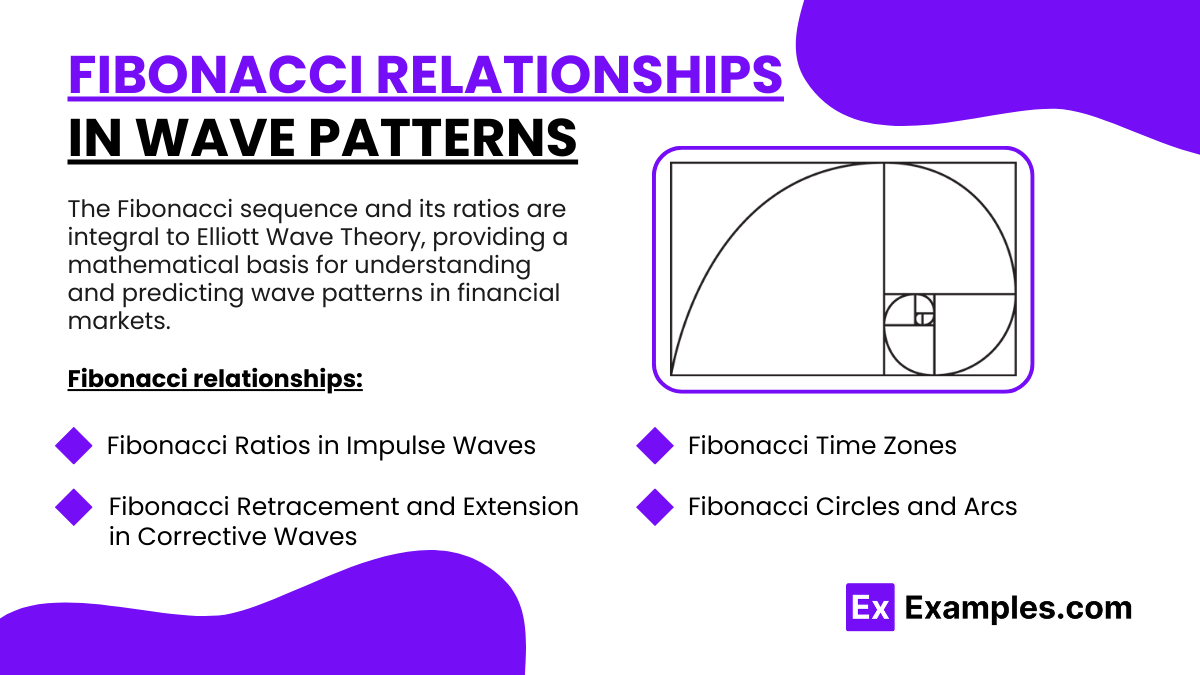
The Fibonacci sequence and its ratios are integral to Elliott Wave Theory, providing a mathematical basis for understanding and predicting wave patterns in financial markets. Here’s how Fibonacci relationships are applied in wave patterns:
1. Fibonacci Ratios in Impulse Waves
In impulse waves, certain Fibonacci ratios frequently appear between the waves, providing potential reversal points and targets:
- Wave 2 often retraces to 61.8% of Wave 1.
- Wave 3 is typically the longest and can extend to 161.8% or even 261.8% of Wave 1.
- Wave 4 commonly retraces to 38.2% of Wave 3.
- Wave 5 can extend to 61.8% or 100% of the distance from the start of Wave 1 to the end of Wave 3.
2. Fibonacci Retracement and Extension in Corrective Waves
Corrective waves also show clear Fibonacci relationships, which help to identify potential end points for corrections:
- Wave A and C in zigzag corrections are often related by a Fibonacci ratio, where Wave C can extend to 100% or 161.8% of Wave A.
- In flat corrections, Wave B usually retraces a significant portion (often 61.8% or 78.6%) of Wave A, and Wave C typically ends around the same level as Wave A.
3. Fibonacci Time Zones
Elliott Wave practitioners also use Fibonacci numbers to predict the timing of waves. By counting the number of bars between significant highs and lows, analysts apply Fibonacci numbers to forecast when the next significant change in price might occur.
4. Fibonacci Circles and Arcs
These are used to gauge support and resistance levels in different waves, particularly in complex corrective phases. They help in identifying potential reversal zones by measuring distances in price and projecting them over time.
Advanced Wave Counting Techniques
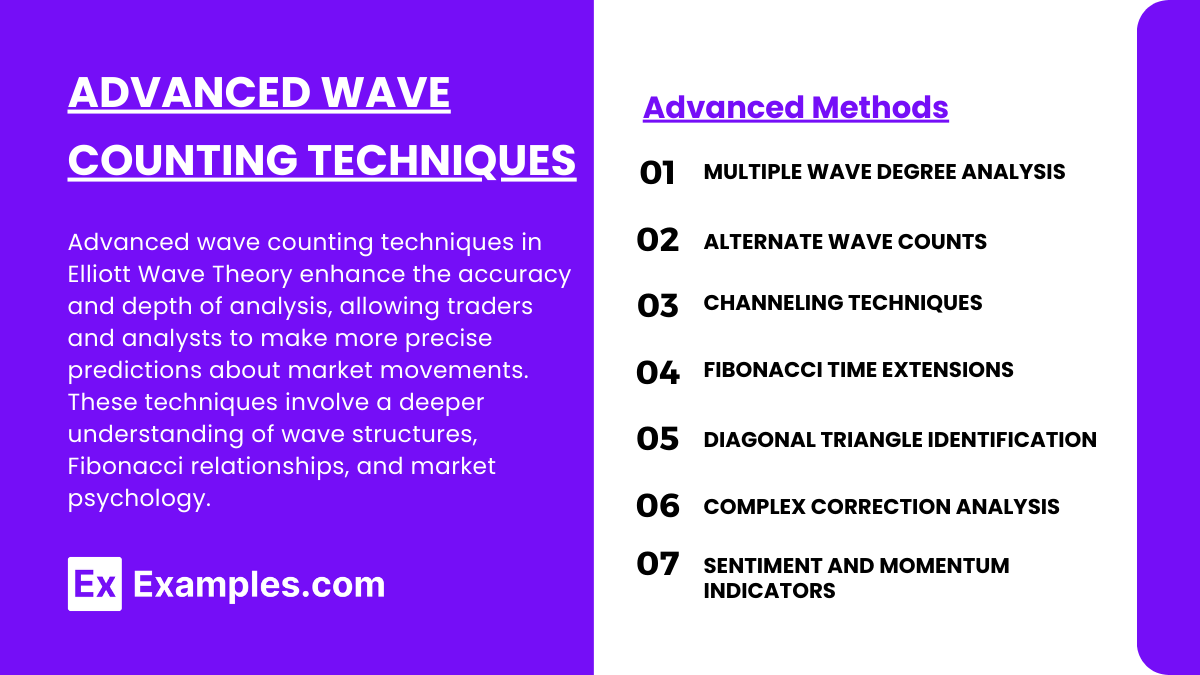
Advanced wave counting techniques in Elliott Wave Theory enhance the accuracy and depth of analysis, allowing traders and analysts to make more precise predictions about market movements. These techniques involve a deeper understanding of wave structures, Fibonacci relationships, and market psychology. Here’s a closer look at some of these advanced methods:
1. Multiple Wave Degree Analysis
Analyzing waves across different time frames helps identify both short-term and long-term market trends, offering a layered perspective on market dynamics.
2. Alternate Wave Counts
Developing primary and alternative scenarios based on different interpretations of wave patterns allows for flexible responses to unexpected market changes.
3. Channeling Techniques
Drawing trend channels helps determine potential support and resistance levels, guiding predictions about where and when waves might conclude.
4. Fibonacci Time Extensions
Using Fibonacci time ratios to estimate the duration of waves enhances predictions about when current or upcoming waves might end.
5. Diagonal Triangle Identification
Identifying diagonal triangles in Wave 5 of impulses or Wave C of corrections can signal the end of a pattern and potential market reversals.
6. Complex Correction Analysis
Recognizing and analyzing complex corrections allows for better forecasting of corrective market phases and their potential impacts.
7. Sentiment and Momentum Indicators
Integrating wave counts with indicators like RSI and MACD confirms or challenges the validity of the analysis, ensuring more reliable predictions.
Examples
Examples 1: 2007-2009 Global Financial Crisis
- Analysis of the global financial markets during the crisis using Elliott Wave Theory to identify the impulse waves that signaled the beginning of the crisis and the corrective waves that followed, providing insights into market recovery phases.
Examples 2: Gold Price Rally of 2011
- Examination of the gold market during its significant price rally in 2011, applying Elliott Wave patterns to discern the motive phases and their subsequential corrections. This example demonstrates how traders could use wave counts to forecast the peak and subsequent declines.
Examples 3: Tech Stock Surge in 2020
- Application of Elliott Wave Theory to the sharp rise in technology stocks during the COVID-19 pandemic, analyzing impulse waves and their corrections to predict future movements and investment strategies during highly volatile periods.
Examples 4: Cryptocurrency Boom and Bust
- Analyzing the rapid rise and sudden crashes of cryptocurrencies like Bitcoin, using Elliott Wave patterns to understand the market dynamics, investor sentiment, and potential turning points for both bullish and bearish trends.
Examples 5: Forex Market Fluctuations
- Detailed case study of major currency pairs, such as EUR/USD or USD/JPY, over a specific period to apply Elliott Wave analysis. This includes identifying longer-term wave cycles and shorter corrective patterns to inform trading strategies and risk management.
Practice Questions
Question 1
Which type of wave is typically seen as the strongest and most clear-cut part of a market trend in Elliott Wave Theory?
A. First wave
B. Second wave
C. Third wave
D. Fifth wave
Answer:
C. Third wave
Explanation:
In Elliott Wave Theory, the third wave is often the strongest and most straightforward phase of the market trend. It usually extends well beyond the initial wave, making it a significant indicator of the trend’s overall direction and strength.
Question 2
What pattern is characterized by three main movements – two in the direction of the trend and one against it?
A. Zigzag
B. Flat
C. Triangle
D. Impulse
Answer:
D. Impulse
Explanation:
The impulse pattern in Elliott Wave Theory consists of five waves, with three waves (1, 3, and 5) moving in the direction of the overall trend and two waves (2 and 4) moving against it. This question focuses on the key characteristics of an impulse wave, emphasizing its role in reinforcing the prevailing trend.
Question 3
Which Fibonacci retracement level is not commonly associated with Elliott Wave corrective phases?
A. 23.6%
B. 38.2%
C. 50%
D. 78.6%
Answer:
A. 23.6%
Explanation:
In Elliott Wave Theory, the more significant Fibonacci retracement levels considered during corrective phases are 38.2%, 50%, and 61.8%. The 23.6% level is often too shallow to be considered significant in the context of most corrective waves, which typically retrace a larger portion of the previous impulse wave.

