Preparing for the CMT Exam requires a comprehensive understanding of “The Scientific Method and Technical Analysis,” a crucial component of technical market analysis. Mastery of empirical testing, hypothesis development, and statistical validation is essential. This knowledge provides insights into market behaviors and trading patterns, critical for achieving a high CMT score.
Learning Objective
In studying “The Scientific Method and Technical Analysis” for the CMT Exam, you should learn to understand the application of scientific principles to market analysis. Analyze how hypothesis testing, data collection, and empirical validation are used to evaluate the effectiveness of technical indicators and trading systems. Evaluate the importance of developing testable hypotheses and utilizing statistical tools to assess the reliability of technical patterns and signals. Additionally, explore how these methodologies can be systematically applied to enhance trading strategies through backtesting and forward testing. Apply this knowledge to real-world scenarios to interpret market movements and improve decision-making in trading activities.
Introduction to the Scientific Method in Technical Analysis
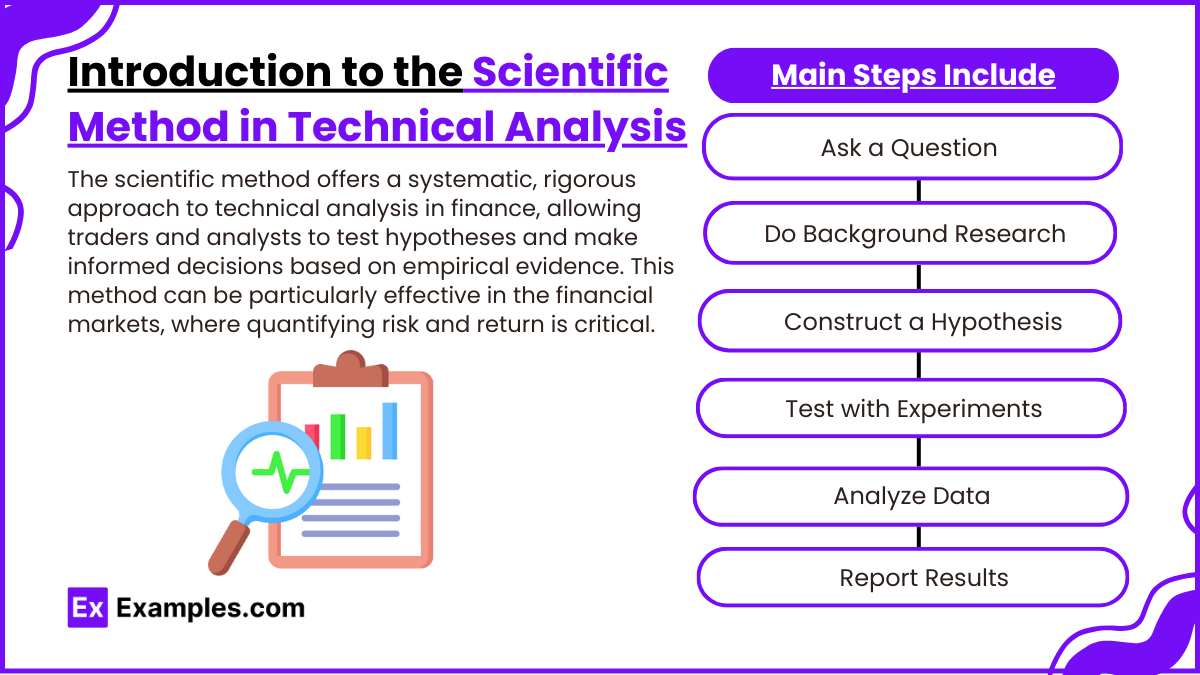
The scientific method offers a systematic, rigorous approach to technical analysis in finance, allowing traders and analysts to test hypotheses and make informed decisions based on empirical evidence. This method can be particularly effective in the financial markets, where quantifying risk and return is critical.The main steps include:
- Ask a Question: Start with a specific financial question or problem. For instance, does a particular technical indicator (like moving averages) predict future price movements effectively?
- Do Background Research: Gather information and observe existing theories and literature on the subject. Understanding historical context and previous analyses helps form a more rounded hypothesis.
- Construct a Hypothesis: Formulate a hypothesis that offers a potential answer to the question, based on the initial research. This hypothesis should be testable and clearly state expected outcomes.
- Test with Experiments: Apply the hypothesis to historical market data using technical analysis tools. This testing should be structured and repeatable to ensure reliability.
- Analyze Data and Draw Conclusions: Examine the results of the experiment. Does the data support or reject the hypothesis? It’s important to use statistical methods to validate the findings and ensure that they are not the result of chance.
- Report Results: Share findings with others. This could be through trading reports, academic papers, or investment blogs. Transparency in methodology and findings helps the broader community evaluate and build on your work.
Formulating Hypotheses in Market Analysis
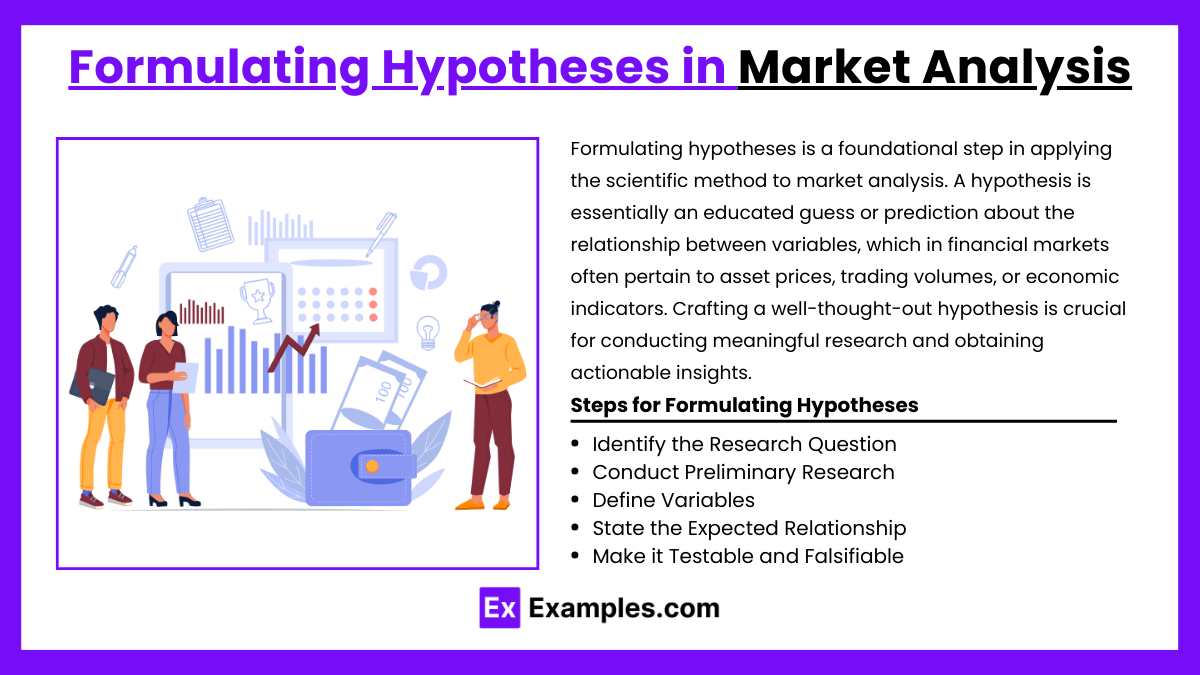
Formulating hypotheses is a foundational step in applying the scientific method to market analysis. A hypothesis is essentially an educated guess or prediction about the relationship between variables, which in financial markets often pertain to asset prices, trading volumes, or economic indicators. Crafting a well-thought-out hypothesis is crucial for conducting meaningful research and obtaining actionable insights. Here’s a guide on how to effectively formulate hypotheses in market analysis:
Steps for Formulating Hypotheses in Market Analysis
- Identify the Research Question: Start with a specific question that you want to answer. For instance, you might wonder whether certain macroeconomic announcements (like interest rate changes) have a predictable effect on stock prices.
- Conduct Preliminary Research: Before formulating your hypothesis, gather background information. Look at existing research, theories, and data related to your question. This can help shape your thinking and refine the focus of your hypothesis.
- Define Variables: Clearly define the variables you will analyze. In the example of interest rates and stock prices, the independent variable could be the interest rate changes, and the dependent variable could be the movement in stock prices.
- State the Expected Relationship: Articulate what you expect to happen between these variables. For example, you might hypothesize that increases in interest rates typically lead to declines in stock prices due to higher borrowing costs impacting corporate profits.
- Make it Testable and Falsifiable: Ensure that your hypothesis can be tested with available methods and data. Also, it should be possible to prove it false. For instance, you could test the hypothesis by examining stock market reactions to historical interest rate changes.
Data Collection and Testing
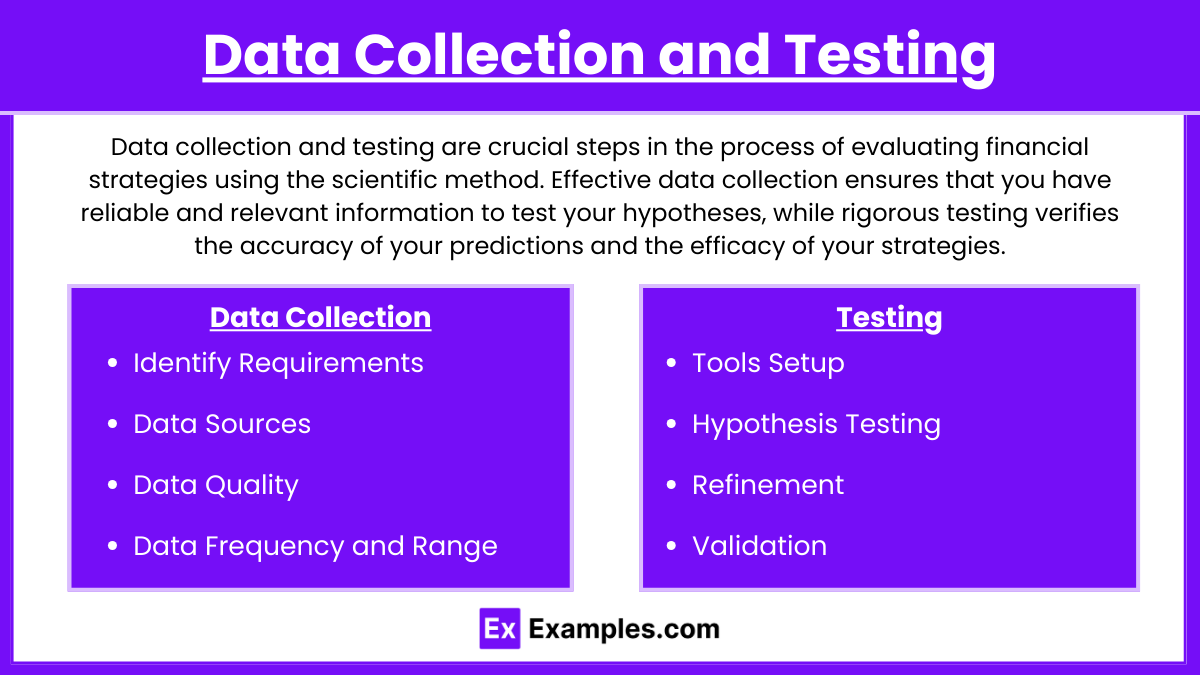
Data collection and testing are crucial steps in the process of evaluating financial strategies using the scientific method. Effective data collection ensures that you have reliable and relevant information to test your hypotheses, while rigorous testing verifies the accuracy of your predictions and the efficacy of your strategies. Here’s a guide on how to approach data collection and testing in financial markets:
Data Collection
- Identify Requirements: Determine the types of data needed to test your hypothesis, such as price, volume, or economic indicators.
- Data Sources:
- Primary Sources: Directly from exchanges, economic reports.
- Secondary Sources: Databases, historical records from services like Bloomberg or Reuters.
- Data Quality:
- Cleaning: Remove errors or irrelevant data points.
- Normalizing: Adjust for factors like stock splits to ensure data integrity.
- Data Frequency and Range: Match the data frequency with your strategy (e.g., intraday, daily) and ensure sufficient historical coverage for significant results.
Testing
- Tools Setup: Use software or languages like Python or R with financial libraries for backtesting.
- Hypothesis Testing:
- Statistical Tests: Apply relevant statistical tests such as t-tests or regression analysis.
- Performance Metrics: Evaluate using metrics like Sharpe Ratio, Maximum Drawdown.
- Refinement:
- Parameter Tuning: Optimize strategy parameters based on test results.
- Robustness Checking: Test the strategy under various scenarios to ensure stability.
- Validation:
- Out-of-Sample Testing: Test with a fresh dataset to prevent overfitting.
- Forward Testing: Simulate real-time strategy execution without actual trades.
Statistical Tools in Technical Analysis
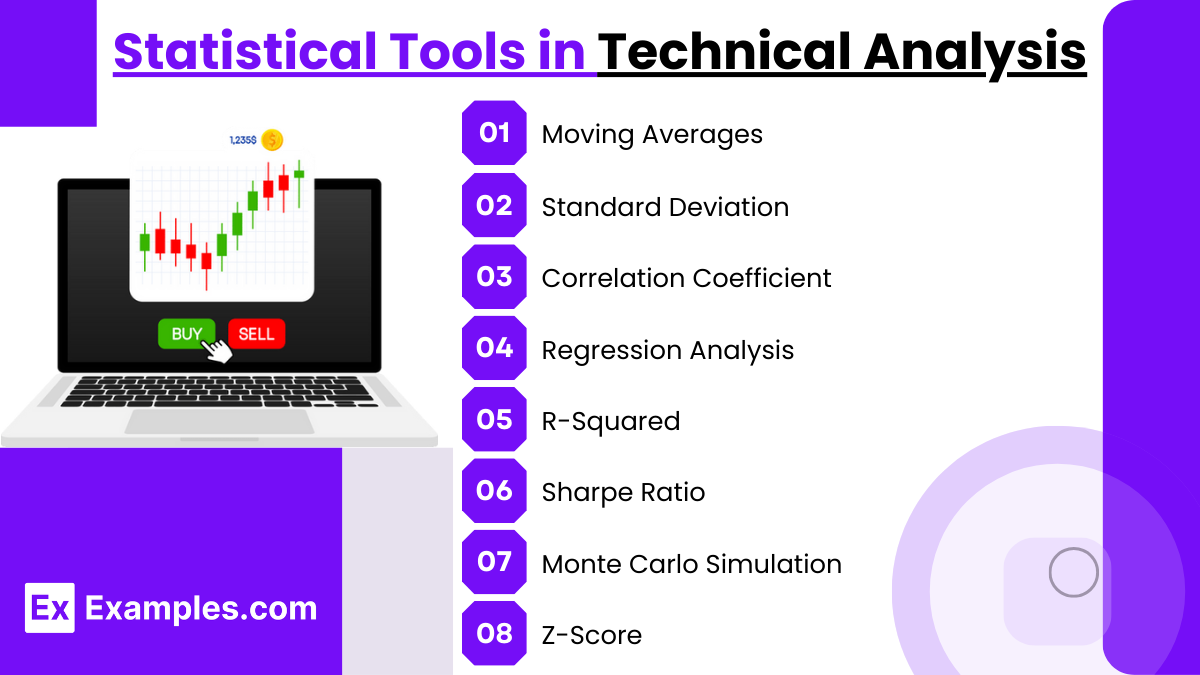
Statistical tools are integral to technical analysis in financial markets, providing a rigorous basis for testing trading hypotheses and analyzing market trends. These tools help quantify relationships, predict market movements, and assess the effectiveness of trading strategies. Here’s an overview of some key statistical tools commonly used in technical analysis:
- Moving Averages
- Purpose: Smooths price data to identify trends.
- Types: Simple Moving Average (SMA) and Exponential Moving Average (EMA).
- Standard Deviation
- Purpose: Measures price volatility.
- Application: Forms the basis for Bollinger Bands, which adjust to market volatility.
- Correlation Coefficient
- Purpose: Measures the linear relationship between two variables.
- Application: Assists in portfolio diversification and pair trading strategies.
- Regression Analysis
- Purpose: Identifies relationships between variables.
- Types: Linear regression for continuous outcomes and logistic regression for binary outcomes.
- R-Squared (Coefficient of Determination)
- Purpose: Indicates the percentage of the variance in the dependent variable explained by the independent variables.
- Application: Evaluates the predictiveness of a model.
- Sharpe Ratio
- Purpose: Assesses risk-adjusted performance.
- Application: Compares the efficiency of different trading strategies or managers.
- Monte Carlo Simulation
- Purpose: Estimates potential outcomes by random sampling.
- Application: Predicts possible price movements under uncertain conditions.
- Z-Score
- Purpose: Indicates how far a data point is from the mean in terms of standard deviations.
- Application: Identifies unusual price movements based on historical performance.
Examples
Example 1: Backtesting Moving Averages
Testing the hypothesis that a 50-day moving average crossover of a 200-day moving average signals a strong buy opportunity. Historical price data of various stocks are used to backtest this theory, analyzing instances of crossovers and their subsequent market performance to determine the strategy’s effectiveness and reliability.
Example 2: Volume as a Confirmatory Indicator
Formulating a hypothesis that increases in volume on days when the stock closes higher than the previous day signal a strong upward trend. By collecting and analyzing historical volume and price data, a technician can validate whether increased volume correlates positively with continued price increases, using statistical tools like correlation coefficients.
Example 3: Testing RSI Divergence
Hypothesizing that a divergence between the Relative Strength Index (RSI) and price indicates an impending reversal. This hypothesis is tested by examining historical instances where the RSI moves in the opposite direction to price and tracking whether these occurrences consistently precede market reversals.
Example 4: Evaluating Fibonacci Retracements
Testing the effectiveness of Fibonacci retracement levels as support and resistance in a trending market. A dataset of trending stocks is analyzed to determine how often prices reverse after reaching key Fibonacci levels, providing empirical support for or against the use of these levels in trading strategies.
Example 5: Seasonality in Commodity Prices
Developing a hypothesis that commodity prices (e.g., natural gas) show seasonal patterns which can be exploited for trading. Historical price data across several years is analyzed to identify recurring seasonal trends and their predictability, using statistical analysis to confirm or reject the hypothesis of seasonality.
Practice Questions
Question 1
What is the primary benefit of applying the scientific method to technical analysis?
A. To guarantee profits from trading activities
B. To eliminate all risks associated with trading
C. To provide a systematic approach to testing hypotheses
D. To fully automate the trading process
Answer:
C. To provide a systematic approach to testing hypotheses
Explanation:
The primary benefit of applying the scientific method in technical analysis is to offer a structured and systematic approach to formulating and testing hypotheses about market behavior. This method helps in objectively evaluating the effectiveness of trading strategies and technical indicators, ensuring that conclusions are based on empirical evidence rather than subjective interpretations.
Question 2
Which step is crucial when applying the scientific method in technical analysis?
A. Choosing financial instruments with the highest volatility
B. Ensuring results are statistically significant
C. Only using data from bull markets
D. Selecting the most complex algorithms
Answer:
B. Ensuring results are statistically significant
Explanation:
A crucial step in applying the scientific method to technical analysis is ensuring that the results of hypothesis testing are statistically significant. This significance indicates that the observed effects are likely not due to random chance but rather due to the hypothesized relationship, thus providing more confidence in the strategy or theory being tested.
Question 3
What is an ethical practice when backtesting a trading strategy using the scientific method?
A. Manipulating the data to fit the desired outcome
B. Testing the strategy on multiple independent datasets
C. Ignoring outlier results to streamline presentation
D. Using only proprietary data to avoid external scrutiny
Answer:
B. Testing the strategy on multiple independent datasets
Explanation:
An ethical practice in backtesting trading strategies using the scientific method is to test the strategy across multiple independent datasets. This practice avoids overfitting to a specific dataset and helps ensure that the strategy is robust across different market conditions and scenarios. It aligns with ethical guidelines that promote transparency, honesty, and integrity in the development and validation of trading models.

