The VIX, often referred to as the “fear gauge,” is a crucial indicator in assessing stock market sentiment and volatility expectations. This topic explores how the VIX is derived from options prices on the S&P 500 and reflects the market’s anticipation of future volatility. Understanding the VIX’s relationship with investor behavior and market cycles is essential for interpreting shifts in market sentiment. Technical analysts use the VIX to gauge potential turning points and market stress, making it a valuable tool for timing and risk management in trading and investment strategies.
Learning Objectives
In studying “The VIX as a Stock Market Indicator” for the CMT, you should learn to understand the VIX, or Volatility Index, as a measure of market expectations of volatility. Recognize how the VIX is calculated based on the implied volatility of S&P 500 index options and why it is often referred to as the “fear gauge.” Analyze the relationship between the VIX and investor sentiment, with higher values indicating increased market uncertainty or fear. Evaluate the VIX’s role in market timing and as a contrarian indicator, understanding how traders use it to identify potential reversals or continuation patterns in the stock market. Additionally, gain proficiency in interpreting VIX trends alongside other technical indicators to assess market conditions and support trading strategies.
Understanding the VIX (Volatility Index)
The VIX, or Volatility Index, measures market expectations of volatility over the next 30 days based on the price of options on the S&P 500 Index. Known as the “fear gauge” of the market, it reflects investor sentiment about future price fluctuations—rising when investors expect higher volatility and falling when they anticipate lower volatility.
Key Points about the VIX:
- What the VIX Measures: The VIX indicates the level of implied volatility in the stock market, not the direction. A high VIX signals that investors expect large price swings, while a low VIX suggests that they anticipate a more stable market.
- How the VIX is Calculated: The VIX is derived from the prices of near-term S&P 500 options, including both calls and puts. These options are weighted to create an estimate of how much the S&P 500 is expected to move. Essentially, it reflects the premium investors are willing to pay for options to protect against anticipated moves.
- Interpreting VIX Levels:
- Low VIX (Below 15): Indicates confidence and low expected volatility, often associated with stable markets or bull markets.
- Moderate VIX (15-30): Suggests moderate uncertainty, potentially due to events or economic data releases.
- High VIX (Above 30): Implies significant fear and uncertainty, often linked to market downturns, economic crises, or geopolitical events.
- Historical Trends in the VIX: Historically, the VIX spikes during market crises, such as:
- 2008 Financial Crisis: The VIX exceeded 80 due to extreme economic uncertainty.
- COVID-19 Pandemic (March 2020): The VIX again rose above 80 as the pandemic triggered global market instability.
- Uses of the VIX
- Investor Sentiment: Investors use the VIX as a gauge of market sentiment—high VIX levels indicate fear, while low levels signal calmness.
- Risk Management: Investors can use the VIX to guide portfolio adjustments, increasing hedging in high-volatility periods or reducing exposure to volatile assets.
- Trading Opportunities: VIX futures and ETFs allow investors to trade based on volatility expectations, though these instruments often involve high risks.
The VIX as the “Fear Gauge”
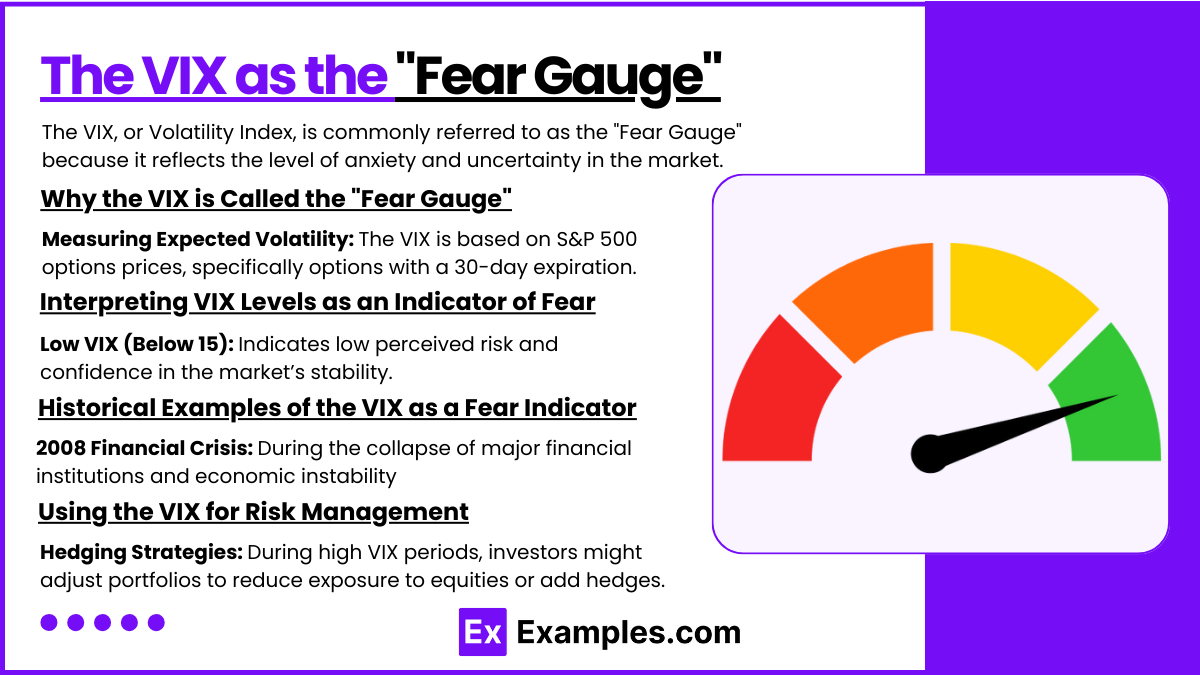
The VIX, or Volatility Index, is commonly referred to as the “Fear Gauge” because it reflects the level of anxiety and uncertainty in the market. This term stems from the VIX’s tendency to spike during times of market stress, signaling heightened fear and risk aversion among investors. Here’s a closer look at why the VIX is considered the market’s “Fear Gauge,” its implications, and how it can be used in risk management:
1. Why the VIX is Called the “Fear Gauge”
- Measuring Expected Volatility: The VIX is based on S&P 500 options prices, specifically options with a 30-day expiration. Since options prices increase when traders expect larger price swings, a high VIX indicates that investors anticipate significant volatility, often due to potential market declines.
- Reflection of Investor Sentiment: When investors are worried about economic, political, or market risks, they often buy options as a hedge against potential losses. The increased demand for options raises their prices, and consequently, the VIX value rises. This rise represents increased “fear” or concern about the market’s near-term outlook.
2. Interpreting VIX Levels as an Indicator of Fear
- Low VIX (Below 15): Indicates low perceived risk and confidence in the market’s stability. During these periods, investors are generally calm, suggesting lower demand for protective options.
- Moderate VIX (15-30): Reflects moderate levels of concern, which may be due to upcoming economic data, earnings announcements, or geopolitical events.
- High VIX (Above 30): Signifies high anxiety or fear. Such levels are often seen during financial crises, economic downturns, or unexpected global events, suggesting that investors are bracing for substantial market turbulence.
3. Historical Examples of the VIX as a Fear Indicator
- 2008 Financial Crisis: During the collapse of major financial institutions and economic instability, the VIX surged above 80, reflecting extreme panic and fear as investors anticipated severe market disruptions.
- COVID-19 Pandemic (March 2020): The VIX again spiked above 80 as global lockdowns and economic uncertainty caused a sharp stock market sell-off. The high VIX levels reflected investors’ fears over the pandemic’s impact on the global economy.
- Other Events: Other examples include the 2011 European debt crisis, 2016 Brexit vote, and trade tensions in recent years. Each of these events led to noticeable spikes in the VIX, reflecting increased market uncertainty.
4. Using the VIX for Risk Management
- Hedging Strategies: During high VIX periods, investors might adjust portfolios to reduce exposure to equities or add hedges, such as put options, to protect against expected market declines.
- Market Timing: Some investors use extreme VIX readings as contrarian signals. For instance, a very high VIX can indicate panic selling, potentially presenting a buying opportunity. Conversely, a very low VIX may indicate complacency, which can precede a market correction.
- Portfolio Diversification: When the VIX rises, investors may increase their allocation to less volatile assets, such as bonds or safe-haven assets like gold, to balance overall portfolio risk.
Relationship Between the VIX and Investor Sentiment
The VIX (Volatility Index) has a close relationship with investor sentiment, acting as a barometer for market mood and risk appetite. This relationship stems from the fact that the VIX measures expected volatility based on options prices for the S&P 500. Here’s a detailed look at how the VIX reflects investor sentiment, its use as an indicator of fear and complacency, and the implications for markets:
VIX (Volatility Index)
The VIX, or Volatility Index, is a measure of the expected volatility in the S&P 500 over the next 30 days. Managed by the Chicago Board Options Exchange (CBOE), the VIX is derived from the price of options on the S&P 500. When options prices rise, the VIX also rises, reflecting investors’ expectations for larger-than-usual price swings in the near future.
- High VIX: When the VIX is high, it signals that investors are expecting increased volatility. This typically occurs in times of market uncertainty, economic crises, or unexpected events, suggesting that investors are preparing for sharp market movements.
- Low VIX: A low VIX indicates a stable market with low anticipated volatility. In these periods, investors are generally calm, confident, and less inclined to seek protective measures.
- Short-Term Focus: The VIX reflects expected volatility over the next month, making it a short-term indicator. It does not predict the direction of the market; rather, it only measures the magnitude of expected changes.
The VIX is commonly known as the “Fear Gauge” because it tends to rise when there is widespread concern about future market performance, capturing investors’ desire to hedge against potential declines.
Investor Sentiment
Investor sentiment reflects the overall mood, outlook, and emotions of investors regarding the financial markets. It is shaped by factors like economic data, corporate earnings, geopolitical events, and market trends. Investor sentiment can be bullish, neutral, or bearish, and it plays a significant role in influencing market dynamics and trading behaviors.
- Bullish Sentiment: Investors are optimistic, with high expectations for future market growth. In such environments, they are more likely to invest in riskier assets and show less demand for protective strategies.
- Bearish Sentiment: Investors are pessimistic, anticipating declines in asset prices. This sentiment often leads to increased selling pressure, a shift towards safer assets, and greater interest in hedging strategies, such as options on the VIX.
- Neutral Sentiment: A balanced or cautious outlook, where investors neither expect significant gains nor losses. In this state, trading volume and volatility are generally stable, and investors may be waiting for clearer market signals before making large moves.
Investor sentiment can lead to collective behaviors such as “herd behavior,” where individuals follow the crowd’s actions rather than making independent assessments. Bullish sentiment often correlates with rising stock prices, while bearish sentiment tends to accompany falling prices.
The VIX’s Role in Market Timing and as a Contrarian Indicator
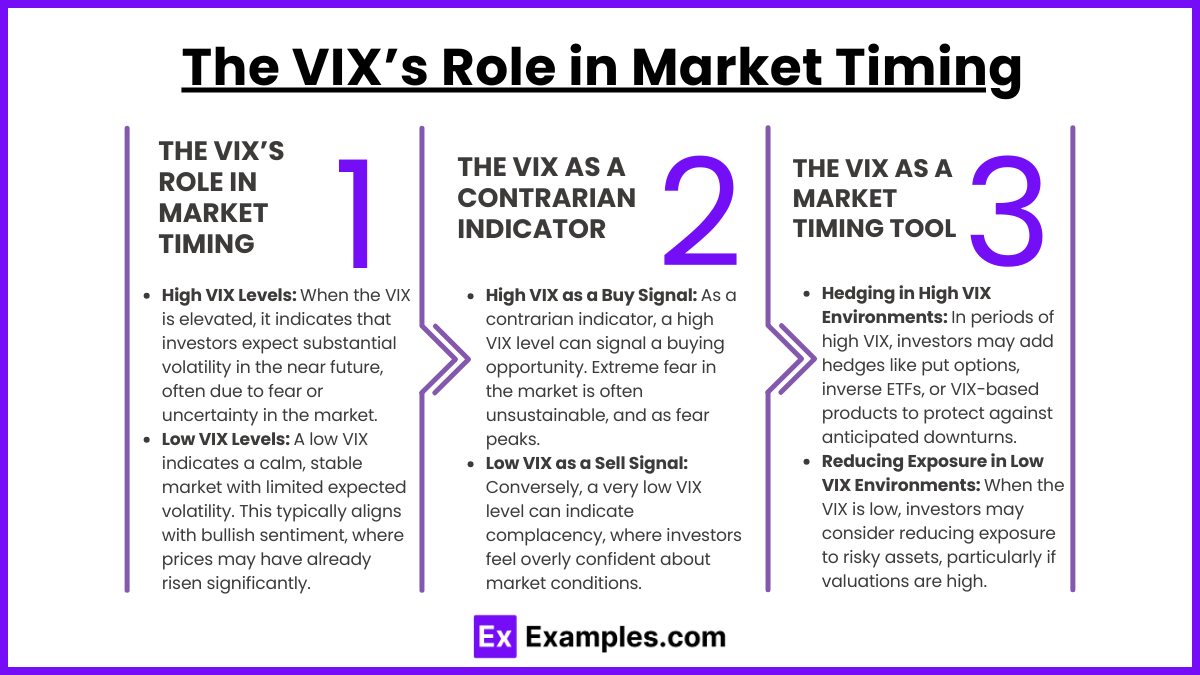
The VIX plays a significant role in market timing and serves as a contrarian indicator for many investors. This dual functionality allows the VIX to help investors determine optimal entry and exit points based on volatility levels and to adopt a contrarian stance when market sentiment reaches extremes.
1. The VIX’s Role in Market Timing
- High VIX Levels: When the VIX is elevated, it indicates that investors expect substantial volatility in the near future, often due to fear or uncertainty in the market. High VIX levels frequently align with market sell-offs or corrections as investors anticipate further declines. For investors practicing market timing, high VIX levels may suggest an opportunity to prepare for re-entry into the market as prices stabilize.
- Low VIX Levels: A low VIX indicates a calm, stable market with limited expected volatility. This typically aligns with bullish sentiment, where prices may have already risen significantly. Low VIX levels can signal a need for caution, as they sometimes indicate complacency, which could precede a market correction. In a low VIX environment, market timers may consider reducing exposure to risky assets, particularly if fundamentals do not support continued bullish momentum.
- Timing Reversal Points: The VIX can help identify potential reversal points in the market. When the VIX reaches extreme highs, it may indicate peak fear and signal an impending market bottom. Conversely, when the VIX is at an extreme low, it may suggest overconfidence and signal a potential market top. Market timers often use the VIX alongside technical and fundamental analysis to confirm potential turning points.
2. The VIX as a Contrarian Indicator
- High VIX as a Buy Signal: As a contrarian indicator, a high VIX level can signal a buying opportunity. Extreme fear in the market is often unsustainable, and as fear peaks, markets may begin to stabilize and recover. Contrarian investors see high VIX levels as a signal that the market may have overreacted to short-term news or fears, and they may begin to buy undervalued assets at a discount.
- Low VIX as a Sell Signal: Conversely, a very low VIX level can indicate complacency, where investors feel overly confident about market conditions. This complacency can lead to overvaluation of assets as investors ignore potential risks. Contrarian investors view a low VIX as a signal that the market may be due for a pullback, so they might sell overvalued assets or reduce exposure to equities.
- Historical Patterns: Historically, spikes in the VIX have often coincided with market bottoms, while low VIX levels have aligned with market peaks. This pattern reinforces the VIX’s use as a contrarian indicator. For example, during the 2008 financial crisis, the VIX reached all-time highs, marking a significant buying opportunity for long-term investors. Similarly, in calmer periods before market corrections, the VIX has often been at its lows.
3. The VIX as a Market Timing Tool
- Low volatility periods can lead to complacency, where market corrections are unexpected but often sudden.
- Mean Reversion Strategy: Since the VIX tends to revert to a mean, strategies based on mean reversion involve buying when the VIX is very high and selling when it is very low. Investors using this strategy bet on the VIX moving back to average levels, making it a tool for profit through volatility changes.
Examples
Example 1: Measuring Market Volatility
The VIX, or Volatility Index, is often referred to as the “fear gauge” because it measures the level of expected market volatility over the next 30 days. When the VIX rises, it typically indicates that investors expect greater market uncertainty and are worried about potential price swings, reflecting heightened fear or anxiety in the market.
Example 2: Predicting Stock Market Trends
The VIX can be used as an indicator to predict stock market movements. When the VIX is at high levels, it often signals that the market is overreacting to perceived risks, and a correction may occur. Conversely, when the VIX is low, it suggests that the market is relatively calm, which can indicate a period of stable or positive market conditions.
Example 3: Contrarian Indicator
Many investors use the VIX as a contrarian indicator. A spike in the VIX, indicating fear and panic, is often seen as a signal that the market has reached a short-term bottom, and a buying opportunity may arise. Conversely, a VIX reading that is too low may indicate complacency, suggesting that the market could be due for a downturn.
Example 4: Investor Sentiment and Behavior
The VIX is a reflection of investor sentiment and market behavior. High VIX levels generally coincide with bearish investor sentiment, as fear of losing money causes increased demand for put options (used to hedge against declines). A low VIX, on the other hand, suggests that investors are more optimistic, which may lead to increased risk-taking in the market.
Example 5: Hedging and Risk Management
The VIX is commonly used by traders and institutional investors for hedging purposes. By using derivatives such as VIX futures or options, investors can protect their portfolios from large swings in stock prices. A rise in the VIX is typically associated with increased demand for hedging strategies, as investors seek to mitigate potential losses during times of heightened volatility.
Practice Questions
Question 1
What does a high VIX reading typically indicate about investor sentiment?
A) Investor confidence is high and the market is stable.
B) Investors are fearful, and the market may experience higher volatility.
C) There is no significant change in market sentiment.
D) The market is likely to experience a long-term bull run.
Correct Answer: B) Investors are fearful, and the market may experience higher volatility.
Explanation: A high VIX reading signals that investors expect greater uncertainty and volatility in the market. This is often associated with fear and anxiety about potential market declines. As the VIX rises, it reflects an increase in demand for options to hedge against risk, indicating that the market might experience more fluctuations in the near term.
Question 2
When the VIX is low, what does it generally indicate about the stock market?
A) The market is experiencing extreme volatility.
B) There is high investor uncertainty.
C) Investor sentiment is calm, and the market is relatively stable.
D) A market crash is imminent.
Correct Answer: C) Investor sentiment is calm, and the market is relatively stable.
Explanation: A low VIX indicates that investors expect less volatility, suggesting that market conditions are perceived as stable and that investors are not overly worried about price swings. This generally corresponds to periods of economic stability or optimism, where market participants are less concerned about short-term price movements or risks.
Question 3
How do traders commonly use the VIX as part of their market strategy?
A) As an indicator of which stocks are trending.
B) To predict the long-term direction of the economy.
C) As a tool for gauging market fear and implementing hedging strategies.
D) To determine the best time to buy government bonds.
Correct Answer: C) As a tool for gauging market fear and implementing hedging strategies.
Explanation: Traders use the VIX to gauge market fear or anxiety and adjust their strategies accordingly. A rising VIX suggests heightened risk and uncertainty, prompting traders to hedge their positions using options or futures to protect against potential market downturns. This use of the VIX is a vital part of risk management in volatile market conditions.

