Mastering Time-Based Trend Calculations is vital for the CMT Exam, focusing on analyzing market movements over specific periods. This knowledge is essential for identifying trends, forecasting market directions, and making informed trading decisions. Understanding these calculations equips candidates with the tools needed to excel in technical analysis and achieve a high CMT score.
Learning Objective
In studying “Time-Based Trend Calculations” for the CMT Exam, you should develop a deep understanding of techniques used to analyze and interpret market trends over time. Learn to apply tools like moving averages, momentum indicators, and trend lines to assess market behavior. Understand the mathematical foundations of these tools and how they help in forecasting future market movements. Explore the practical implications of these calculations in identifying buy and sell signals, and evaluate how they can be used in combination with other technical indicators to enhance trading strategies. Apply this knowledge to real-world scenarios to prepare for the CMT Exam questions.
Moving Averages

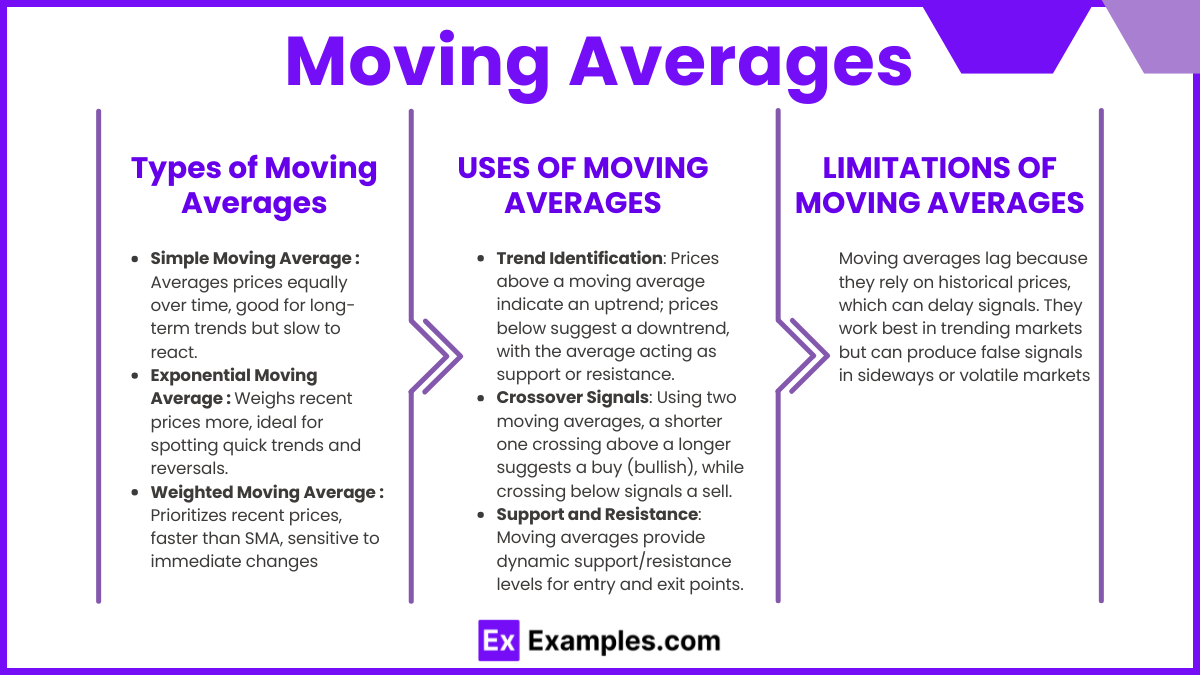
Moving averages (MAs) are fundamental tools in technical analysis that smooth out price data to help identify the direction of a trend. By averaging past price data over a set period, moving averages filter out the “noise” of daily fluctuations, revealing a clearer trend line.
Types of Moving Averages:
- Simple Moving Average (SMA): This average is calculated by summing up the prices over a given period and then dividing by the total number of periods. It gives equal weight to all data points, making it useful for observing long-term trends but slower to react to sudden price changes.
- Exponential Moving Average (EMA): Unlike the SMA, the EMA gives more weight to recent prices, making it more responsive to new price data. This characteristic makes the EMA useful for identifying short-term trends and potential reversals quickly.
- Weighted Moving Average (WMA): This type assigns weights to prices based on their recency, similar to the EMA but with a different weighting calculation. The WMA is more sensitive to price movements than the SMA and is useful for traders needing a quicker response to recent market changes.
Uses of Moving Averages:
- Trend Identification: When prices are above a moving average, it suggests an uptrend, while prices below indicate a downtrend. The moving average acts as a support or resistance level.
- Crossover Signals: A popular strategy is to use two moving averages of different lengths (e.g., a 50-day and a 200-day SMA). When the shorter average crosses above the longer one, it signals a potential buy opportunity (bullish crossover). When it crosses below, it indicates a potential sell opportunity (bearish crossover).
- Support and Resistance: Moving averages can act as dynamic support and resistance levels, helping traders decide where to enter or exit positions.
Limitations of Moving Averages:
Moving averages lag because they rely on historical prices, which can delay signals. They work best in trending markets but can produce false signals in sideways or volatile markets.
Momentum Indicators

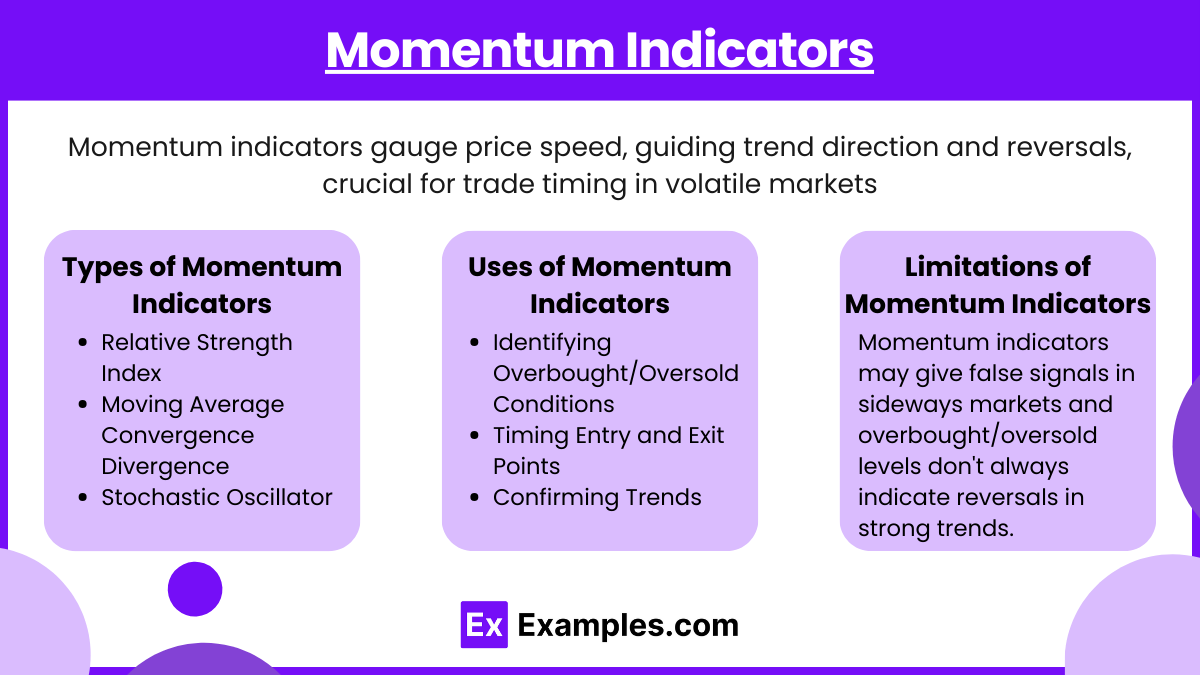
Momentum indicators are technical analysis tools that measure the speed or strength of price movements in a security, giving traders insight into the direction and potential continuation of trends. By focusing on the rate of change in price, momentum indicators help identify when a market is accelerating or decelerating, signaling possible trend reversals or continuations. These indicators are essential in timing trades, especially in markets experiencing significant price swings.
Key Types of Momentum Indicators:
- Relative Strength Index (RSI): The RSI is one of the most popular momentum indicators. It measures the magnitude of recent price changes to assess whether an asset is overbought or oversold. RSI values range from 0 to 100:
- Readings above 70 suggest overbought conditions, signaling a potential trend reversal downward.
- Readings below 30 suggest oversold conditions, signaling a potential upward reversal. RSI helps traders gauge the strength of a trend and potential turning points based on price momentum.
- Moving Average Convergence Divergence (MACD): MACD tracks the relationship between two exponential moving averages (EMAs), typically the 12-day and 26-day EMAs. The MACD line is the difference between these two averages, while a signal line (usually a 9-day EMA) is plotted on top of the MACD line. The key signals are:
- Crossovers: When the MACD line crosses above the signal line, it signals a potential buying opportunity. A cross below the signal line suggests a selling opportunity.
- Divergence: If the MACD diverges from the price movement, it can indicate a potential reversal. MACD is particularly useful for identifying trend reversals and the strength of ongoing trends.
- Stochastic Oscillator: This indicator compares a security’s closing price to its price range over a specific period, typically 14 days. It ranges from 0 to 100, and like RSI, it indicates overbought or oversold conditions:
- Readings above 80 indicate that an asset may be overbought.
- Readings below 20 suggest that it may be oversold. The stochastic oscillator helps in identifying potential reversals, with crossovers and divergences providing entry and exit signals.
Uses of Momentum Indicators:
- Identifying Overbought/Oversold Conditions: Momentum indicators can signal when an asset may have moved too far in one direction, suggesting a reversal could occur.
- Timing Entry and Exit Points: By using crossovers and divergence signals, traders can time their entry and exit points in line with the momentum of the market.
- Confirming Trends: Momentum indicators help confirm the strength of a trend, enabling traders to distinguish between strong and weak trends.
Limitations of Momentum Indicators:
Momentum indicators can produce false signals in choppy or sideways markets since they are most effective in trending environments. Additionally, overbought or oversold readings do not always mean a reversal will occur, as strong trends can sustain these levels for extended periods
Trend Lines

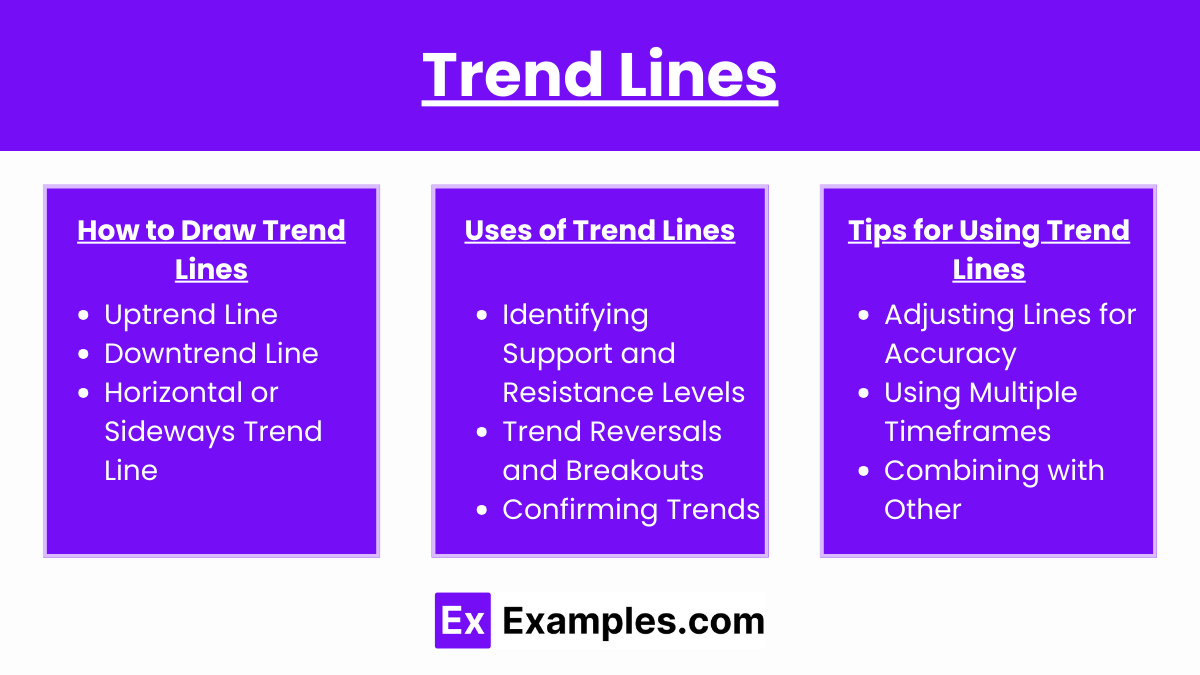
Trend lines are a fundamental tool in technical analysis, used to visually represent the direction of price movement over a specific period. By connecting a series of highs or lows on a price chart, trend lines help traders identify the general direction of an asset’s price (trend) and anticipate potential support and resistance levels. Trend lines provide a straightforward way to see whether an asset is trending upwards, downwards, or moving sideways.
How to Draw Trend Lines:
- Uptrend Line: An uptrend line is drawn by connecting a series of higher lows, moving from left to right on the chart. This line serves as a support level, indicating where buyers are stepping in to push prices higher. As long as prices remain above this line, the uptrend is considered intact.
- Downtrend Line: A downtrend line is drawn by connecting a series of lower highs, also moving from left to right. This line acts as a resistance level, indicating where selling pressure is pushing prices lower. If prices stay below the downtrend line, the downtrend remains in place.
- Horizontal or Sideways Trend Line: When prices move in a range without a clear uptrend or downtrend, horizontal trend lines can be drawn across the tops and bottoms of the range. This indicates that the asset is in a consolidation phase, with support and resistance levels at the boundaries of the range.
Uses of Trend Lines:
- Identifying Support and Resistance Levels: Trend lines often act as support in an uptrend and resistance in a downtrend. Traders use these levels to decide on potential entry and exit points.
- Trend Reversals and Breakouts: When price crosses a trend line, it can signal a potential trend reversal or breakout. For instance, if prices break below an uptrend line, it may indicate a shift toward a downtrend, signaling a selling opportunity. Conversely, a breakout above a downtrend line may signal a potential buying opportunity.
- Confirming Trends: Trend lines help confirm the strength of a trend. The more times a trend line is “tested” (i.e., price touches the line without breaking it), the more reliable it becomes as an indicator of trend direction.
Tips for Using Trend Lines:
- Adjusting Lines for Accuracy: Small price movements may temporarily breach a trend line without truly breaking the trend. Adjusting trend lines to account for minor fluctuations can help prevent false signals.
- Using Multiple Timeframes: Traders often use trend lines across different timeframes to confirm longer-term trends and ensure that short-term movements align with the overall direction.
- Combining with Other Indicators: While trend lines are valuable, they are most effective when used alongside other technical indicators, such as moving averages or momentum indicators, to confirm trend direction and strength.
Examples
Example 1
Using a 50-day Simple Moving Average (SMA) on a stock price chart helps identify the long-term trend. If the price stays above the 50-day SMA, it indicates an uptrend; if it falls below, it signals a downtrend.
Example 2
A trader uses a 10-day and 20-day Exponential Moving Average (EMA) to observe short-term trends. When the 10-day EMA crosses above the 20-day EMA, it’s a buy signal (bullish crossover). If the 10-day EMA crosses below the 20-day EMA, it’s a sell signal (bearish crossover).
Example 3
The Moving Average Convergence Divergence (MACD) indicator is used to analyze a stock’s momentum over time. When the MACD line crosses above the signal line, it suggests a potential uptrend. Conversely, if the MACD line crosses below the signal line, it indicates a possible downtrend.
Example 4
A trader applies a 14-day Relative Strength Index (RSI) to gauge overbought or oversold conditions in the market. When RSI reaches 70 or above, the asset is considered overbought, signaling a potential reversal. If RSI falls to 30 or below, it indicates oversold conditions, also hinting at a possible reversal.
Example 5
Using trend lines over a three-month period, a trader connects a series of higher lows on a stock chart to define an uptrend line. As long as the price stays above this trend line, the uptrend remains intact, signaling a potential continuation of bullish momentum
Practice Questions
Question 1
Which of the following statements best describes the purpose of using a moving average in time-based trend calculations?
A. It is used to smooth out daily fluctuations and identify the general trend.
B. It predicts future stock prices with complete accuracy.
C. It is primarily used to identify overbought and oversold conditions.
D. It indicates the total volume of trades over a set period.
Answer: A
Explanation: A moving average is a trend-following indicator that smooths out daily fluctuations, allowing traders to identify the general trend. It does not predict future prices with complete accuracy (option B) or indicate overbought/oversold conditions (option C). Volume measurement (option D) is unrelated to moving averages.
Question 2
What does it indicate when a 10-day Exponential Moving Average (EMA) crosses above the 20-day EMA in a stock price chart?
A. The stock is experiencing low trading volume.
B. It signals a potential buy opportunity (bullish crossover).
C. The stock is in an oversold condition.
D. It indicates that the stock is overvalued.
Answer: B
Explanation: When a shorter-term moving average (e.g., 10-day EMA) crosses above a longer-term moving average (e.g., 20-day EMA), it signals a potential buy opportunity or a bullish crossover, suggesting upward momentum. This crossover does not indicate trading volume, oversold conditions, or overvaluation.
Question 3
In time-based trend analysis, which indicator is typically used to identify overbought and oversold conditions in a stock?
A. Simple Moving Average (SMA)
B. Moving Average Convergence Divergence (MACD)
C. Relative Strength Index (RSI)
D. Weighted Moving Average (WMA)
Answer: C
Explanation: The Relative Strength Index (RSI) is a momentum oscillator that helps identify overbought and oversold conditions. Values above 70 typically indicate overbought conditions, while values below 30 suggest oversold conditions. SMA, MACD, and WMA are generally used for trend-following rather than specifically identifying overbought or oversold levels.


