Preparing for the CMT Exam involves a thorough grasp of trend systems, particularly in “Trend Systems Part 2.” This segment focuses on advanced analysis of market trends, exploring nuanced aspects of trend identification, sustainability, and reversal signals. Mastery of these concepts is crucial for accurately predicting market movements and enhancing technical analysis proficiency.
Learning Objective
In studying “Trend Systems Part 2” for the CMT Exam, you should aim to understand advanced methods for analyzing market trends, including techniques for identifying trend sustainability, reversals, and potential entry and exit points. Examine key concepts such as moving averages, trendlines, and momentum indicators to assess the strength and direction of trends. Evaluate how these tools are applied in various market conditions and learn to interpret signals that suggest trend continuation or exhaustion. Additionally, explore the importance of trend-following strategies in risk management and apply your understanding to analyze chart patterns effectively in CMT practice questions.
Advanced Trend Identification Techniques

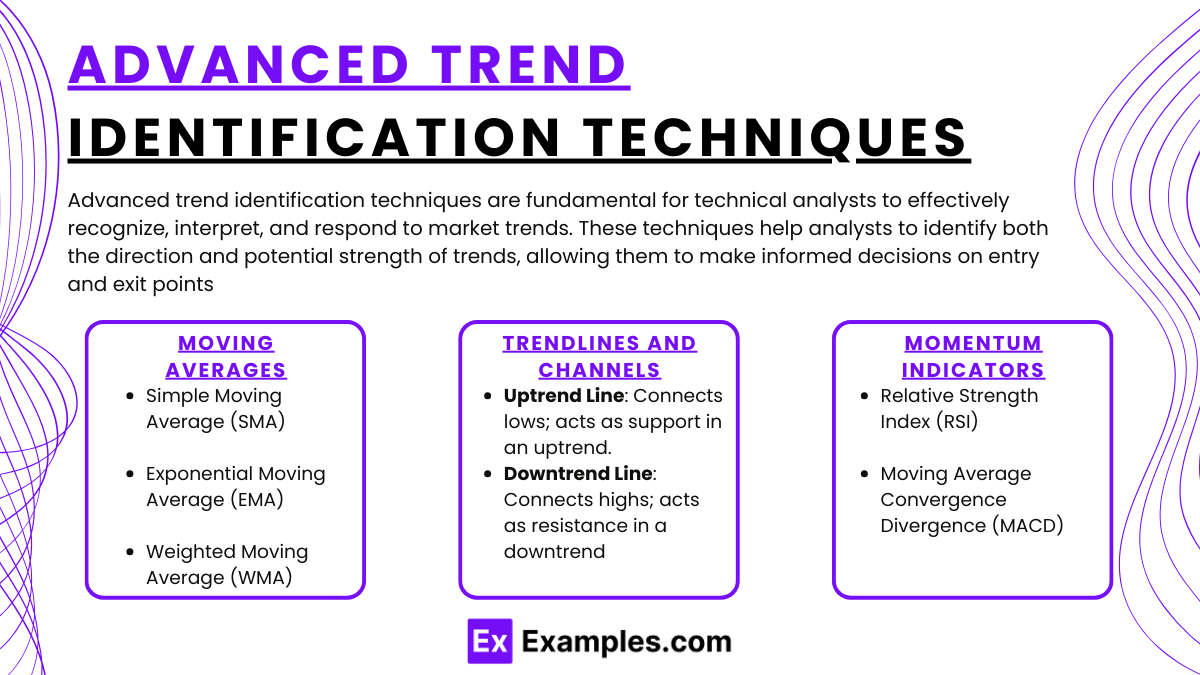
Advanced trend identification techniques are fundamental for technical analysts to effectively recognize, interpret, and respond to market trends. These techniques help analysts to identify both the direction and potential strength of trends, allowing them to make informed decisions on entry and exit points. Here are key methods used in advanced trend identification:
1. Moving Averages
Moving averages are among the most widely used tools in technical analysis for smoothing price data to reduce volatility and reveal underlying trends. They average out historical prices over a specific period, giving analysts a clearer picture of the price trend. There are several types of moving averages:
- Simple Moving Average (SMA): Calculated by averaging prices over a specific period (e.g., 50 or 200 days). It provides a straightforward indication of the overall trend direction, often used to identify support and resistance levels.
- Exponential Moving Average (EMA): This moving average gives more weight to recent prices, making it more responsive to new price information. EMAs are particularly useful for identifying trends in volatile markets.
- Weighted Moving Average (WMA): Similar to EMAs, WMAs assign more importance to recent data but do so in a linearly decreasing manner. WMAs are less common but can be useful in identifying short-term trends.
Moving averages are also used together, as in moving average crossovers, to generate buy or sell signals. For example, when a short-term moving average crosses above a long-term moving average, it can signal the beginning of an uptrend (a “golden cross”). Conversely, a short-term moving average crossing below a long-term one may indicate a downtrend (a “death cross”).
2. Trendlines and Channels
Trendlines are straight lines drawn on a chart to connect successive higher lows in an uptrend or lower highs in a downtrend. They serve as visual representations of the trend direction, helping analysts spot potential areas of support (in an uptrend) or resistance (in a downtrend).
- Uptrend Line: Drawn by connecting the low points in a series of price movements. This line acts as a level of support, where prices are likely to bounce if the uptrend continues.
- Downtrend Line: Drawn by connecting the high points in a series of price movements. It acts as resistance, where prices may face difficulty rising above the trendline in a continuing downtrend.
Channels, which are essentially two parallel trendlines, represent ranges within which prices move. They help analysts define support and resistance levels and can give signals about potential breakouts or reversals when prices move outside the channel.
3. Momentum Indicators
Momentum indicators are essential tools for assessing the strength or speed of a trend rather than just its direction. These indicators help determine if a trend is likely to continue or if it is losing strength and might reverse.
- Relative Strength Index (RSI): RSI measures the magnitude of recent price changes to identify overbought or oversold conditions in a market. An RSI above 70 is generally considered overbought, while an RSI below 30 is seen as oversold. In trending markets, RSI levels can confirm the strength of the trend.
- Moving Average Convergence Divergence (MACD): MACD shows the relationship between two moving averages of prices, often a 12-day EMA and a 26-day EMA. When the MACD line crosses above the signal line, it generates a bullish signal, indicating an uptrend. Conversely, when the MACD line crosses below the signal line, it suggests a potential downtrend.
Momentum indicators, in conjunction with trendlines and moving averages, provide a well-rounded perspective on trends, enabling technical analysts to identify not only the trend direction but also the likelihood of its continuation
Analyzing Trend Strength and Sustainability

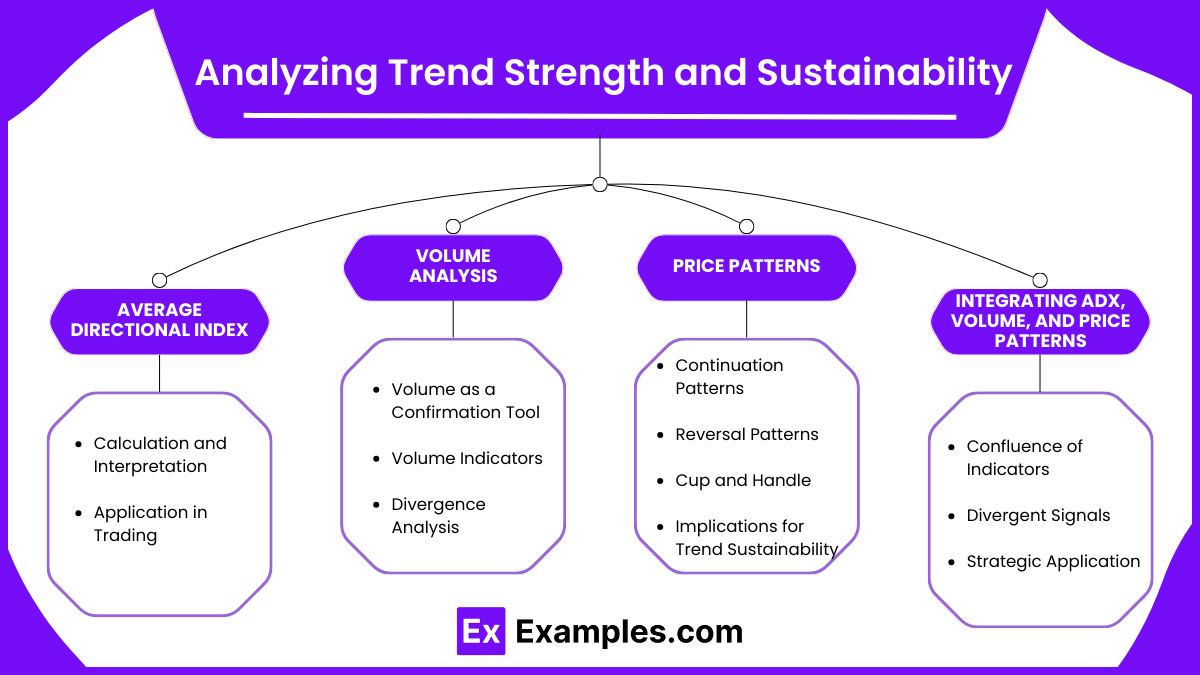
Analyzing trend strength and sustainability is crucial for technical analysts aiming to determine the robustness and longevity of market trends. Understanding these aspects helps in making informed trading decisions, managing risk, and optimizing investment strategies. This section delves into key methodologies and tools used to assess the strength and endurance of trends in various market conditions.
1. Average Directional Index (ADX)
The Average Directional Index (ADX) is a pivotal tool in quantifying the strength of a trend, regardless of its direction. Developed by J. Welles Wilder, ADX is part of the Directional Movement System and ranges from 0 to 100.
- Calculation and Interpretation:
- ADX Values:
- 0-25: Indicates a weak or non-existent trend.
- 25-50: Suggests a strong trend.
- 50-75: Denotes a very strong trend.
- 75-100: Represents an extremely strong trend.
- Usage:
- ADX is typically used in conjunction with the +DI and -DI indicators to determine the trend’s direction and strength.
- A rising ADX value implies increasing trend strength, while a falling ADX suggests weakening momentum.
- ADX Values:
- Application in Trading:
- Trend Confirmation: Traders use ADX to confirm whether the market is trending or ranging, thereby selecting appropriate trading strategies.
- Entry and Exit Signals: A rising ADX can signal the continuation of a trend, while a declining ADX may indicate a potential reversal or consolidation.
2. Volume Analysis
Volume analysis examines the number of shares or contracts traded in a security or market during a given period. It serves as a crucial indicator of the strength behind price movements.
- Volume as a Confirmation Tool:
- Rising Volume with Price Increase: Suggests strong buying interest and confirms an uptrend.
- Rising Volume with Price Decrease: Indicates strong selling pressure and validates a downtrend.
- Decreasing Volume: May signal weakening momentum, regardless of price movement direction.
- Volume Indicators:
- On-Balance Volume (OBV): Accumulates volume based on price movement to identify buying and selling pressure.
- Volume Price Trend (VPT): Combines price and volume to show the flow of money into or out of a security.
- Divergence Analysis:
- Bullish Divergence: Occurs when price makes a new low while volume decreases, suggesting a potential reversal to the upside.
- Bearish Divergence: Happens when price makes a new high but volume declines, indicating a possible reversal to the downside.
3. Price Patterns
Price patterns are formations created by the movement of security prices on a chart, which analysts use to predict future market behavior. Recognizing these patterns helps in assessing the sustainability of existing trends.
- Continuation Patterns:
- Flags and Pennants: Short-term consolidation patterns that signal the continuation of the prevailing trend once the pattern is resolved.
- Triangles (Ascending, Descending, Symmetrical): Indicate a pause in the trend, with the breakout direction often confirming trend continuation.
- Reversal Patterns:
- Head and Shoulders: Suggests a reversal from an uptrend to a downtrend, while an inverse head and shoulders indicate the opposite.
- Double Tops and Bottoms: Indicate potential trend reversals after two failed attempts to break previous highs or lows.
- Cup and Handle:
- A bullish continuation pattern where the price forms a rounded bottom (cup) followed by a smaller consolidation (handle), indicating a potential upward breakout.
- Implications for Trend Sustainability:
- Breakouts: Confirm the continuation or reversal of a trend based on whether the price breaks above resistance or below support.
- Pattern Volume: Volume should increase during the breakout to confirm the pattern’s validity and the trend’s sustainability.
4. Integrating ADX, Volume, and Price Patterns
For a comprehensive analysis of trend strength and sustainability, it is essential to integrate multiple indicators and patterns:
- Confluence of Indicators:
- When ADX indicates a strong trend, volume confirms the trend’s strength, and price patterns support the trend direction, the sustainability of the trend is highly probable.
- Divergent Signals:
- Conflicting signals between ADX, volume, and price patterns may indicate uncertainty in trend sustainability, prompting analysts to exercise caution or seek additional confirmation.
- Strategic Application:
- Risk Management: Understanding trend strength helps in setting appropriate stop-loss levels and position sizing.
- Timing Entries and Exits: Strong trends identified through these analyses allow traders to enter positions in the direction of the trend and exit before signs of weakening emerge
Interpreting Reversal Signals and Entry/Exit Points

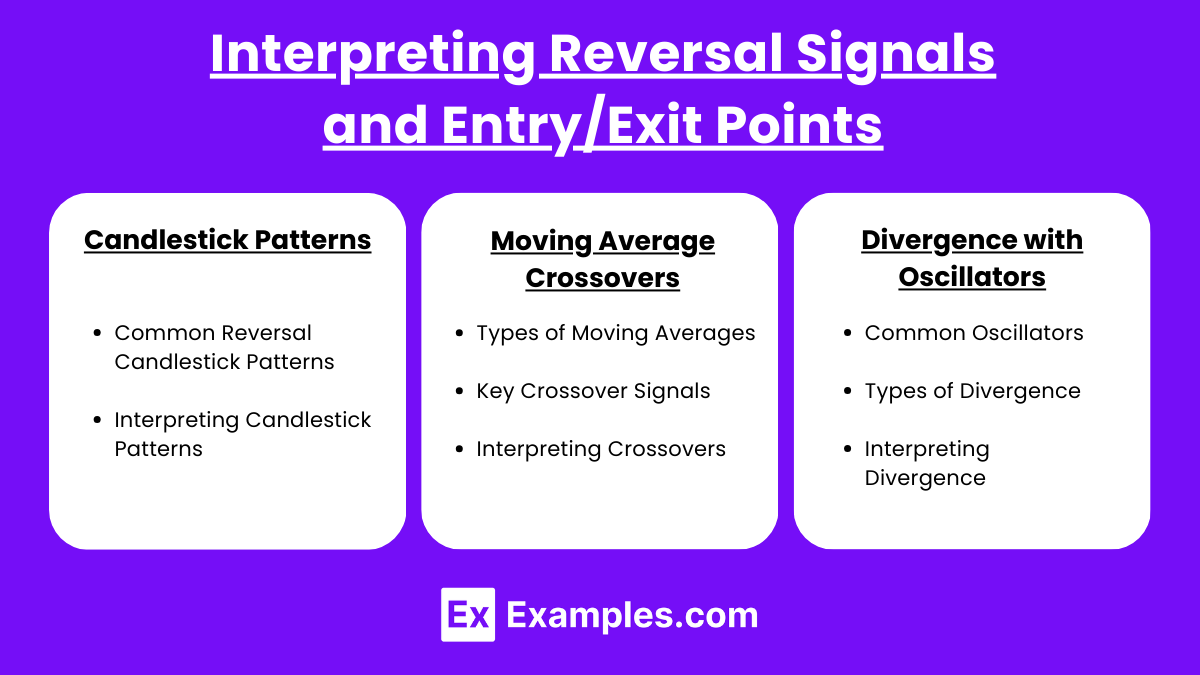
Interpreting reversal signals and determining optimal entry and exit points are crucial skills in technical analysis. Recognizing when a trend is likely to reverse enables traders to capitalize on new market directions and protect profits. This section delves into key techniques used to identify potential trend reversals and make informed trading decisions.
1. Candlestick Patterns
Candlestick patterns are graphical representations of price movements and are essential for identifying potential reversals in market trends. They provide visual cues about the battle between buyers and sellers within a specific time frame.
- Common Reversal Candlestick Patterns:
- Doji: A doji forms when the opening and closing prices are nearly equal, resulting in a candle with a very small body. It signifies market indecision and can indicate a potential reversal when it appears after a sustained uptrend or downtrend.
- Engulfing Patterns:
- Bullish Engulfing: Occurs when a small bearish candle is followed by a larger bullish candle that completely engulfs the previous day’s body. This pattern suggests a possible reversal from a downtrend to an uptrend.
- Bearish Engulfing: The opposite scenario, where a small bullish candle is followed by a larger bearish candle, indicating a potential reversal from an uptrend to a downtrend.
- Hammer and Hanging Man:
- Hammer: Features a small real body at the top with a long lower wick, appearing after a downtrend. It suggests that sellers drove prices lower but buyers stepped in, indicating a potential bullish reversal.
- Hanging Man: Similar in shape to the hammer but appears after an uptrend, signaling that selling pressure may be increasing and a bearish reversal could occur.
- Interpreting Candlestick Patterns:
- Context: The reliability of these patterns increases when they occur near significant support or resistance levels.
- Confirmation: Traders often wait for confirmation from subsequent candles or additional indicators before acting on a signal.
- Volume Analysis: Higher trading volume during the formation of the pattern can strengthen the signal’s validity.
2. Moving Average Crossovers
Moving average crossovers are vital tools for identifying changes in trend direction and generating entry and exit signals.
- Types of Moving Averages:
- Simple Moving Average (SMA): Calculates the average price over a specific period, giving equal weight to all data points.
- Exponential Moving Average (EMA): Places more weight on recent prices, making it more responsive to new information.
- Key Crossover Signals:
- Golden Cross:
- Definition: Occurs when a short-term moving average (e.g., 50-day SMA) crosses above a long-term moving average (e.g., 200-day SMA).
- Implication: Signals a potential bullish reversal and the beginning of an uptrend.
- Death Cross:
- Definition: Happens when a short-term moving average crosses below a long-term moving average.
- Implication: Indicates a potential bearish reversal and the onset of a downtrend.
- Golden Cross:
- Interpreting Crossovers:
- Lagging Indicator: Moving averages are based on past prices and may lag behind current market conditions.
- Avoiding False Signals: It’s essential to combine crossovers with other indicators to confirm signals, especially in volatile or sideways markets.
- Trend Confirmation: Crossovers can validate existing trends or signal new ones, aiding in timing entries and exits.
3. Divergence with Oscillators
Divergence between price action and oscillator indicators can signal a potential trend reversal.
- Common Oscillators Used:
- Relative Strength Index (RSI): Measures the speed and change of price movements to identify overbought or oversold conditions.
- Moving Average Convergence Divergence (MACD): Shows the relationship between two moving averages of a security’s price.
- Stochastic Oscillator: Compares a closing price to a range of its prices over a certain period.
- Types of Divergence:
- Regular Divergence:
- Bullish Divergence: Price makes lower lows while the oscillator makes higher lows, indicating a potential upward reversal.
- Bearish Divergence: Price makes higher highs while the oscillator makes lower highs, suggesting a possible downward reversal.
- Hidden Divergence:
- Bullish Hidden Divergence: Price makes higher lows, but the oscillator makes lower lows, signaling trend continuation.
- Bearish Hidden Divergence: Price makes lower highs, but the oscillator makes higher highs, also indicating trend continuation.
- Regular Divergence:
- Interpreting Divergence:
- Signal Strength: The reliability of divergence signals increases when confirmed by other technical indicators or patterns.
- Timing: Divergence can occur over extended periods; patience is required to wait for confirmation.
- Combining with Other Tools: Using divergence alongside trendlines, moving averages, and candlestick patterns enhances accuracy.
Examples
Example 1: Using Moving Average Crossovers to Identify Trend Reversals
A trader observes that the 50-day Simple Moving Average (SMA) of a stock has just crossed above its 200-day SMA, forming a “Golden Cross.” This crossover suggests a potential bullish reversal from a downtrend to an uptrend. Based on this signal, the trader decides to enter a long position, anticipating that the stock’s price will continue to rise.
Example 2: Applying the ADX Indicator to Measure Trend Strength
An analyst uses the Average Directional Index (ADX) to assess the strength of a current uptrend in the forex market. The ADX value rises above 30, indicating a strong trend. With this information, the analyst recommends maintaining long positions, as the strong ADX suggests the uptrend is likely to continue.
Example 3: Identifying a Bearish Engulfing Pattern as a Reversal Signal
During a prolonged uptrend, a trader spots a bearish engulfing candlestick pattern on the daily chart of a commodity. A small bullish candle is followed by a larger bearish candle that completely engulfs the previous day’s body. Recognizing this as a potential reversal signal, the trader decides to exit their long position to protect profits.
Example 4: Detecting Divergence with the RSI Indicator
A stock’s price makes higher highs, but the Relative Strength Index (RSI) starts making lower highs, indicating bearish divergence. This divergence suggests that the upward momentum is weakening, and a trend reversal may be imminent. Acting on this signal, the trader reduces their holdings in the stock to mitigate potential losses from a downward move.
Example 5: Utilizing Trendlines and Channels for Entry Points
A technical analyst draws an ascending channel on a stock’s price chart by connecting higher lows and higher highs. The stock’s price pulls back to the lower trendline of the channel, which acts as a support level. Seeing this as an opportunity, the analyst enters a long position, expecting the price to bounce off the support and continue its upward trend
Practice Questions
Question 1
Which of the following indicators is specifically designed to measure the strength of a trend but not its direction?
A) Relative Strength Index (RSI)
B) Moving Average Convergence Divergence (MACD)
C) Average Directional Index (ADX)
D) On-Balance Volume (OBV)
Answer: C) Average Directional Index (ADX)
Explanation:
The Average Directional Index (ADX) measures the strength of a trend without considering its direction. It quantifies trend strength on a scale from 0 to 100, where higher values indicate a stronger trend. RSI and MACD provide information on momentum and potential reversals, while OBV relates volume to price changes.
Question 2
A “Golden Cross” in technical analysis occurs when:
A) The 200-day SMA crosses below the 50-day SMA, signaling a bearish reversal
B) The price breaks below a key support level, indicating a continuation of a downtrend
C) The 50-day SMA crosses above the 200-day SMA, indicating a potential bullish reversal
D) The RSI moves below 30, suggesting the asset is oversold
Answer: C) The 50-day SMA crosses above the 200-day SMA, indicating a potential bullish reversal
Explanation:
A “Golden Cross” happens when a short-term moving average (like the 50-day SMA) crosses above a long-term moving average (such as the 200-day SMA). This crossover suggests a potential bullish reversal and the beginning of an uptrend. Options A and B describe bearish signals, while option D relates to RSI, not moving averages.
Question 3
When the price of a security makes higher highs but the MACD histogram shows lower highs, this is an example of:
A) Bullish convergence, indicating trend continuation
B) Bearish divergence, suggesting a potential trend reversal
C) Bullish divergence, signaling a buying opportunity
D) Confirmation of a strong uptrend
Answer: B) Bearish divergence, suggesting a potential trend reversal
Explanation:
Bearish divergence occurs when the price makes higher highs while the MACD histogram (or another oscillator) makes lower highs. This indicates that upward momentum is weakening despite the price rising, suggesting a potential reversal to the downside. This is a warning sign, not a confirmation of trend continuation.


