Understanding Implied Volatility is essential in analyzing options markets and forecasting price movement. This topic delves into how implied volatility reflects market expectations of future volatility, impacting option pricing and trading strategies. It covers the factors influencing implied volatility, including supply and demand dynamics, economic events, and market sentiment. By interpreting implied volatility, technical analysts can gauge market uncertainty and potential price fluctuations, making it a valuable tool for identifying trading opportunities and assessing risk. Mastery of implied volatility is crucial for optimizing options strategies and enhancing decision-making in the financial markets.
Learning Objectives
In studying “Understanding Implied Volatility” for the CMT, you should learn to interpret implied volatility as a measure of expected future volatility derived from option prices, reflecting market sentiment and potential price fluctuations. Understand the factors influencing implied volatility, including demand for options and market uncertainty, and how it differs from historical volatility. Analyze how implied volatility affects option pricing models and its role as an indicator of investor sentiment and potential market movements. Evaluate implied volatility within the context of volatility surfaces and smirks, using it as a tool to assess market expectations. Additionally, apply implied volatility insights in trading strategies to identify opportunities and manage risk effectively.
Interpreting Implied Volatility
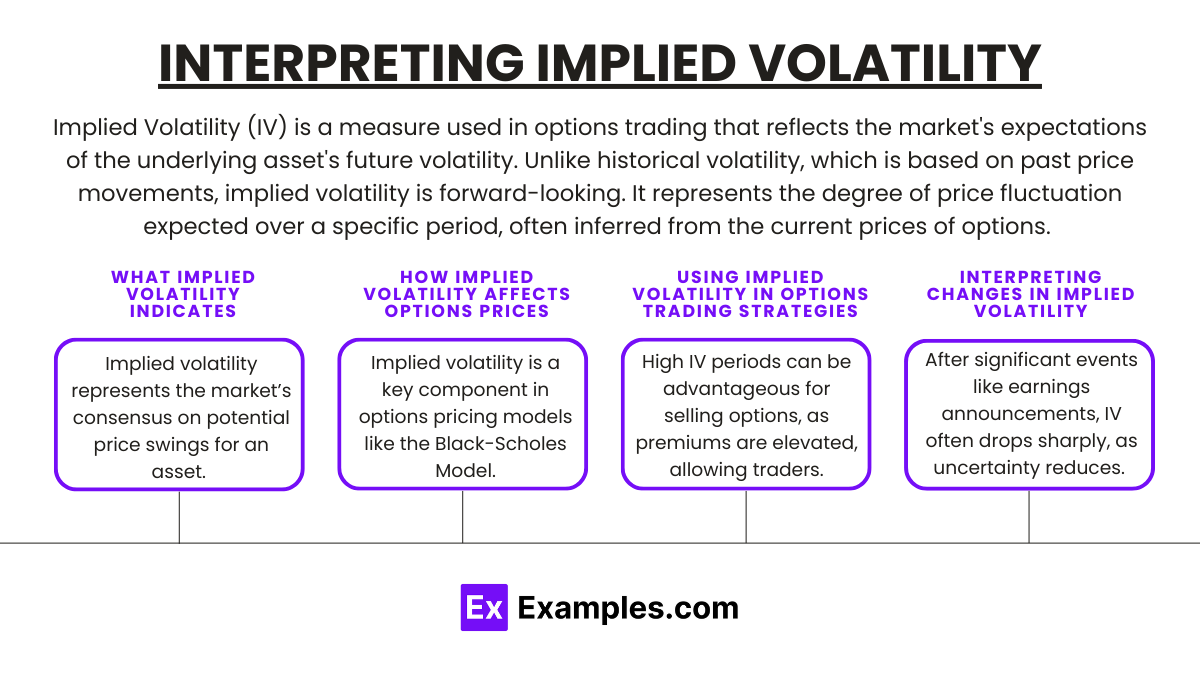
Implied Volatility (IV) is a measure used in options trading that reflects the market’s expectations of the underlying asset’s future volatility. Unlike historical volatility, which is based on past price movements, implied volatility is forward-looking. It represents the degree of price fluctuation expected over a specific period, often inferred from the current prices of options. Here’s a closer look at what implied volatility indicates and how traders use it in options strategies.
1. What Implied Volatility Indicates
Implied volatility represents the market’s consensus on potential price swings for an asset. High implied volatility suggests that the market expects the asset’s price to fluctuate significantly, while low implied volatility implies more stable price expectations. IV tends to increase during periods of market uncertainty, such as earnings announcements or geopolitical events, and decrease when the market is calm or predictable.
- High IV: Implies greater uncertainty about the asset’s price, leading to higher options premiums, as investors demand more compensation for the increased risk.
- Low IV: Indicates a stable market with less expected fluctuation, resulting in lower options premiums.
2. How Implied Volatility Affects Options Prices
Implied volatility is a key component in options pricing models like the Black-Scholes Model. As IV rises, both call and put options prices increase, since higher volatility means a greater chance that the option will expire in the money. Conversely, as IV decreases, options premiums drop, reflecting lower market expectations for significant price movements.
Example: If an asset has historically low volatility but is about to release earnings, IV may increase sharply as traders anticipate potential price swings. This results in higher premiums for options tied to that asset, as traders pay more for protection or speculation.
3. Using Implied Volatility in Options Trading Strategies
Options traders use implied volatility as a guide to select strategies based on market expectations:
- High Implied Volatility:
- Sell Options: High IV periods can be advantageous for selling options, as premiums are elevated, allowing traders to collect more upfront premium. Strategies like credit spreads, straddles, and strangles can profit from volatility contraction.
- Iron Condors: A neutral options strategy that capitalizes on high IV and benefits if IV decreases, bringing premiums down as the market stabilizes.
- Low Implied Volatility:
- Buy Options: Low IV is beneficial for buying options, as premiums are cheaper. If IV increases, options prices can rise, offering an opportunity to sell at a profit. Strategies like long calls, long puts, and debit spreads can take advantage of an expected IV increase.
- Calendar Spreads: In low-IV environments, calendar spreads can capitalize on different levels of IV in different expiry months, allowing traders to benefit if IV rises in the future.
4. Interpreting Changes in Implied Volatility
- IV Skew: Often, implied volatility differs across strikes, forming an “IV skew.” For example, in equity options, out-of-the-money puts tend to have higher IV than calls, reflecting market demand for downside protection. Analyzing the skew can provide insights into market sentiment and expected price direction.
- IV Crush: After significant events like earnings announcements, IV often drops sharply (IV crush), as uncertainty reduces. Traders holding options through an IV crush may see a significant loss in value, even if the underlying asset moves in their favor.
Understanding Volatility Surfaces and Smirks
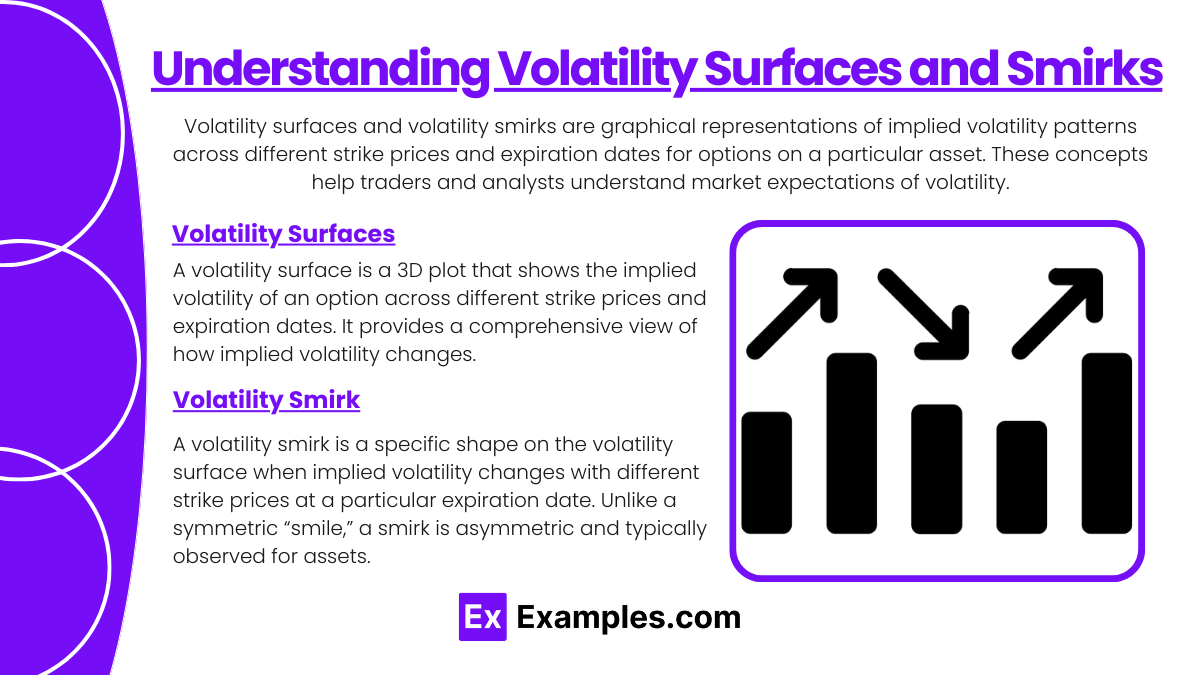
Volatility surfaces and volatility smirks are graphical representations of implied volatility patterns across different strike prices and expiration dates for options on a particular asset. These concepts help traders and analysts understand market expectations of volatility, the perceived risk profile of the asset, and how demand for options varies across strike prices.
1. Volatility Surfaces
A volatility surface is a 3D plot that shows the implied volatility of an option across different strike prices and expiration dates. It provides a comprehensive view of how implied volatility changes not just with the strike price (the “moneyness” of the option) but also with the time to expiration. The axes of a volatility surface are usually:
- Strike Price: The price at which the option can be exercised, indicating how far in-the-money or out-of-the-money the option is.
- Expiration (Time to Maturity): How long until the option expires.
- Implied Volatility: The market’s forecast of future volatility for the underlying asset, inferred from the option’s price.
The shape of a volatility surface reflects market sentiment and expectations. For example:
- Higher Implied Volatility for Near-Term Options: This may indicate anticipated short-term market events or uncertainty.
- Higher Volatility for Deep Out-of-the-Money Options: Often seen for assets with high tail risk, as investors demand higher premiums for options that cover extreme price movements.
Example: If a volatility surface for a stock shows higher implied volatility for options close to the current market price with short expirations, it may indicate that traders expect significant price movements soon (such as due to an earnings announcement).
2. Volatility Smirk
A volatility smirk (or volatility skew) is a specific shape on the volatility surface when implied volatility changes with different strike prices at a particular expiration date. Unlike a symmetric “smile,” a smirk is asymmetric and typically observed for assets where downside risk or market sentiment skews demand for puts versus calls.
- Downward Sloping Smirk: This is common in equity markets, where put options (which provide downside protection) tend to have higher implied volatility than call options, reflecting investors’ tendency to protect against potential declines.
- Upward Sloping Smirk: Sometimes seen in commodity markets, where call options may carry higher volatility due to fears of supply disruptions or shortages, causing prices to spike.
Example: For an index like the S&P 500, a volatility smirk often shows higher implied volatility for out-of-the-money puts than calls, as investors seek protection against a potential market decline. This skew reflects the asymmetry in risk perception—where a crash is often feared more than a rapid upward move.
Difference Between Implied Volatility and Historical Volatility
Implied volatility (IV) and historical volatility (HV) are two important metrics in options trading and risk assessment, each providing unique insights into an asset’s price movements. Here’s a breakdown of their differences, significance, and roles in trading and risk management:
- Implied Volatility (IV): Implied volatility represents the market’s expectations of future volatility for an asset over the life of an option. It’s derived from option prices using models like the Black-Scholes and reflects the level of uncertainty or risk perceived by traders. Higher implied volatility suggests that the market expects significant price movements, while lower IV implies expected stability.
- Historical Volatility (HV): Historical volatility, also known as realized volatility, is a measure of an asset’s actual price fluctuations over a past period (e.g., 30 or 90 days). It’s calculated based on historical price data and reflects how volatile the asset has been in the past.
Calculation
- IV Calculation: Implied volatility isn’t directly observable. It’s calculated by inputting the current option price into an options pricing model and solving for volatility, making IV essentially a market-implied measure of future risk.
- HV Calculation: Historical volatility is computed using statistical techniques, typically by taking the standard deviation of daily price returns over a set period. HV is backward-looking, showing how much the price has fluctuated.Interpretation and Significance
- Implied Volatility:
- Reflects market sentiment and the expected future price swings of the asset.
- Often rises in times of uncertainty, such as before major events (e.g., earnings releases, economic reports).
- Provides insights into option pricing: higher IV leads to more expensive options premiums due to increased risk expectations.
- Historical Volatility:
- Indicates past price movement and risk levels.
- Used as a benchmark to compare with IV, helping traders understand if the market may be over- or underestimating future volatility.
- Lower HV suggests stability, while higher HV indicates past price turbulence.
Impact of Implied Volatility on Option Pricing
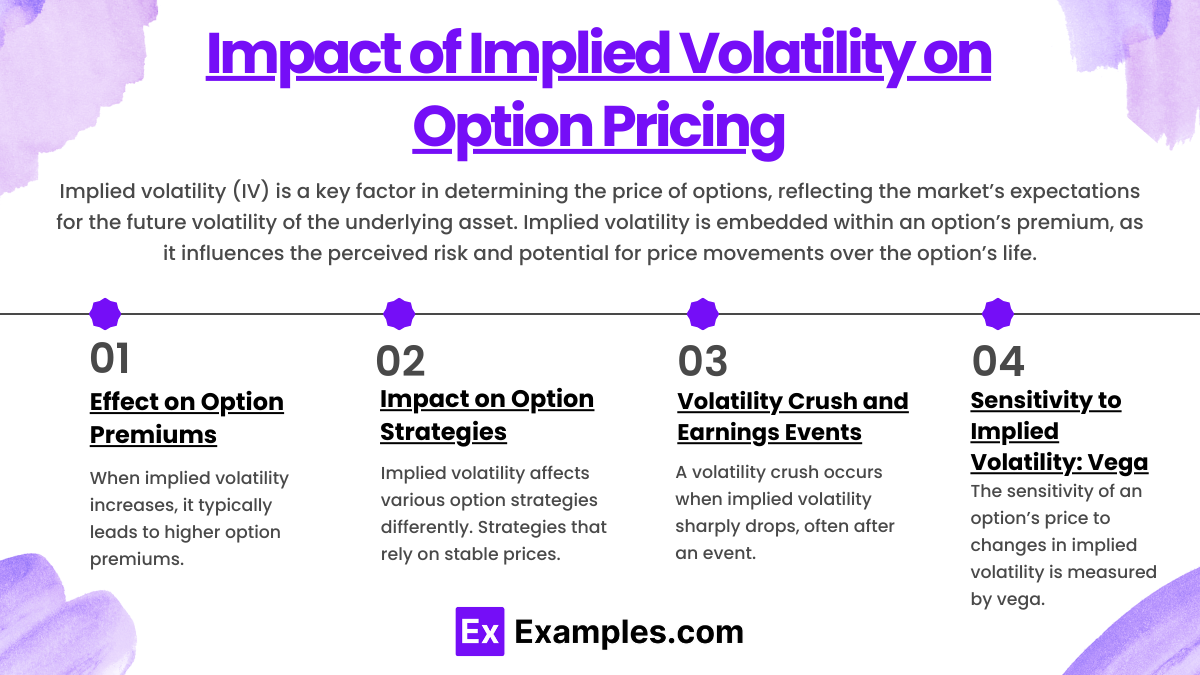
Implied volatility (IV) is a key factor in determining the price of options, reflecting the market’s expectations for the future volatility of the underlying asset. Implied volatility is embedded within an option’s premium, as it influences the perceived risk and potential for price movements over the option’s life. Here’s how implied volatility affects option pricing and why it is crucial for both buyers and sellers.
1. Effect on Option Premiums
When implied volatility increases, it typically leads to higher option premiums, while a decrease in implied volatility results in lower option premiums. This effect occurs because higher implied volatility suggests greater expected price swings, which enhances the probability of the option reaching its strike price (either “in the money” or “out of the money”).
- Call and Put Options: An increase in IV will raise the premiums for both call and put options since both benefit from the potential for larger price movements. Conversely, when implied volatility decreases, premiums for both call and put options generally drop.
- Example: If implied volatility on a stock increases before its earnings report, the price of options (both calls and puts) on that stock will rise as investors anticipate a significant price movement following the report.
2. Impact on Option Strategies
Implied volatility affects various option strategies differently. Strategies that rely on stable prices (e.g., iron condors or butterfly spreads) perform better in low-volatility environments, while those betting on large price movements (e.g., straddles or strangles) benefit from high implied volatility.
- Long Volatility Strategies: Strategies like long straddles or long strangles benefit from high implied volatility because these positions profit when the underlying asset makes large moves, regardless of direction.
- Short Volatility Strategies: Strategies like short straddles or iron condors are sensitive to decreases in implied volatility, as they perform well in stable markets with limited price movement.
- Example: A trader expecting high volatility in a stock may purchase a straddle, hoping to profit from large price movements in either direction. Conversely, if implied volatility is high, the trader might sell options to capitalize on high premiums.
3. Volatility Crush and Earnings Events
A volatility crush occurs when implied volatility sharply drops, often after an event like an earnings release. Before an earnings report, implied volatility typically rises as traders anticipate a potential price swing. Once the event passes, volatility often drops, leading to lower option prices—even if the underlying asset’s price doesn’t change significantly.
- Impact on Option Holders: If an option holder buys an option at a high premium due to elevated implied volatility before an earnings report, they might experience a sharp drop in the option’s value immediately after the report, as implied volatility declines. This effect can reduce the option’s value even if the underlying price moves in the anticipated direction but not enough to offset the loss from reduced volatility.
- Example: A trader buys a call option on a stock before earnings. If the stock’s price doesn’t increase significantly after the report, the option’s premium might fall sharply due to the drop in implied volatility, resulting in a loss.
4. Sensitivity to Implied Volatility: Vega
The sensitivity of an option’s price to changes in implied volatility is measured by vega. Vega represents the amount by which the option’s price is expected to change with a 1% change in implied volatility. Options with higher vega are more sensitive to changes in volatility.
- Vega and Maturity: Longer-term options have higher vega because the extended time horizon increases the likelihood of price movements, making them more sensitive to volatility changes. Shorter-term options have lower vega, as there is less time for the underlying asset to experience significant price fluctuations.
- Example: A long-term call option with high vega will see its price rise significantly if implied volatility increases, while a short-term option with lower vega may see a smaller price impact from the same volatility change.
Examples
Example 1: Options Pricing
Implied volatility is a crucial component in the pricing of options. It represents the market’s expectation of how much the underlying asset’s price will fluctuate over a given period. For example, when an option’s implied volatility increases, the option price tends to rise because higher volatility increases the potential for large price movements, making the option more valuable.
Example 2: Market Sentiment Indicator
Implied volatility is often used as a gauge of market sentiment. A rise in implied volatility can indicate that market participants expect greater uncertainty or risk in the future. For instance, when the implied volatility of stock options rises during periods of economic instability or political uncertainty, it signals that investors anticipate increased market fluctuations or risk in the coming months.
Example 3: Comparing Stocks and Options
Investors use implied volatility to compare different stocks or options. For example, two companies in the same industry might have similar stock prices, but one could have a significantly higher implied volatility. This might suggest that the market expects more dramatic price movements in that company’s stock, which could influence an investor’s decision on which stock to invest in or which option to trade.
Example 4: Volatility Smile
In options markets, the volatility smile refers to the pattern where implied volatility tends to be higher for options that are deep in-the-money or out-of-the-money compared to at-the-money options. Understanding this concept is important for options traders as it provides insight into the market’s expectations for potential price moves, which can be crucial for pricing strategies and hedging decisions.
Example 5: Hedging Strategies
Implied volatility is key in determining the cost of hedging strategies. For example, if implied volatility is high, the cost of buying options as insurance against price fluctuations (such as using put options to hedge against potential losses) will be more expensive. Traders and institutional investors monitor implied volatility to assess whether hedging costs are justifiable or whether alternative risk management strategies should be considered.
Practice Questions
Question 1
What does an increase in implied volatility typically indicate about market expectations?
A) The market expects lower price fluctuations in the future.
B) The market expects higher price fluctuations in the future.
C) Implied volatility is not related to market expectations.
D) Implied volatility only reflects past price movements.
Correct Answer: B) The market expects higher price fluctuations in the future.
Explanation: Implied volatility reflects the market’s expectations of future price fluctuations. When implied volatility increases, it indicates that investors expect more uncertainty or higher price movements in the underlying asset. Higher implied volatility generally leads to higher option prices because it increases the likelihood of the option ending in-the-money. Therefore, the correct answer is B.
Question 2
How does implied volatility impact the pricing of options?
A) Higher implied volatility increases the price of options.
B) Higher implied volatility decreases the price of options.
C) Implied volatility has no effect on option pricing.
D) Implied volatility only affects the price of stocks, not options.
Correct Answer: A) Higher implied volatility increases the price of options.
Explanation: Implied volatility directly impacts the price of options because it represents the market’s expectation of future volatility. When implied volatility increases, the price of options tends to rise, as the higher volatility increases the potential for larger price movements, making the option more valuable. Therefore, higher implied volatility leads to higher option premiums, as indicated in option A.
Question 3
What does a “volatility smile” in options markets typically suggest?
A) There is no relationship between implied volatility and option moneyness.
B) Implied volatility is the same for all strike prices and expiration dates.
C) Implied volatility is higher for deep in-the-money and out-of-the-money options.
D) Implied volatility decreases with time to expiration.
Correct Answer: C) Implied volatility is higher for deep in-the-money and out-of-the-money options.
Explanation: A “volatility smile” is a pattern in options markets where implied volatility is higher for options that are deep in-the-money or out-of-the-money, compared to at-the-money options. This pattern suggests that the market expects larger price fluctuations in these extreme price levels, increasing the demand and cost for options with such strikes. Therefore, option C correctly describes this market phenomenon.

