Preparing for the CMT Exam requires a comprehensive understanding of “Volume: The Technician’s Decryption Device,” a crucial component of technical analysis. Mastery of volume analysis helps interpret market strength and price movements. This knowledge provides insights into trading behavior, market sentiment, and potential reversals, critical for achieving a high CMT score.
Learning Objective
In studying “Volume: The Technician’s Decryption Device” for the CMT Exam, you should learn to understand how volume analysis can enhance the interpretation of market trends and price movements. Analyze how changes in trading volume can indicate the strength of a price trend and potential reversals. Evaluate the principles behind volume indicators like On-Balance Volume (OBV) and Volume by Price. Additionally, explore how these tools are used in conjunction with price action to assess market sentiment and participation levels. Apply this knowledge to develop trading strategies that consider both price and volume for more accurate predictions of market direction and momentum.
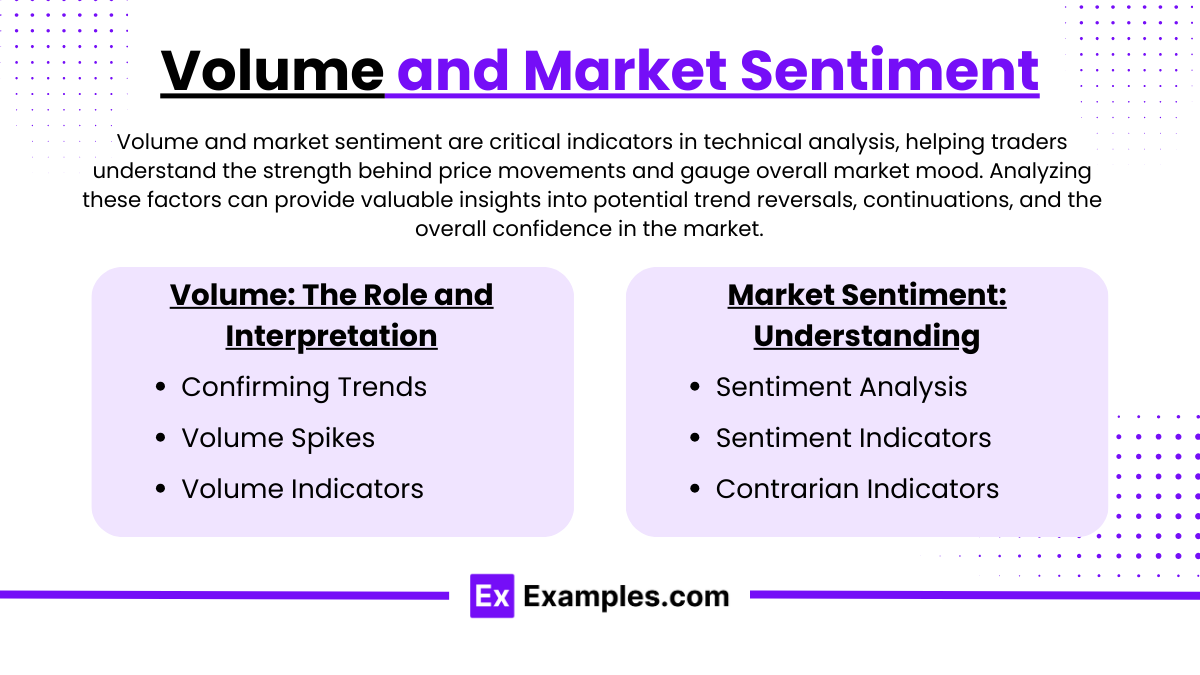
Volume and Market Sentiment

Volume and market sentiment are critical indicators in technical analysis, helping traders understand the strength behind price movements and gauge overall market mood. Analyzing these factors can provide valuable insights into potential trend reversals, continuations, and the overall confidence in the market. Here’s how volume and market sentiment play pivotal roles in trading and investment decision-making:
Volume: The Role and Interpretation
- Confirming Trends: Volume is a powerful tool for confirming trends. An uptrend accompanied by increasing volume suggests strong buying interest and confirms the trend’s robustness. Conversely, a downtrend with high volume indicates strong selling pressure.
- Volume Spikes: Sudden increases in volume can signal key events or changes in market sentiment, such as earnings announcements, economic news releases, or shifts in investor confidence. These spikes can precede market reversals or accelerations.
- Volume Indicators: Tools like On-Balance Volume (OBV), Volume-Price Trend (VPT), and Accumulation/Distribution Line help quantify volume changes and their correlation with price movements, offering deeper insights into market dynamics.
Market Sentiment: Understanding and Application
- Sentiment Analysis: Market sentiment reflects the overall attitude of investors toward a particular security or the market. It is typically bullish (positive) or bearish (negative) but can also be neutral.
- Sentiment Indicators: Tools such as the Fear & Greed Index, Put/Call Ratio, and the Volatility Index (VIX) provide quantifiable measures of market sentiment. High put/call ratios might suggest bearish sentiment, while low ratios indicate bullish sentiment.
- Contrarian Indicators: Sometimes, extreme sentiment readings can serve as contrarian indicators. For example, extreme greed may signal that the market is overbought, while extreme fear might suggest a market bottom, presenting buying opportunities.
Combining Volume with Other Analytical Techniques

Combining trading volume with other analytical techniques enriches technical analysis and strengthens the reliability of market trend predictions and trading signals. Here’s a concise overview of how to effectively integrate volume with various technical tools:
Combining Volume with Analytical Techniques:
- Volume and Trend Analysis
- Moving Averages: Volume confirms the strength of trends indicated by moving averages. Increasing volume with rising averages suggests a strong upward trend, while increasing volume with falling averages indicates a strong downward trend.
- Volume and Momentum Indicators
- RSI and MACD: High volume can confirm momentum signals from RSI and MACD, enhancing the reliability of overbought or oversold conditions and buy/sell signals.
- Volume and Chart Patterns
- Breakouts and Support/Resistance: Volume is critical in confirming breakouts from patterns like triangles or channels. A surge in volume during a breakout or at key support/resistance levels often preludes continued movement in that direction.
- Volume and Candlestick Patterns
- Reversal and Continuation Patterns: High volume during candlestick reversal patterns (like hammers or engulfing patterns) or continuation patterns significantly increases the reliability of these signals.
- Volume and Market Sentiment Indicators
- Put/Call Ratio and VIX: Volume combined with sentiment indicators like the Put/Call Ratio and the VIX can provide insights into market sentiment, enhancing predictions on market turns or continuations.
Ethical Considerations

Ethical considerations and challenges are central to many professional fields, particularly in areas like business, healthcare, finance, and technology. Understanding these ethical dilemmas is crucial for professionals to navigate complex environments responsibly. Here’s an overview of some key ethical considerations and challenges across various sectors:
Common Ethical Considerations:
- Transparency and Honesty: Maintaining transparency in operations and communications is essential. This involves providing accurate information to stakeholders, avoiding misleading practices, and openly sharing the risks associated with business operations or investment decisions.
- Confidentiality and Privacy: Safeguarding sensitive information is critical, especially with the increasing amount of data being processed in today’s digital age. Ensuring data privacy and securing personal information against unauthorized access are paramount concerns.
- Fairness and Equity: Ensuring fair treatment of all stakeholders, including employees, clients, and customers, is fundamental. This includes equitable hiring practices, fair wages, non-discriminatory policies, and unbiased customer service.
- Conflict of Interest: Professionals must avoid situations where personal interests might conflict with their professional duties or might lead to biased decisions. Disclosing potential conflicts of interest is a key aspect of ethical practice.
- Responsibility and Accountability: Taking responsibility for one’s actions and their outcomes is vital. This includes being accountable for decisions and their impacts on society, the environment, and the economy.
Examples
Example 1: On-Balance Volume (OBV) Leading a Price Breakout
An equity shows a steady increase in OBV while its price remains in a consolidation pattern. A sharp increase in OBV before the price breaks out of its range signals that buying pressure is accumulating, leading traders to anticipate a bullish breakout, which indeed occurs as volume precedes price.
Example 2: Volume by Price Confirming Support Levels
In analyzing a downward trending stock, a trader uses Volume by Price to identify a price level where a significant amount of volume has occurred historically. This level later acts as strong support, as the increased volume indicates a lot of trading activity, suggesting that many traders value the stock at this level, thus resisting further price drops.
Example 3: Volume Climax Indicating Trend Reversals
A stock experiencing a prolonged downtrend shows a sudden spike in volume, known as a volume climax, which coincides with a sharp price decrease. This scenario typically indicates exhaustion of selling and potential reversal, where traders might consider entering a long position expecting a rebound.
Example 4: Accumulation/Distribution During Ranging Markets
During a range-bound market, a gradual increase in volume without a corresponding price change might indicate accumulation by institutional investors. This subtle volume change, if consistent, could foreshadow a future price breakout as these large players finish accumulating shares.
Example 5: Confirming Candlestick Patterns with Volume
A candlestick pattern such as a bullish engulfing is observed, but traders look to volume for confirmation. A significant increase in volume on the day of the bullish engulfing pattern provides the needed confirmation of buyer commitment, enhancing the reliability of the pattern for a bullish trade setup.
Practice Questions
Question 1
What does an increasing On-Balance Volume (OBV) indicate in the context of a stable price trend?
A. Decreased interest in the asset
B. Stability in the price due to lack of buyer or seller advantage
C. Accumulation by investors, suggesting potential upward price movement
D. The asset is overvalued and likely to decrease in price
Answer:
C. Accumulation by investors, suggesting potential upward price movement
Explanation:
An increasing OBV during a period when prices remain stable generally indicates that volume is accumulating, suggesting that buyers are more aggressive and there is a build-up of buying pressure, which could lead to an upward price movement. OBV serves as a leading indicator by showing this trend before it is reflected in the price.
Question 2
Which volume indicator would be most useful for identifying price levels with significant historical trading activity?
A. Moving Average Convergence Divergence (MACD)
B. Relative Strength Index (RSI)
C. Volume by Price
D. Bollinger Bands
Answer:
C. Volume by Price
Explanation:
Volume by Price is a volume-based indicator that highlights the amount of volume traded at specific price levels over a selected period. It is particularly useful for identifying support and resistance areas, as these levels where significant volume has occurred indicate price points that many traders have vested interest in.
Question 3
What can a sudden spike in volume in conjunction with a price breakout from a consolidation pattern suggest?
A. The breakout is likely to reverse quickly.
B. The breakout lacks sufficient trader interest.
C. The breakout is likely to fail due to overtrading.
D. The breakout is likely genuine and may continue in the direction of the breakout.
Answer:
D. The breakout is likely genuine and may continue in the direction of the breakout.
Explanation:
A sudden increase in volume accompanying a price breakout from a consolidation pattern typically validates the breakout as genuine. High volume indicates strong trader interest and commitment to the price movement direction, suggesting that the breakout may sustain its direction as more traders participate in the trend.


