Area I – Business Analysis in the CPA Exam focuses on evaluating a company’s financial position, operational performance, and strategic direction. It emphasizes the use of tools such as financial statement analysis, ratio analysis, and benchmarking to assess business health. Candidates learn to apply frameworks like SWOT analysis, Porter’s Five Forces, and value chain analysis to identify risks and opportunities. Additionally, Enterprise Risk Management (ERM) and scenario analysis are explored to address uncertainties. Mastery of these concepts helps in making sound business decisions aligned with strategic objectives.
Learning Objectives
In studying “Business Analysis” for the CPA Exam, you should learn to understand key methods such as financial statement analysis, ratio analysis, and benchmarking. Evaluate how these tools help assess a company’s financial health, operational efficiency, and strategic alignment. Analyze frameworks like SWOT analysis, Porter’s Five Forces, and value chain analysis to identify opportunities and risks. Explore how Enterprise Risk Management (ERM) integrates risk mitigation into business strategy and apply sensitivity and scenario analysis to interpret financial outcomes. Additionally, develop the ability to analyze financial and non-financial metrics, benchmarking them against industry standards to make informed business decisions.
Business Analysis involves evaluating the performance, operations, and financial health of a business to inform decision-making, strategic initiatives, and reporting. This area covers methods and frameworks used to analyze an entity’s operations, environment, and financial data to provide valuable insights.
Financial Statement Analysis
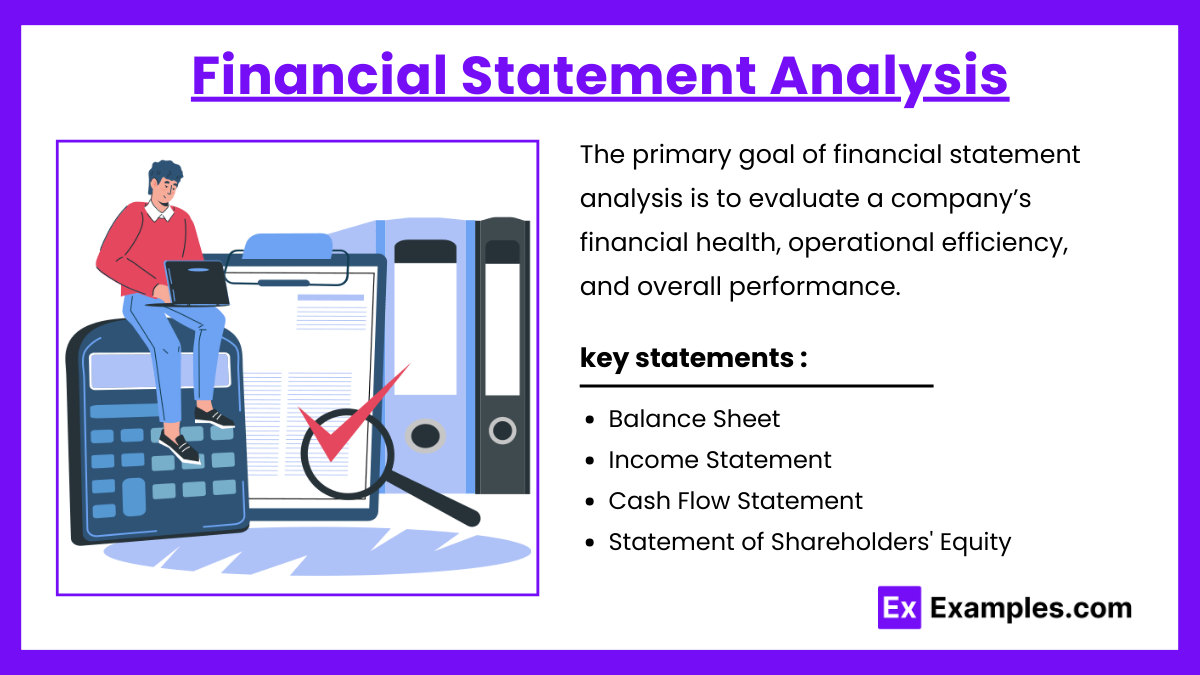
The primary goal of financial statement analysis is to evaluate a company’s financial health, operational efficiency, and overall performance. This analysis helps stakeholders such as investors, creditors, and management make informed decisions about investments, financing, and operations.
The financial position is assessed through four key statements:
- Balance Sheet – Provides a snapshot of a company’s financial position at a given point in time by listing assets, liabilities, and shareholders’ equity.
- Income Statement – Reports the company’s revenues, expenses, and profits over a specific period.
- Cash Flow Statement – Summarizes cash inflows and outflows from operating, investing, and financing activities.
- Statement of Shareholders’ Equity – Shows changes in equity from net income, dividends, and stock issuances or buybacks.
Tools Used:
- Horizontal Analysis: Comparison of financials over different periods to identify trends.
- Vertical Analysis: Expressing financial statement items as a percentage of a total (e.g., each line item as a % of total revenue).
- Ratio Analysis: Evaluation of financial health using profitability, liquidity, efficiency, and solvency ratios.
Performance Measurement and Benchmarking
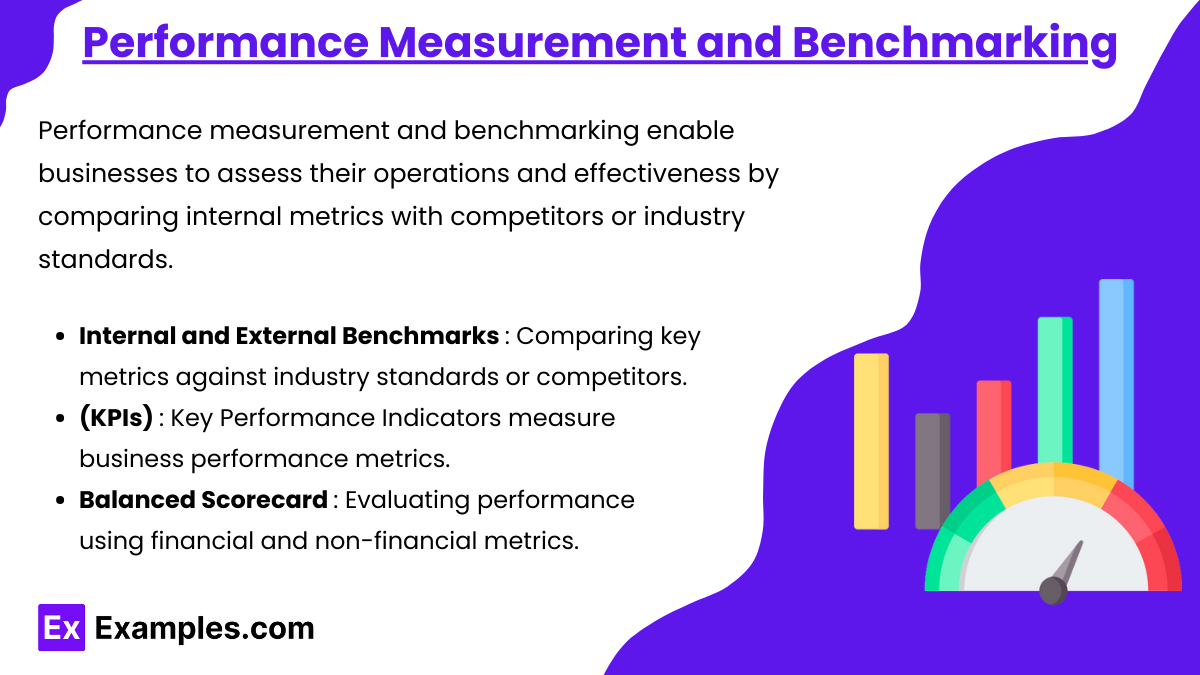
Performance measurement and benchmarking enable businesses to assess their operations and effectiveness by comparing internal metrics with competitors or industry standards. These tools help organizations identify strengths and weaknesses, improve processes, and align activities with strategic goals. This area focuses on the development and use of benchmarks, KPIs, and frameworks like the balanced scorecard to evaluate overall business performance.
- Internal and External Benchmarks: Comparing key metrics against industry standards or competitors.
- Key Performance Indicators (KPIs): Metrics like return on assets (ROA), gross profit margin, or revenue growth that reflect business performance.
- Balanced Scorecard Approach: Incorporating financial and non-financial metrics to evaluate company performance comprehensively.
Strategic and Operational Analysis
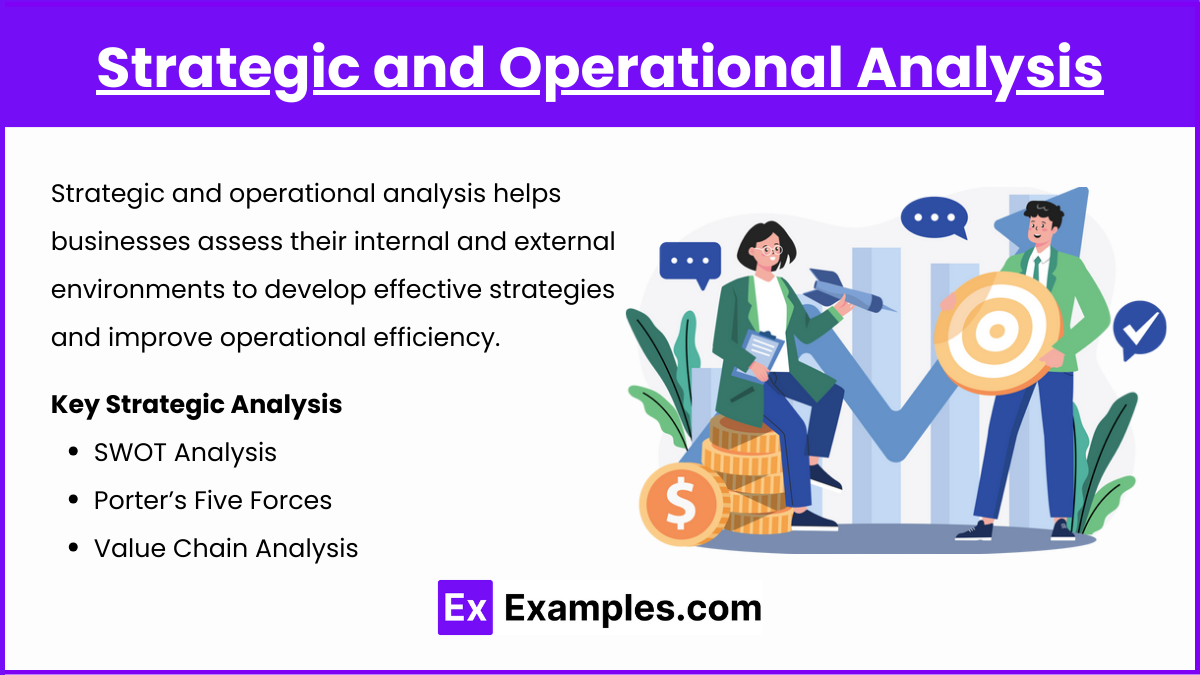
Strategic and operational analysis helps businesses assess their internal and external environments to develop effective strategies and improve operational efficiency. CPA candidates must understand key analytical tools such as SWOT Analysis, Porter’s Five Forces, and Value Chain Analysis to identify opportunities, address threats, and align operations with strategic goals.
- SWOT Analysis: Evaluating strengths, weaknesses, opportunities, and threats to align business strategies.
- Porter’s Five Forces: Understanding the competitive forces within an industry to assess market dynamics and profitability potential.
- Value Chain Analysis: Breaking down business operations into activities to identify value-adding processes and areas for improvement.
Industry and Economic Analysis
Industry and economic analysis helps businesses understand the external environment by examining macroeconomic indicators and industry trends. These insights guide strategic planning, risk management, and operational adjustments. CPA candidates must be familiar with how economic conditions and industry developments impact business performance and financial decisions.
- Macroeconomic Indicators: Analyzing factors like GDP, inflation, and interest rates to assess economic conditions. Macroeconomic indicators are key statistics that reflect the overall health and direction of an economy. These indicators are essential for assessing the economic environment in which a business operates and making informed strategic decisions.
- Industry Trends: Identifying market dynamics, regulatory changes, and consumer behavior affecting the business landscape. Industry trends refer to developments and changes within a specific sector that influence market dynamics, including technology advances, consumer behavior, regulatory updates, and competitive landscape shifts.
Risk Identification and Management
Risk identification and management are essential for businesses to anticipate, assess, and mitigate potential risks that could impact their operations and financial health. CPA candidates must understand frameworks like Enterprise Risk Management (ERM) and techniques such as sensitivity and scenario analysis to effectively evaluate risks and recommend appropriate responses.
- Enterprise Risk Management (ERM): ERM is a comprehensive framework used to identify, assess, and manage risks across an organization. It integrates risk management into strategic planning, ensuring that risks are evaluated across all areas of the business. The goal is not only to mitigate risks but also to take advantage of opportunities that align with the company’s risk appetite.
- Sensitivity and Scenario Analysis: Sensitivity analysis examines how changes in one or more input variables (e.g., costs, interest rates, or sales volume) affect financial outcomes. It helps businesses identify the variables that have the most significant impact on performance, allowing them to manage risks effectively. Assessing how changes in assumptions (e.g., costs, interest rates) impact financial outcomes.
Examples
Example 1 : Analyzing Profitability Trends Using Ratio Analysis
A company’s profitability is evaluated by calculating metrics such as the gross profit margin, operating margin, and net profit margin over multiple periods. For instance, if the net profit margin declines steadily over three years, the business analyst investigates causes such as rising costs, pricing strategies, or reduced sales volumes. This analysis helps management decide on cost-cutting measures or explore product re-pricing strategies.
Example 2 : Using SWOT Analysis for Strategic Planning
A business plans to enter a new market and conducts a SWOT analysis. It identifies strengths like a well-known brand and weaknesses such as limited distribution networks. It also explores external opportunities like growing demand for sustainable products and threats such as regulatory challenges. The insights from this analysis guide the company in developing strategies to leverage its strengths and address its weaknesses while preparing for potential market threats.
Example 3 : Forecasting Cash Flows through Pro Forma Financial Statements
When a company considers launching a new product line, it prepares pro forma financial statements to predict future cash flows and financial impact. The forecast includes projected sales, expenses, and profit margins over the next five years. If the analysis reveals potential cash flow gaps in the early stages, the company can secure additional financing in advance or adjust the launch strategy.
Example 4 : Benchmarking KPIs Against Industry Standards
A manufacturing company benchmarks its KPIs, such as inventory turnover and return on assets, against industry averages. If the company’s inventory turnover is significantly slower than the industry norm, it highlights inefficiencies in inventory management. This finding prompts a review of the company’s supply chain and ordering processes, leading to improved operational efficiency.
Example 5 : Applying Sensitivity Analysis to Evaluate Investment Risks
A business analyst performs sensitivity analysis on a new investment project by altering assumptions, such as sales growth and interest rates. For example, the analysis examines how a 2% increase in interest rates would affect the project’s profitability. This approach helps the company identify the most sensitive variables and better understand the risks associated with the investment, informing decision-making on whether to proceed with or modify the project.
Practice Questions
Question 1
Which of the following best describes horizontal analysis?
A) It compares a company’s performance with industry peers for benchmarking.
B) It evaluates the percentage change in financial statement items over multiple periods.
C) It expresses individual line items as a percentage of total revenue for the period.
D) It forecasts future financial outcomes using historical trends and assumptions.
Answer: B) It evaluates the percentage change in financial statement items over multiple periods.
Explanation: Horizontal analysis involves comparing financial data over several periods, often shown as percentage changes year-over-year or quarter-over-quarter. It helps assess trends in revenue, expenses, and profitability, providing insights into the company’s growth or decline. This type of analysis enables the company to identify patterns that need attention, such as a steady rise in operating expenses.
Option D describes forecasting, not horizontal analysis.
Option A is incorrect because benchmarking compares performance with industry peers.
Option C refers to vertical analysis, not horizontal.
Question 2
Which of the following ratios would most effectively measure a company’s liquidity position?
A) Debt-to-equity ratio
B) Return on assets (ROA)
C) Current ratio
D) Operating profit margin
Answer: C) Current ratio
Explanation : The current ratio measures a company’s ability to meet short-term obligations with its current assets. It is calculated as current assets / current liabilities. A ratio above 1.0 indicates that the company has more current assets than liabilities, reflecting good liquidity. A lower ratio may signal potential liquidity problems.
Option D focuses on operational efficiency, not the company’s ability to meet short-term obligations.
Option A is incorrect because the debt-to-equity ratio measures leverage, not liquidity.
Option B mCeasures profitability, not liquidity.
Question 3
Which performance evaluation tool incorporates both financial and non-financial metrics to provide a more comprehensive analysis of business performance?
A) Porter’s Five Forces
B) Balanced Scorecard
C) Sensitivity Analysis
D) Horizontal Analysis
Answer: B) Balanced Scorecard
Explanation: The balanced scorecard is a performance management tool that evaluates a business from multiple perspectives, including financial, customer, internal processes, and learning and growth. It goes beyond financial metrics to assess non-financial factors critical to long-term success, such as customer satisfaction and innovation.
- Option A is incorrect because Porter’s Five Forces is a strategic analysis framework, not a performance evaluation tool.
- Option C refers to risk analysis, focusing on how changes in variables affect outcomes.
- Option D relates to comparing financial data over time, which is only financial in nature and does not include non-financial metrics.

