
Infernce from Sample Statistics and Margin of Error

Inference from sample statistics is a fundamental concept in statistics that involves drawing conclusions about a population based on a sample taken from that population. This topic is essential for the Digital SAT Exam as it tests your understanding of how to make predictions and judgments using statistical data. One critical aspect of inference is the margin of error, which quantifies the uncertainty associated with the sample estimates. Understanding how to calculate and interpret the margin of error is crucial for making reliable inferences from sample data.
Learning Objectives
In this section, you will learn how to draw inferences from sample statistics and understand the concept of the margin of error. You will be able to calculate the margin of error for different confidence levels and sample sizes and interpret its significance in the context of statistical analysis. By the end of this section, you will be proficient in making informed decisions based on sample data and understanding the limitations and reliability of those decisions as tested on the Digital SAT Exam.
Inference from Sample Statistics
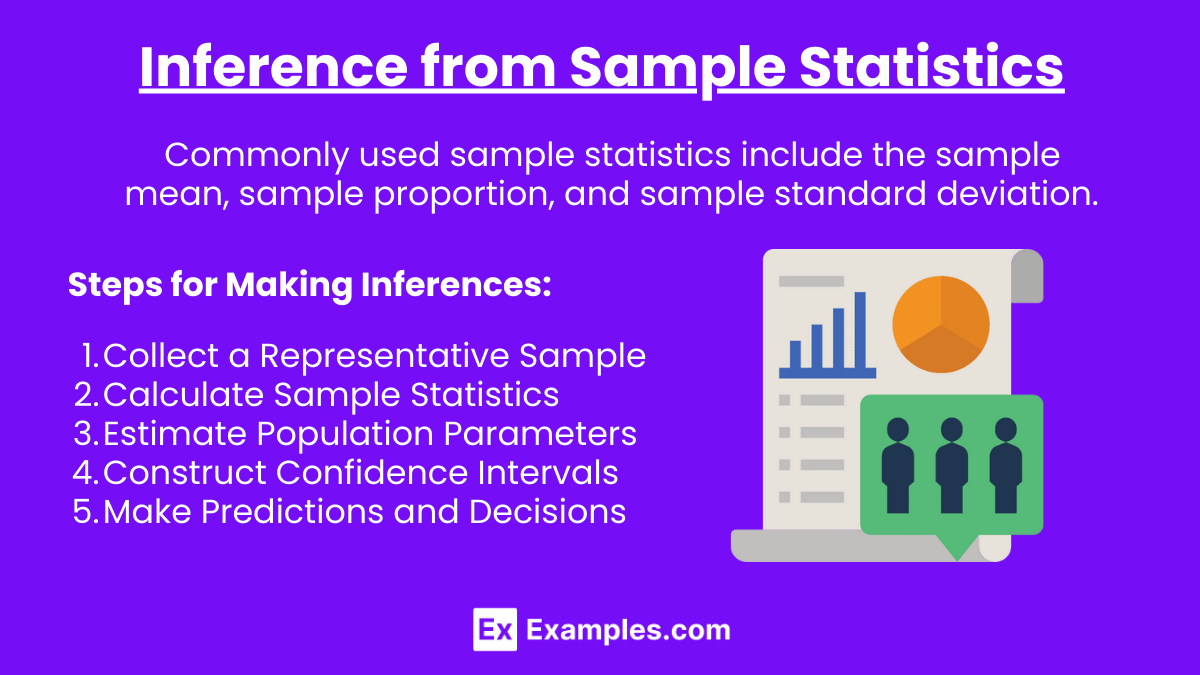
Inference involves using sample data to estimate population parameters. Commonly used sample statistics include the sample mean ( ), sample proportion (p), and sample standard deviation (s). These statistics provide insights into the population characteristics.
Steps for Making Inferences:
- Collect a Representative Sample: Ensure the sample is random and representative of the population.
- Calculate Sample Statistics: Compute the sample mean, proportion, and standard deviation.
- Estimate Population Parameters: Use sample statistics to make estimates about population parameters.
- Construct Confidence Intervals: Develop confidence intervals to express the precision of the estimates.
- Make Predictions and Decisions: Use the confidence intervals and other statistical measures to make informed predictions and decisions.
Margin of Error
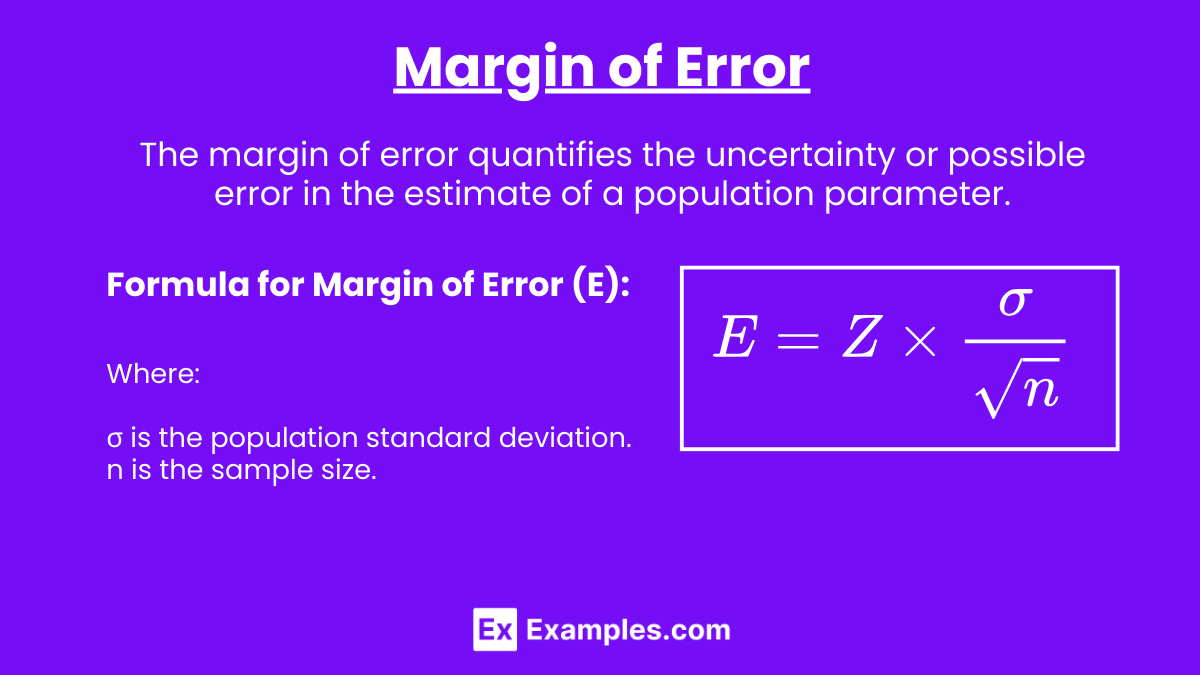
The margin of error quantifies the uncertainty or possible error in the estimate of a population parameter. It provides a range within which the true population parameter is expected to lie, with a certain level of confidence.
Formula for Margin of Error (E):
![\[ E = Z \times \frac{\sigma}{\sqrt{n}} \]](https://www.examples.com/wp-content/ql-cache/quicklatex.com-69c0470b0ac4053d2bc6bbccdbcdc83c_l3.png "Rendered by QuickLaTeX.com")
Where:
- Z is the Z-score corresponding to the desired confidence level (e.g., 1.96 for 95% confidence).
- σ is the population standard deviation.
- n is the sample size.
If the population standard deviation (σ) is unknown, the sample standard deviation (s) is used instead.
Key Concepts:
Confidence Level: The probability that the interval estimate contains the true population parameter (commonly 90%, 95%, or 99%).
Sample Size (n): Larger sample sizes result in a smaller margin of error, increasing the precision of the estimate.
Standard Deviation (σ or s): A measure of the variability or spread in the population or sample data.
Calculating and Interpreting the Margin of Error
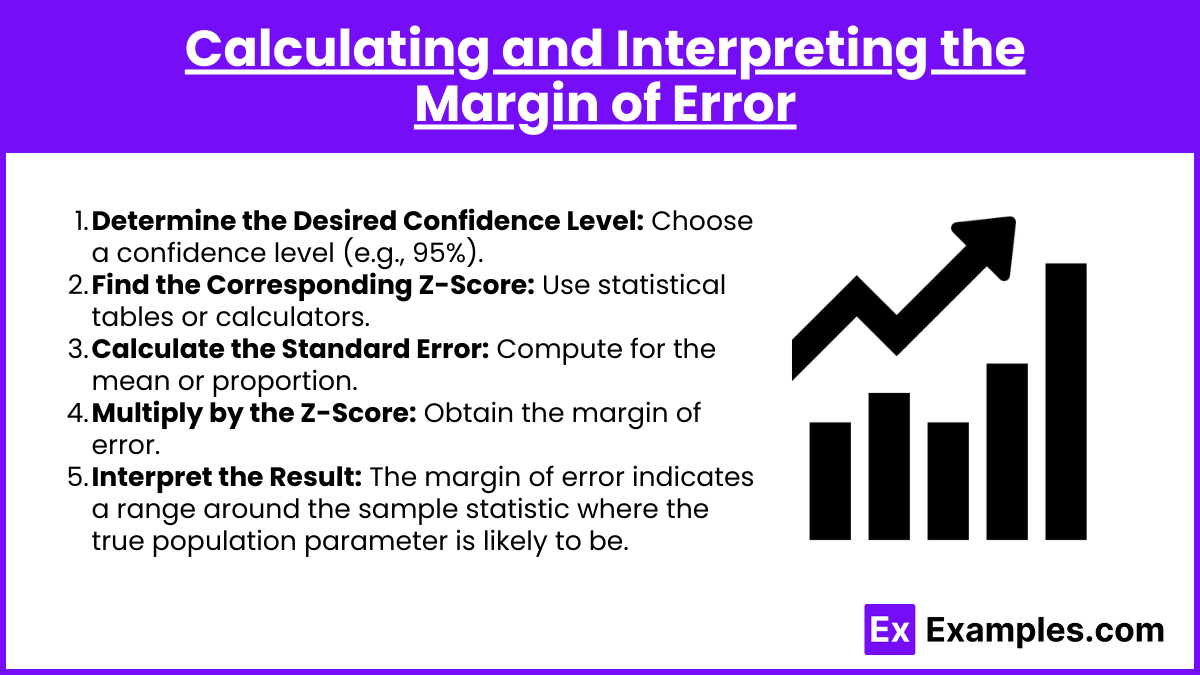
- Determine the Desired Confidence Level: Decide on the confidence level (e.g., 95%).
- Find the Corresponding Z-Score: Use statistical tables or calculators to find the Z-score for the chosen confidence level.
- Calculate the Standard Error: Compute the standard error of the mean or proportion.
- Multiply by the Z-Score: Multiply the standard error by the Z-score to obtain the margin of error.
- Interpret the Result: The margin of error provides a range around the sample statistic within which the true population parameter is expected to lie.
Example Calculations
Example 1: Mean
A sample of 100 students has a mean test score of 85 with a standard deviation of 10. Calculate the margin of error for a 95% confidence level.
![\[ E = 1.96 \times \frac{10}{\sqrt{100}} = 1.96 \times 1 = 1.96 \]](https://www.examples.com/wp-content/ql-cache/quicklatex.com-0c008bad1ca0eed50cda46c79fdbfac9_l3.png "Rendered by QuickLaTeX.com")
So, the margin of error is 1.96. The confidence interval is 85±1.96.
Example 2: Proportion
In a survey of 200 people, 120 support a new policy. Calculate the margin of error for a 90% confidence level.
![\[ \hat{p} = \frac{120}{200} = 0.6 \]](https://www.examples.com/wp-content/ql-cache/quicklatex.com-be2015ad069d94ea417e532a0ca586b2_l3.png "Rendered by QuickLaTeX.com")
![\[ \text{Standard Error} = \sqrt{\frac{0.6 \times 0.4}{200}} = 0.0346 \]](https://www.examples.com/wp-content/ql-cache/quicklatex.com-17031da8a05ed5fa88b97c68ad851522_l3.png "Rendered by QuickLaTeX.com")
For a 90% confidence level, Z=1.645.
Examples of Inference from Sample Statistics and Margin of Error
Example 1
A sample of 150 students has an average GPA of 3.4 with a standard deviation of 0.5. Calculate the margin of error for a 95% confidence level.
Solution:
![\[ E = 1.96 \times \frac{0.5}{\sqrt{150}} = 1.96 \times 0.0408 = 0.08 \]](https://www.examples.com/wp-content/ql-cache/quicklatex.com-ddbf03e6c85fc1bdab7349d4e926188f_l3.png "Rendered by QuickLaTeX.com")
Example 2
In a poll of 500 voters, 55% said they would vote for a particular candidate. Calculate the margin of error for a 95% confidence level.
Solution:
![\[ \hat{p} = 0.55 \]](https://www.examples.com/wp-content/ql-cache/quicklatex.com-0b282d3b9691537a2a2caf7efe88156e_l3.png "Rendered by QuickLaTeX.com")
![\[ \text{Standard Error} = \sqrt{\frac{0.55 \times 0.45}{500}} = 0.022 \]](https://www.examples.com/wp-content/ql-cache/quicklatex.com-c3b3776330dd25e910412a22cb43e763_l3.png "Rendered by QuickLaTeX.com")
![\[ E = 1.96 \times 0.022 = 0.043 \]](https://www.examples.com/wp-content/ql-cache/quicklatex.com-f125232185ad53d4be75de4571759688_l3.png "Rendered by QuickLaTeX.com")
Example 3
A study found that the average height of a sample of 75 plants is 15 inches with a standard deviation of 2 inches. Calculate the margin of error for a 99% confidence level.
Solution:
![\[ E = 2.576 \times \frac{2}{\sqrt{75}} = 2.576 \times 0.231 = 0.596 \]](https://www.examples.com/wp-content/ql-cache/quicklatex.com-089ca312f38a3dd41bbcdfa2127f90df_l3.png "Rendered by QuickLaTeX.com")
Example 4
A survey of 1,000 customers showed that 70% are satisfied with a product. Calculate the margin of error for a 90% confidence level.
Solution:
![\[ \hat{p} = 0.7 \]](https://www.examples.com/wp-content/ql-cache/quicklatex.com-ed2325dbe7404d4f2e178dfcb6ca7e19_l3.png "Rendered by QuickLaTeX.com")
![\[ \text{Standard Error} = \sqrt{\frac{0.7 \times 0.3}{1000}} = 0.0145 \]](https://www.examples.com/wp-content/ql-cache/quicklatex.com-220bee238fa98afaee71c1d3b82c7da8_l3.png "Rendered by QuickLaTeX.com")
E=1.645×0.0145=0.0238
Example 5
In a test of 80 machines, the average operational time was found to be 250 hours with a standard deviation of 30 hours. Calculate the margin of error for a 95% confidence level.
Solution:
![\[ E = 1.96 \times \frac{30}{\sqrt{80}} = 1.96 \times 3.354 = 6.574 \]](https://www.examples.com/wp-content/ql-cache/quicklatex.com-b68d76a731a38ca70b9116163d053e33_l3.png "Rendered by QuickLaTeX.com")
Practice Questions
Question 1
A sample of 120 students has a mean score of 78 on a math test with a standard deviation of 8. What is the margin of error for a 95% confidence level?
A) 1.43
B) 2.00
C) 1.96
D) 1.33
Answer: B
Explanation:
![\[ E = 1.96 \times \frac{8}{\sqrt{120}} = 1.96 \times 0.73 = 1.43 \]](https://www.examples.com/wp-content/ql-cache/quicklatex.com-e34b9b5d3b1ed82884e2697300fb5558_l3.png "Rendered by QuickLaTeX.com")
Question 2
In a survey of 400 people, 240 said they prefer online shopping. Calculate the margin of error for a 95% confidence level.
A) 0.024
B) 0.048
C) 0.032
D) 0.05
Answer: C
Explanation:
![\[ \hat{p} = \frac{240}{400} = 0.6 \]](https://www.examples.com/wp-content/ql-cache/quicklatex.com-c0b9bfd2fb5c12c10537fc27c55c41b2_l3.png "Rendered by QuickLaTeX.com")
![\[ \text{Standard Error} = \sqrt{\frac{0.6 \times 0.4}{400}} = 0.0245 \]](https://www.examples.com/wp-content/ql-cache/quicklatex.com-5e8caecfcac71435f4cd9c14ed930aa5_l3.png "Rendered by QuickLaTeX.com")
![\[ E=1.96×0.0245=0.048 \]](https://www.examples.com/wp-content/ql-cache/quicklatex.com-86d0cabb1f1d91dc1f485f9c35df41d4_l3.png "Rendered by QuickLaTeX.com")
Question 3
A sample of 50 devices has an average battery life of 10 hours with a standard deviation of 1.5 hours. What is the margin of error for a 99% confidence level?
A) 0.32
B) 0.54
C) 0.44
D) 0.65
Answer: B
Explanation:
![\[ E = 2.576 \times \frac{1.5}{\sqrt{50}} = 2.576 \times 0.212 = 0.546 \]](https://www.examples.com/wp-content/ql-cache/quicklatex.com-9142607acbddc71966b510b641b904ed_l3.png "Rendered by QuickLaTeX.com")