
Linear Equations in Two Variables

Linear equations in two variables, a cornerstone of algebra and a vital concept on the Digital SAT exam, are represented in the form ax+by=c, where a, b, and c are constants, and x and y are variables. These equations graph as straight lines on the coordinate plane and are used extensively in various fields such as physics, economics, engineering, and everyday problem-solving. A thorough understanding of linear equations in two variables is crucial for progressing to more advanced mathematical concepts and applications.
Learning Objectives
By studying linear equations in two variables, you will learn to recognize, formulate, and solve these equations both algebraically and graphically. They will develop the skills to analyze the relationships between variables, interpret the meaning of the slope and intercepts, and apply these concepts to real-life scenarios. Mastery of this topic will enable students to tackle more complex mathematical problems and enhance their logical and analytical thinking abilities.
Understanding Linear Equations in Two Variables
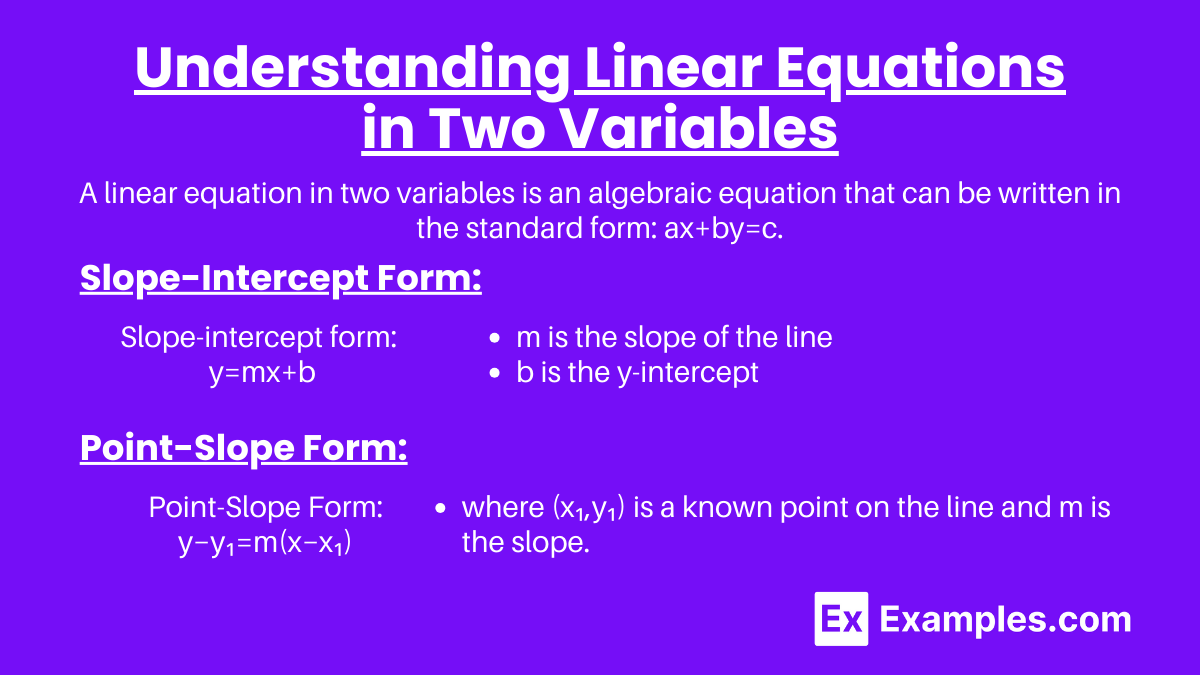
A linear equation in two variables is an algebraic equation that can be written in the standard form: ax+by=c where x and y are variables, and a, b, and c are constants with a and b not both being zero. This form represents a straight line when plotted on a Cartesian coordinate plane.
Standard Form
The standard form of a linear equation in two variables is: Ax+By=C where A, B, and C are integers, and A and B are not both zero. The standard form is particularly useful for quickly finding the intercepts of the line.
Slope-Intercept Form
Another useful form of a linear equation is the slope-intercept form: y=mx+b where:
- m is the slope of the line, representing the rate of change of y with respect to x.
- b is the y-intercept, representing the value of y when x is zero.
Point-Slope Form
The point-slope form of a linear equation is useful when you know a point on the line and the slope: y−y₁=m(x−x₁)
where (x₁,y₁) is a known point on the line and m is the slope.
Graphical Representation
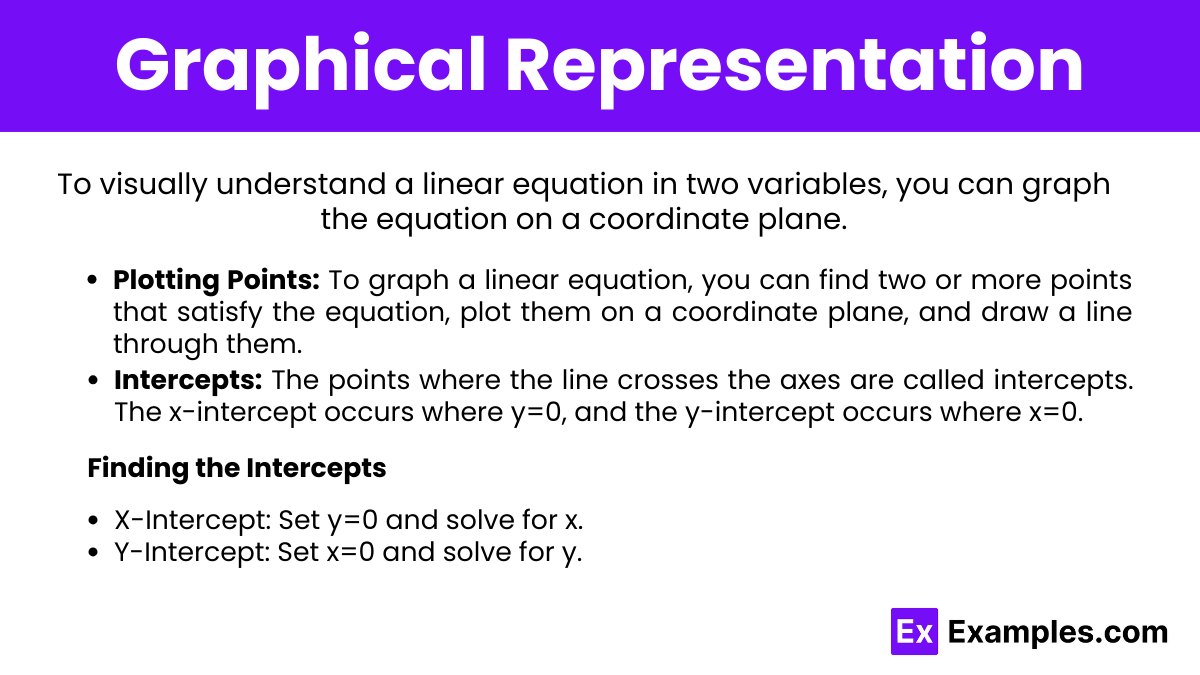
To visually understand a linear equation in two variables, you can graph the equation on a coordinate plane. Here’s how you can do it, step-by-step:
- Plotting Points: To graph a linear equation, you can find two or more points that satisfy the equation, plot them on a coordinate plane, and draw a line through them.
- Intercepts: The points where the line crosses the axes are called intercepts. The x-intercept occurs where y=0, and the y-intercept occurs where x=0.
Finding the Intercepts
- X-Intercept: Set y=0 and solve for x.
- Y-Intercept: Set x=0 and solve for y.
Solving Linear Equations in Two Variables
Solving linear equations in two variables involves finding the values of x and y that satisfy both equations simultaneously. There are three primary methods to solve such systems of equations: Substitution Method, Elimination Method, and Graphical Method. Below is a detailed explanation of each method.
Substitution Method
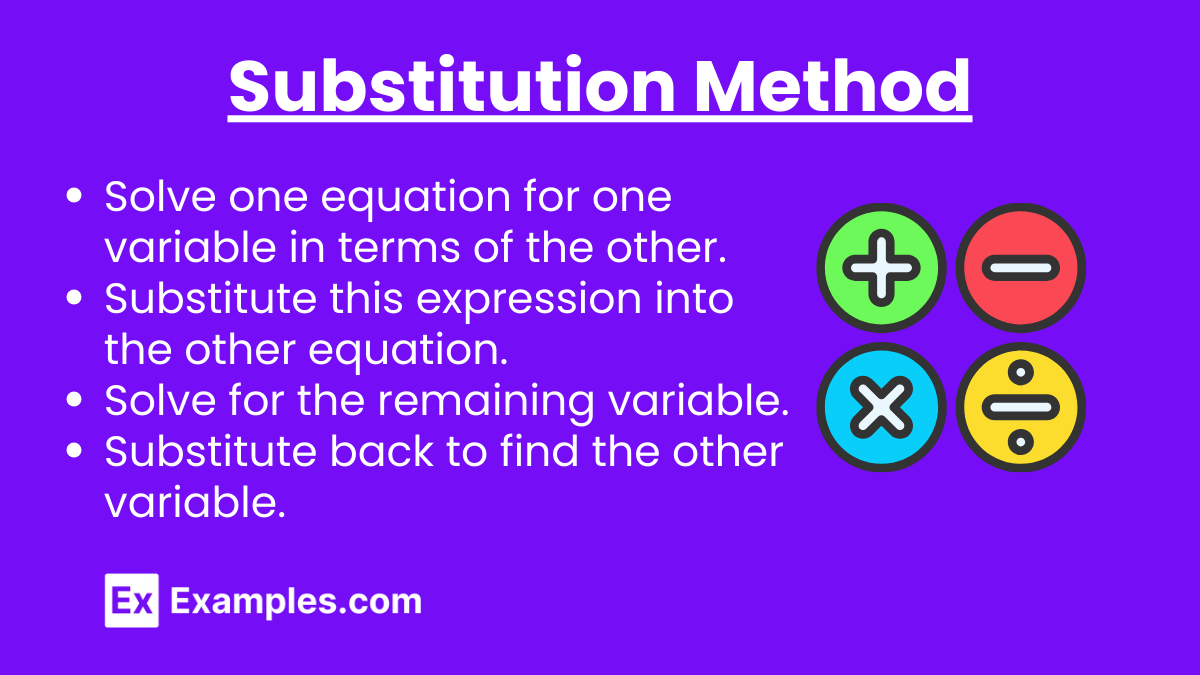
- Solve one equation for one variable in terms of the other.
- Substitute this expression into the other equation.
- Solve for the remaining variable.
- Substitute back to find the other variable.
Elimination Method
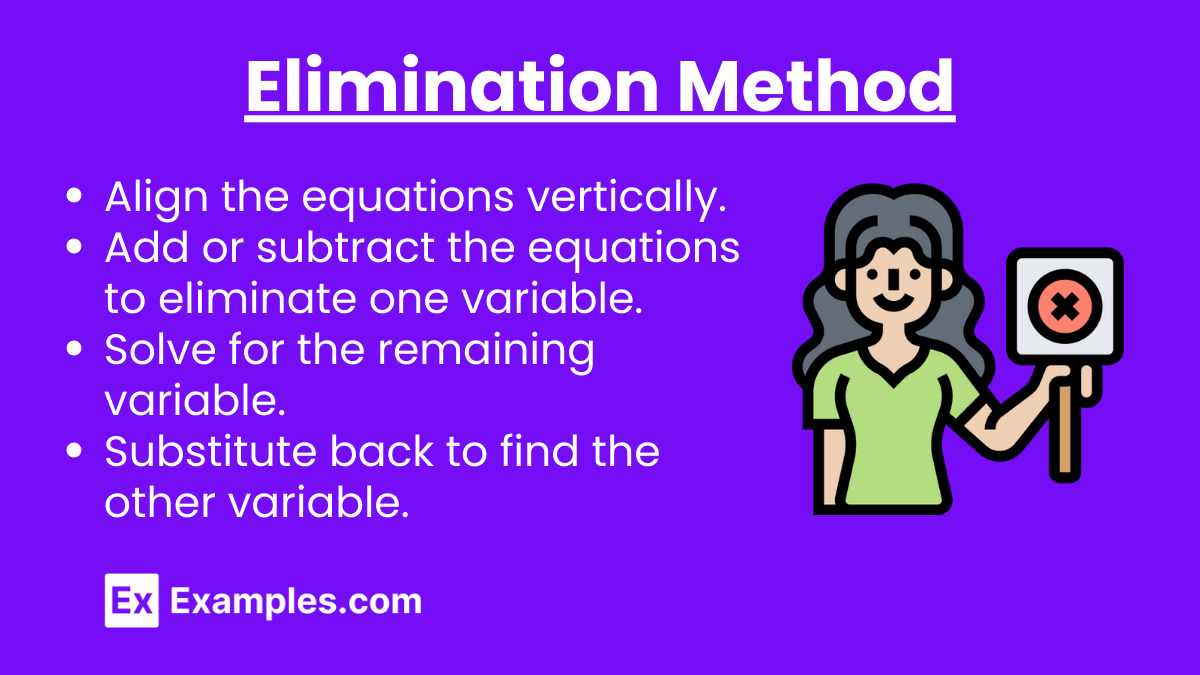
- Align the equations vertically.
- Add or subtract the equations to eliminate one variable.
- Solve for the remaining variable.
- Substitute back to find the other variable.
Graphical Method
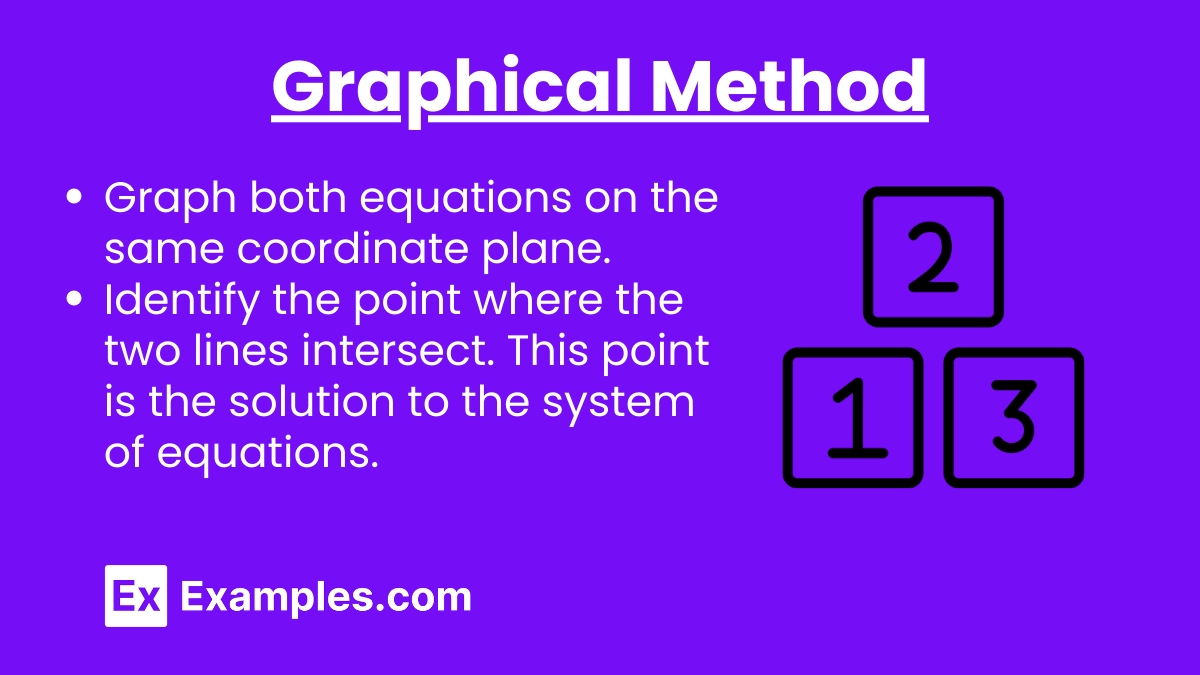
- Graph both equations on the same coordinate plane.
- Identify the point where the two lines intersect. This point is the solution to the system of equations.
Examples of Linear Equations in Two Variables
Example 1: 2x+3y=6
To solve this, we can find the intercepts:
- x-intercept: Set y=0.
2x+3(0)=6
2x=6
x=3 - y-intercept: Set x=0.
2(0)+3y=6
2(0) + 3y = 6
3y=6
y=2
Plotting these points (3,0) and (0,2) on the graph, we can draw the line representing this equation.
Example 2: −x+4y=8
- x-intercept: Set y=0.
−x+4(0)=8
−x=8
x=−8 - y-intercept: Set x=0.
−(0)+4y=8
-(0) + 4y = 8
4y=8
y=2
Plot these points (−8,0) and (0,2) on the graph and draw the line.
Example 3: 5x−2y=10
- x-intercept: Set y=0.
5x−2(0)=10
5x=10
x=2 - y-intercept: Set x=0.
5(0)−2y=10
−2y=10
y=−5
Plot these points (2,0) and (0,−5) on the graph and draw the line.
Example 4: 3x+y=7
- x-intercept: Set y=0.
3x+0=7
3x=7![\[x = \frac{7}{3}\]](https://www.examples.com/wp-content/ql-cache/quicklatex.com-5f820294d836f3be007b387f10f39a81_l3.png "Rendered by QuickLaTeX.com")
- y-intercept: Set x=0.
3(0)+y=7
y=7
Plot these points (
![\[(\frac{7}{3}\]](https://www.examples.com/wp-content/ql-cache/quicklatex.com-b7dfee9cb9eb8745528c29aa26046282_l3.png "Rendered by QuickLaTeX.com")
Example 5: x−5y=−15
- x-intercept: Set y=0.
x−5(0)=−15
x=−15 - y-intercept: Set x=0.
0−5y=−15
−5y=−15
y=3
Plot these points (−15,0) and (0,3) on the graph and draw the line.
Practice Questions for Linear Equations in Two Variables
Practice Question 1:
Solve for x and y in the equation 3x+4y=12.
A) (0,3)
B) (4,−3)
C) (2,1.5)
D) (1,2.25)
Answer: C
Explanation:
Substitute x=2 and y=1.5 into the equation:
3(2)+4(1.5)=6+6=12
Thus, (2,1.5) is a solution to the equation 3x+4y=12.
Practice Question 2:
Determine the intercepts and graph the equation 5x−y=155x – y = 155x−y=15.
A) (3,−5) and (0,15)
B) (0,−15) and (3,0)
C) (3,0) and (0,−15)
D) (0,15) and (−3,0)
Answer: C
Explanation:
- x-intercept: Set y=0.
5x−0=15
5x=15
x=3 - y-intercept: Set x=0.
5(0)−y=15
−y=15
y=−15
Thus, the intercepts are (3,0) and (0,−15).
Practice Question 3:
Find the solution to the system of equations:
x+2y=8
2x−y=3
A) (3,2.5)
B) (1,3.5)
C) (2,3)
D) (3,2)
Answer: D
Explanation:
Solve the first equation for x:
x+2y=8
x=8−2y
Substitute into the second equation:
2(8−2y)−y=3
16−4y−y=3
16−5y=3
−5y=−13
y=2.6
Substitute y=2 back into x=8−2y:
x=8−2(2)
x=4
So, x=3 and y=2, the solution is (3,2).