
Linear Functions


![\[m = \frac{\Delta y}{\Delta x} = \frac{y_2 - y_1}{x_2 - x_1}\]](https://www.examples.com/wp-content/ql-cache/quicklatex.com-a19e7ea3d196a93b713bf30579584b9e_l3.svg "Rendered by QuickLaTeX.com")
 and
and  are two points on the line.
![\[m = \frac{6 - 2}{3 - 1} = \frac{4}{2} = 2\]](https://www.examples.com/wp-content/ql-cache/quicklatex.com-6723c1e1a27368f2eddcd021721d7cf4_l3.svg "Rendered by QuickLaTeX.com")
![\[m = \frac{y_2 - y_1}{x_2 - x_1}\]](https://www.examples.com/wp-content/ql-cache/quicklatex.com-63a477054fef8a72084ce76ef11389c3_l3.svg "Rendered by QuickLaTeX.com")
 and the slope to solve for the y-intercept (b) using the point-slope formula:
![\[y - y_1 = m(x - x_1)\]](https://www.examples.com/wp-content/ql-cache/quicklatex.com-aa847822938e1d0a0c339c33e261c5ff_l3.svg "Rendered by QuickLaTeX.com")
![\[m = \frac{8 - 4}{4 - 2} = \frac{4}{2} = 2\]](https://www.examples.com/wp-content/ql-cache/quicklatex.com-f8d4b6c3310fea19dd8b0e196fd28252_l3.svg "Rendered by QuickLaTeX.com")
![\[\frac{1}{2}x-2\]](https://www.examples.com/wp-content/ql-cache/quicklatex.com-f8a5bb81c16d76333a6792f194769bc7_l3.svg "Rendered by QuickLaTeX.com")
Linear functions are a fundamental concept in algebra that students need to master for success in mathematics and real-world applications. Understanding linear functions involves learning how to interpret, graph, and manipulate equations of lines, which are essential skills tested on the Digital SAT. Mastery of linear functions not only prepares students for this exam but also builds a foundation for more advanced mathematical topics like algebra, helping them develop critical thinking and problem-solving skills required in various academic and professional fields.
Learning Objectives
By the end of this topic, you should be able to understand the definition and components of linear functions, identify and interpret the slope and y-intercept, graph linear functions accurately, solve problems involving linear functions such as finding the equation of a line given points, and apply linear functions to real-world scenarios.
Equation and Components
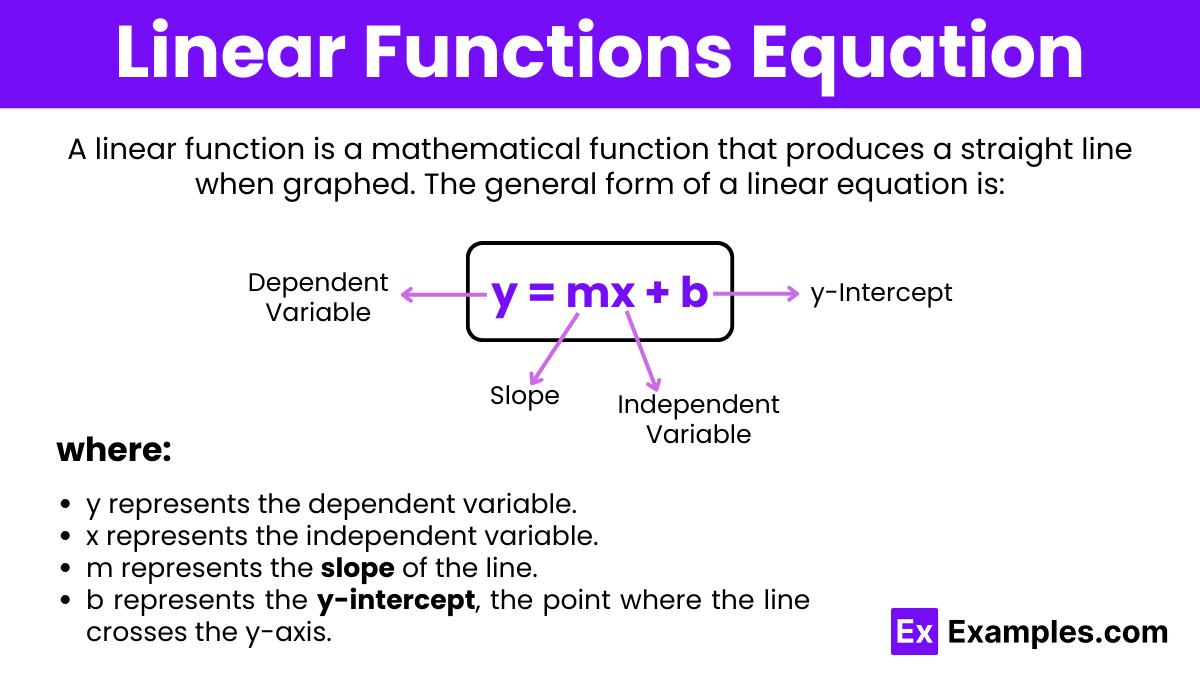
A linear function is a mathematical function that produces a straight line when graphed. The general form of a linear equation is:
where:
y represents the dependent variable.
x represents the independent variable.
m represents the slope of the line.
b represents the y-intercept, the point where the line crosses the y-axis.
Slope
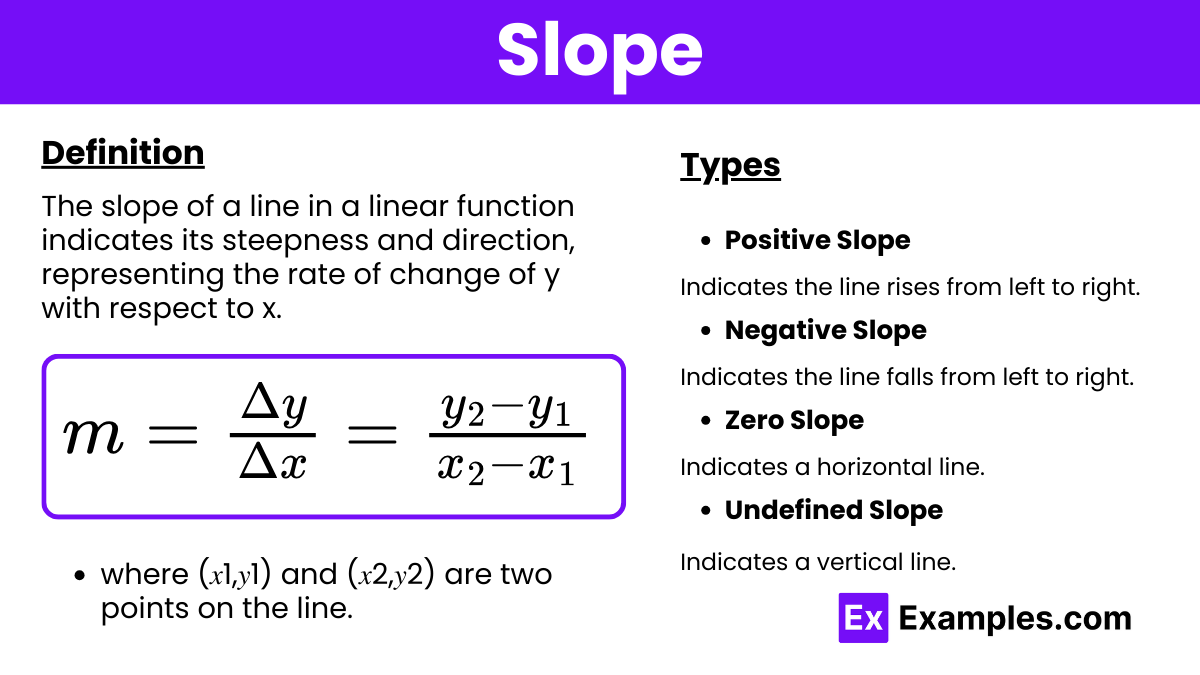
The slope of a line in a linear function measures the steepness and the direction of the line. It represents the rate of change of the dependent variable (y) with respect to the independent variable (x). Mathematically, the slope (m) is the ratio of the vertical change (rise) to the horizontal change (run) between two distinct points on the line.
Formula
The slope is calculated using the following formula:
m = \frac{\Delta y}{\Delta x} = \frac{y_2 - y_1}{x_2 - x_1}
where and are two points on the line.
Positive Slope: Indicates the line rises from left to right.
Negative Slope: Indicates the line falls from left to right.
Zero Slope: Indicates a horizontal line.
Undefined Slope: Indicates a vertical line.
Example
Consider the points (1, 2) and (3, 6):
m = \frac{6 - 2}{3 - 1} = \frac{4}{2} = 2
Y-Intercept
The y-intercept of a line is the point where the line crosses the y-axis. It represents the value of the dependent variable (y) when the independent variable (x) is zero. The y-intercept is denoted by b in the equation of a line y = mx + b.
Identification
To find the y-intercept from the equation y = mx + b , set x = 0:
y = m(0) + b
y = b
So, the y-intercept is the constant term b in the linear equation.
Example
Consider the linear equation y = 2x + 3:
When x = 0:
y = 2(0) + 3
y = 3
The y-intercept is 3, meaning the line crosses the y-axis at the point (0, 3)
Graphing Linear Functions
To graph a linear function, follow these steps:
Identify the slope (m) and y-intercept (b) from the equation y = mx + b.
Plot the y-intercept (0,b) on the graph.
From the y-intercept, use the slope to determine another point on the line. Move up/down by the slope's numerator (rise) and right/left by its denominator (run).
Draw a straight line through the points.
There are two ways to graph a linear function:
By finding two points on it.
By using its slope and y-intercept.
Example
Graph the linear function y = 2x + 3:
Slope (m): 2
Y-Intercept (b): 3
Plot the point (0, 3). From this point, use the slope to find another point: move up 2 units (rise) and right 1 unit (run) to (1, 5). Draw a line through these points.
Graphing a Linear Function by Finding Two Points
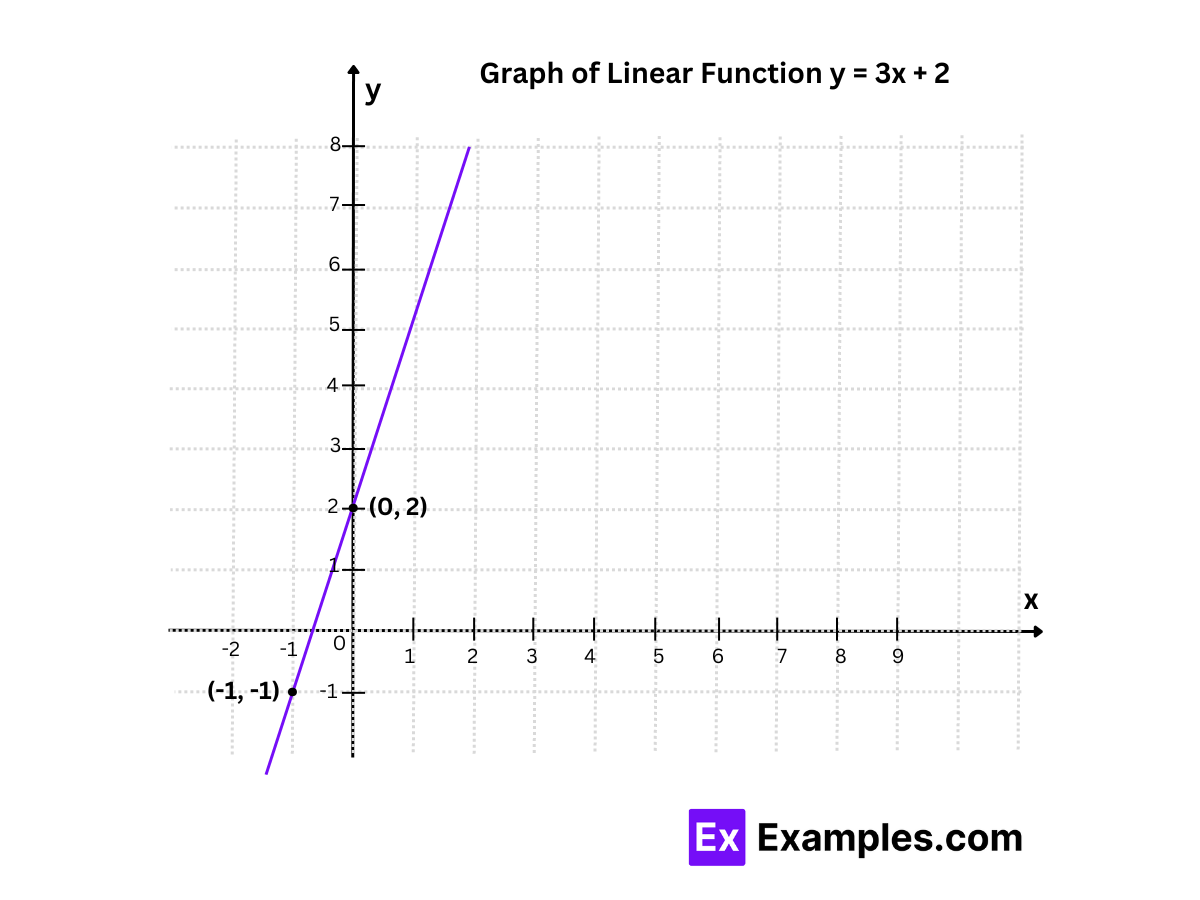
To find any two points on a linear function (line) f(x) = mx + b, we just assume some random values for 'x' and substitute these values in the function to find the corresponding values for y. The process is explained with an example where we are going to graph the function f(x) = 3x + 2.
Step 1: Find two points on the line by taking some random values. We will assume that x = -1 and x = 0.
Step 2: Substitute each of these values in the function to find the corresponding y-values. Here is the table of the linear function y = 3x + 2
x | y |
-1 | 3(-1) + 2 = -1 |
0 | 3(0) + 2 = 2 |
Therefore, two points on the line are (-1, -1) and (0, 2).
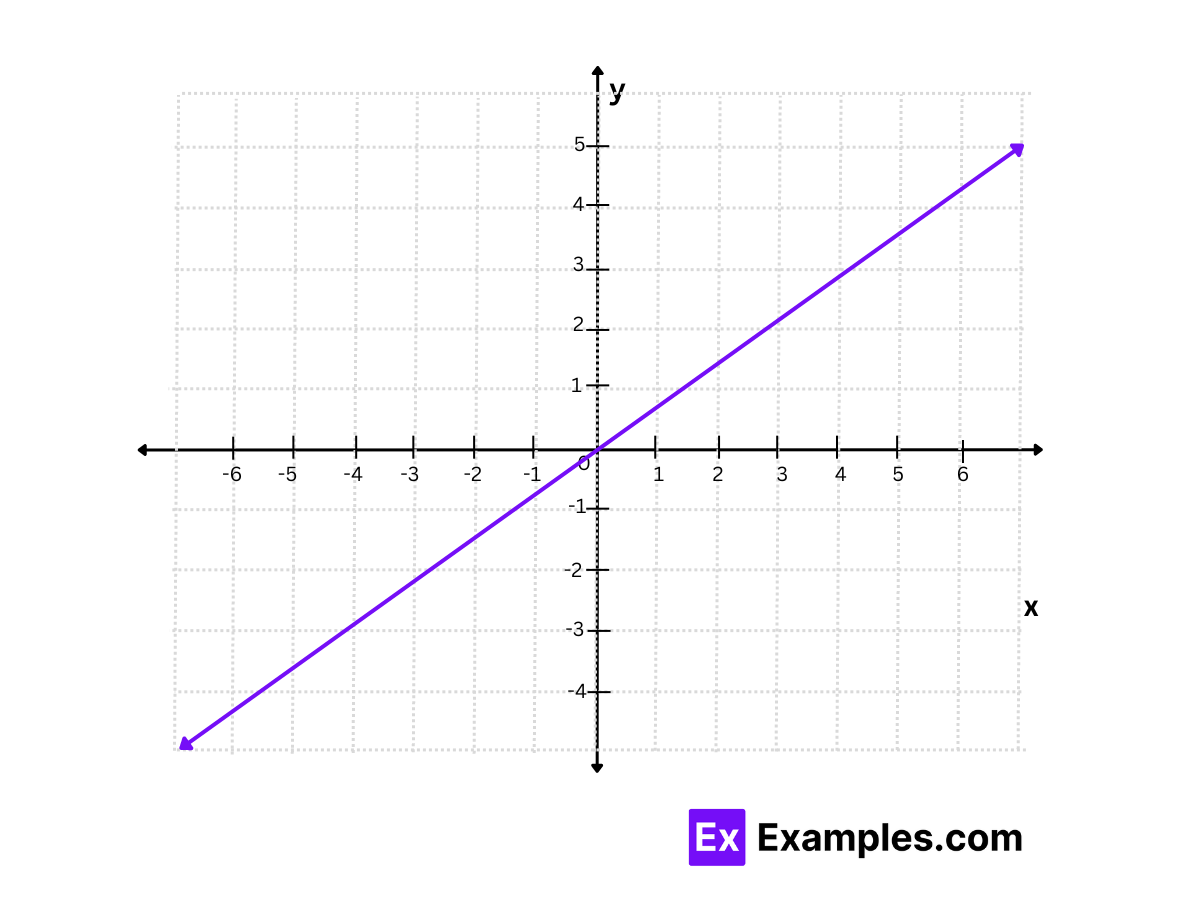
Step 3: Plot the points on the graph and join them by a line. Also, extend the line on both sides.
Finding the Equation of a Line
To find the equation of a line given two points, follow these steps:
Calculate the slope (m) using the formula:
m = \frac{y_2 - y_1}{x_2 - x_1}
Use one of the points and the slope to solve for the y-intercept (b) using the point-slope formula:
y - y_1 = m(x - x_1)
Rearrange this equation to the slope-intercept form y=mx+b.
Example
Find the equation of the line passing through (2, 4) and (4, 8):
Calculate the slope:
m = \frac{8 - 4}{4 - 2} = \frac{4}{2} = 2
Use point (2, 4):
y−4=2(x−2)
y−4=2x−4
y=2x
Real-World Applications
Linear functions are used to model situations with a constant rate of change. For example:
Finance: Calculating simple interest over time.
Physics: Representing constant speed as distance over time.
Economics: Determining total cost based on a constant production rate.
Practice Problems
Find the slope and y-intercept of the line given by y=−3x+5.
Graph the linear function y = \frac{1}{2}x-2.
Determine the equation of the line that passes through the points (1, 2) and (3, 6).
Explain a real-world scenario where a linear function could be used, and create an equation to represent it.
Summary
Linear functions are fundamental in algebra and various real-world applications. Mastery of this topic involves understanding the slope and y-intercept, graphing linear equations, finding the equation of a line given points, and applying linear functions to practical scenarios.