
Linear Inequalities in One or Two Variables

Linear inequalities are mathematical expressions involving a linear function that use inequality symbols (<, >, ≤, ≥) instead of an equal sign. They describe a range of possible solutions rather than a single solution. Understanding linear inequalities is crucial for solving problems related to various fields, including economics, engineering, and social sciences. This topic is particularly important for standardized tests like the Digital SAT.
Learning Objectives
For “Linear Inequalities in One or Two Variables,” you should learn to solve and graph linear inequalities, interpret solution sets, and use interval notation. Understand how to apply inequalities to real-world scenarios, solve systems of linear inequalities, and graph their solutions in two variables. Additionally, practice interpreting the results in context and recognizing the impact of different inequality symbols on solution sets to prepare thoroughly for the Digital SAT exam.
Linear Inequalities in One Variable
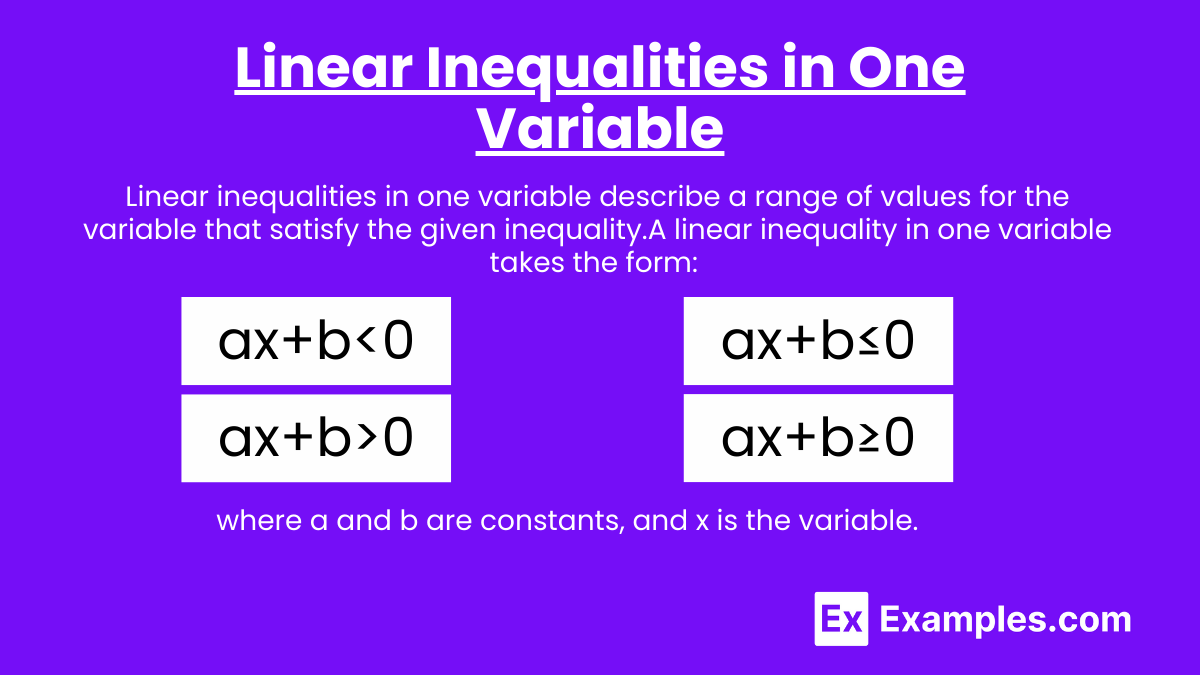
Linear inequalities in one variable describe a range of values for the variable that satisfy the given inequality. Unlike linear equations that have a single solution, inequalities have multiple solutions that form an interval on the number line. A linear inequality in one variable takes the form:
ax+b<0
ax+b≤0
ax+b>0
ax+b≥0
where a and b are constants, and x is the variable.
Solving Linear Inequalities in One Variable
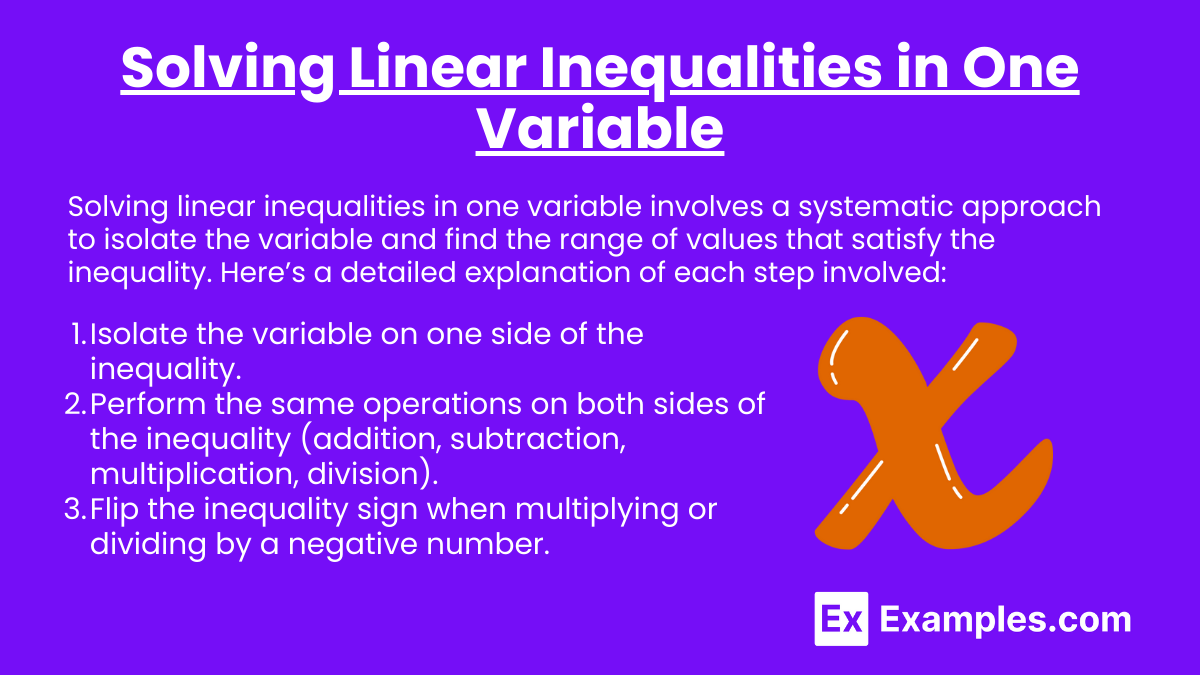
Solving linear inequalities in one variable involves a systematic approach to isolate the variable and find the range of values that satisfy the inequality. Here’s a detailed explanation of each step involved:
- Isolate the variable on one side of the inequality.
- Perform the same operations on both sides of the inequality (addition, subtraction, multiplication, division).
- Flip the inequality sign when multiplying or dividing by a negative number.
Example 1
Solve the inequality: 3x−5>1.
Solution:
3x−5>1
3x>1+5
3x>6
x>2
The solution is x>2.
Graphical Representation
The solution can be represented on a number line:
- Draw a number line.
- Mark the point x=2.
- Shade the region to the right of x=2 (not including 2).
Example 2
Solve the inequality: −2x+4≤.8
Solution
−2x+4≤8
−2x≤8−4
−2x≤4
x≥−2 (flip the inequality sign when dividing by -2)
The solution is x≥−2.
Graphical Representation
- Draw a number line.
- Mark the point x=−2.
- Shade the region to the right of x=−2 (including -2).
Linear Inequalities in Two Variables
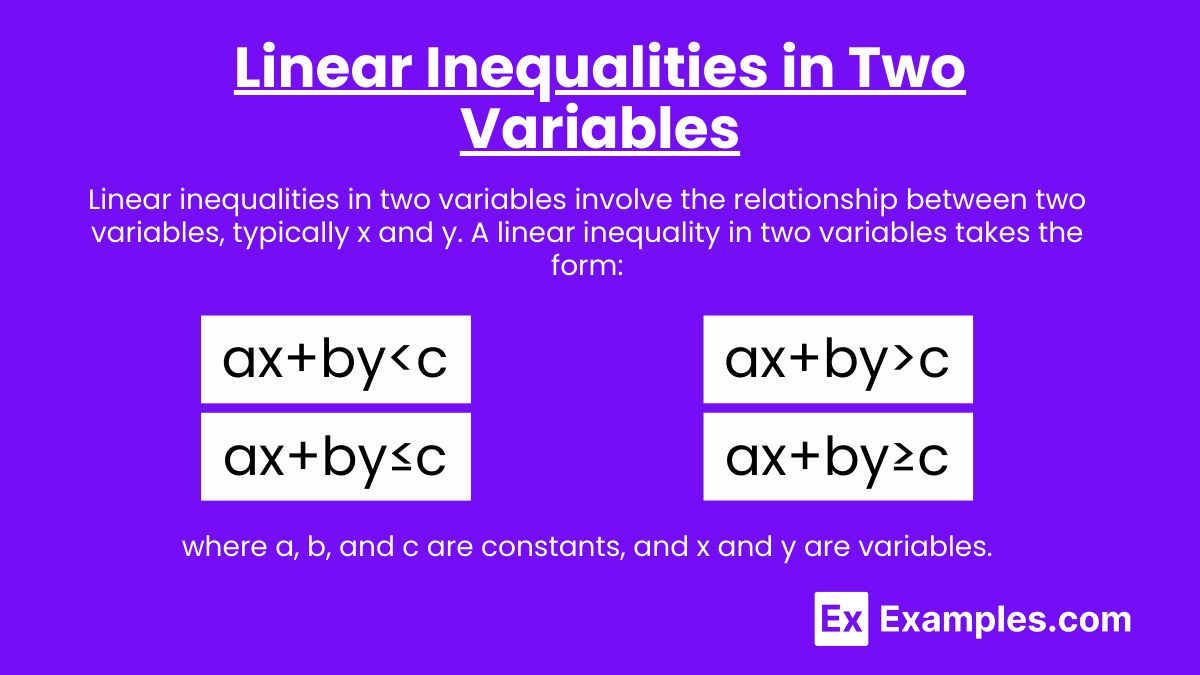
Linear inequalities in two variables involve the relationship between two variables, typically x and y. Unlike linear equations in two variables that represent a line, linear inequalities represent a region of the coordinate plane. This region can be above, below, or to one side of the line defined by the corresponding equation. A linear inequality in two variables takes the form:
ax+by<c
ax+by≤c
ax+by>c
ax+by≥c
where a, b, and c are constants, and x and y are variables.
Graphing Linear Inequalities in Two Variables
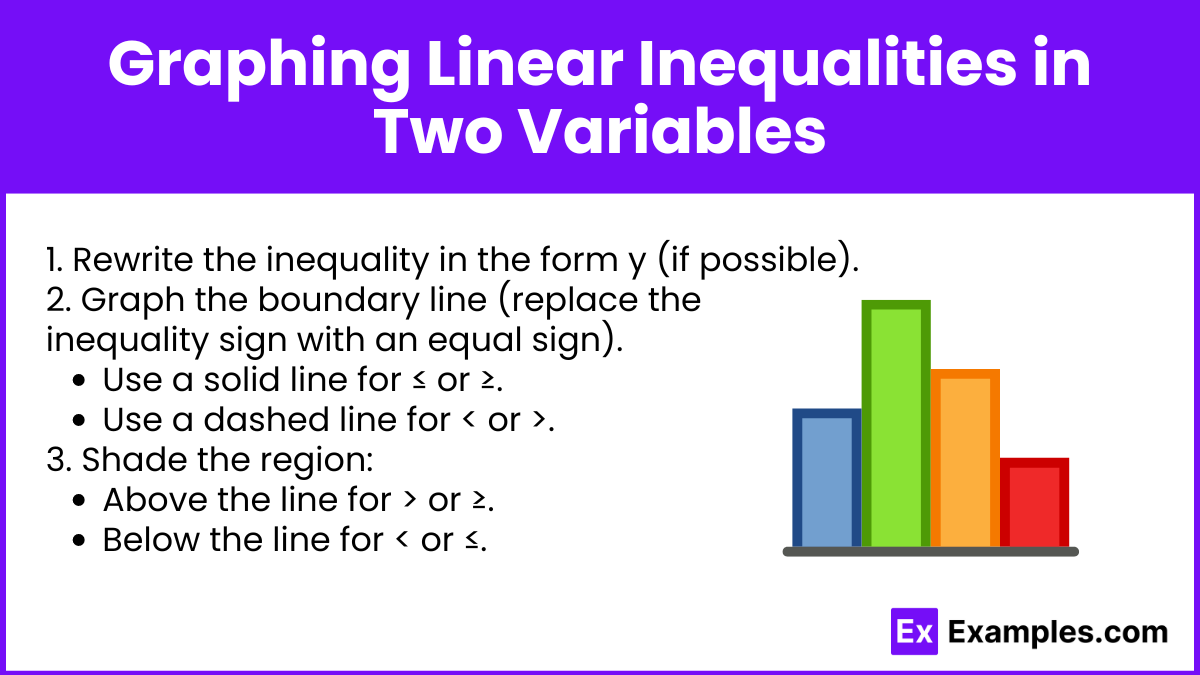
- Rewrite the inequality in the form y (if possible).
- Graph the boundary line (replace the inequality sign with an equal sign).
- Use a solid line for ≤ or ≥.
- Use a dashed line for < or >.
- Shade the region:
- Above the line for > or ≥.
- Below the line for < or ≤.
Example 1
Graph the inequality: y<2x+3.
Solution:
- Rewrite as y=2x+3 (boundary line).
- Graph the line y=2x+3 using a dashed line.
- Shade the region below the line.
Example 2
Graph the inequality: y≥−x+1.
Solution:
- Rewrite as y=−x+1 (boundary line).
- Graph the line y=−x+1 using a solid line.
- Shade the region above the line.
System of Linear Inequalities
A system of linear inequalities consists of multiple linear inequalities. The solution to the system is the region where the shaded areas overlap.
Example
Solve the system:
y≤2x+1
y>−x+4
Solution:
- Graph y≤2x+1 (solid line, shade below).
- Graph y>−x+4 (dashed line, shade above).
- The solution is the region where the shaded areas overlap.
Examples of Linear Inequalities in One or Two Variables
Example 1: One Variable
Solve the inequality 5x−3>2.
Solution:
5x−3>2
5x>2+3
5x>5
x>1
Explanation:
- Add 3 to both sides to isolate the term with x.
- Divide both sides by 5 to solve for x.
- The solution is x>1, which means x can be any number greater than 1.
Example 2: One Variable
Solve the inequality −4x+7≤15.
Solution:
−4x+7≤15
−4x≤15−7
−4x≤8
x≥−2 (flip the inequality sign when dividing by -4)
Explanation:
- Subtract 7 from both sides to isolate the term with x.
- Divide both sides by -4, and remember to flip the inequality sign.
- The solution is x≥−2, which means x can be any number greater than or equal to -2.
Example 3: Two Variables
Graph the inequality y<3x−1.
Solution:
- Rewrite the inequality as y=3x−1 (boundary line).
- Graph the line y=3x−1 using a dashed line.
- Test a point, such as (0,0): 0<3(0)−1 0<−1 (False)
- Since the test point does not satisfy the inequality, shade the region below the line.
Explanation:
- Graph the boundary line as a dashed line because the inequality is strict (<).
- Test a point to determine which side of the line to shade.
- Shade the region below the line to represent the solution set.
Example 4: Two Variables
Graph the inequality y≥−2x+4.
Solution:
- Rewrite the inequality as y=−2x+4 (boundary line).
- Graph the line y=−2x+4 using a solid line.
- Test a point, such as (0,0): 0≥−2(0)+4 0≥4 (False)
- Since the test point does not satisfy the inequality, shade the region above the line.
Explanation:
- Graph the boundary line as a solid line because the inequality is inclusive (≥).
- Test a point to determine which side of the line to shade.
- Shade the region above the line to represent the solution set.
Example 5: System of Inequalities
Solve the system:
y≤x+2
y>−x+1
Solution:
- Graph y≤x+2 (solid line, shade below).
- Graph y>−x+1 (dashed line, shade above).
- The solution is the region where the shaded areas overlap.
Explanation:
- Graph each inequality separately.
- Use a solid line for y≤x+2 and a dashed line for y>−x+1.
- Shade the appropriate regions for each inequality.
- The solution set is the overlapping shaded region.
Practice Questions
Practice Question 1: One Variable
Solve the inequality 3x+2<8.
A. x<2
B. x<3
C. x<9
D. x<1
Answer: A
Explanation:
3x+2<8
3x<8−2
3x<6
x<2
So, the correct answer is A: x<2.
Practice Question 2: Two Variables
Graph the inequality y≤−x+4. Which of the following points is a solution to the inequality?
A. (3, 1)
B. (2, 3)
C. (0, 5)
D. (-1, 6)
Answer: B
Explanation:
We need to test each point to see if it satisfies the inequality y≤−x+4:
- For (3, 1):
1≤−3+4
1≤1 (True) - For (2, 3):
3≤−2+4
3≤2 (False) - For (0, 5):
5≤−0+4
5≤4 (False) - For (-1, 6):
6≤−(−1)+4
6≤5 (False)
The correct answer is B: (2, 3).
Practice Question 3: One Variable
Solve the inequality −2x+5≥1.
A. x≤2
B. x≤3
C. x≤21
D. x≤4
Answer: A
Explanation:
−2x+5≥1
−2x≥1−5
−2x≥−4
x≤−2−4 (flip the inequality sign when dividing by -2) x≤2
So, the correct answer is A: x≤2.