Nonlinear functions are a crucial concept in mathematics, particularly in algebra and calculus. Understanding nonlinear functions is essential for performing well on the Digital SAT Exam, as these types of functions frequently appear in various problems. Unlike linear functions, which have a constant rate of change and graph as straight lines, nonlinear functions have rates of change that vary. This variability leads to graphs that can curve, twist, or take on shapes other than straight lines. Nonlinear functions encompass a wide range of types, including quadratic, exponential, and logarithmic functions, each with distinct characteristics and behaviors.
Learning Objectives
In this section, you will learn to identify and analyze different types of nonlinear functions, understand their properties, and graph them accurately. You will also learn to solve equations involving nonlinear functions and apply these concepts to real-world problems. By the end of this section, you will be able to confidently handle nonlinear functions on the Digital SAT Exam.
Types of Nonlinear Functions
Quadratic Functions
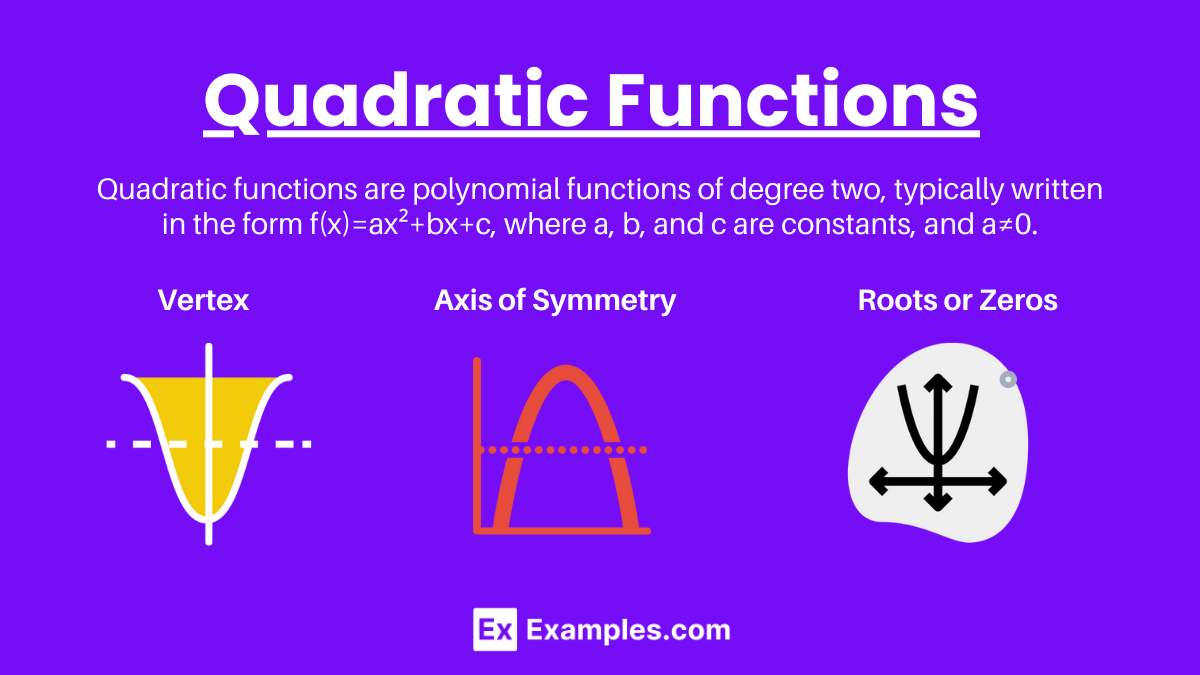
Quadratic functions are polynomial functions of degree two, typically written in the form f(x)=ax²+bx+c, where a, b, and c are constants, and a≠0. The graph of a quadratic function is a parabola, which can open upwards or downwards depending on the sign of a.
Key Features:
- Vertex: The highest or lowest point of the parabola.
- Axis of Symmetry: A vertical line that passes through the vertex.
- Roots or Zeros: The x-values where the function intersects the x-axis.
Exponential Functions
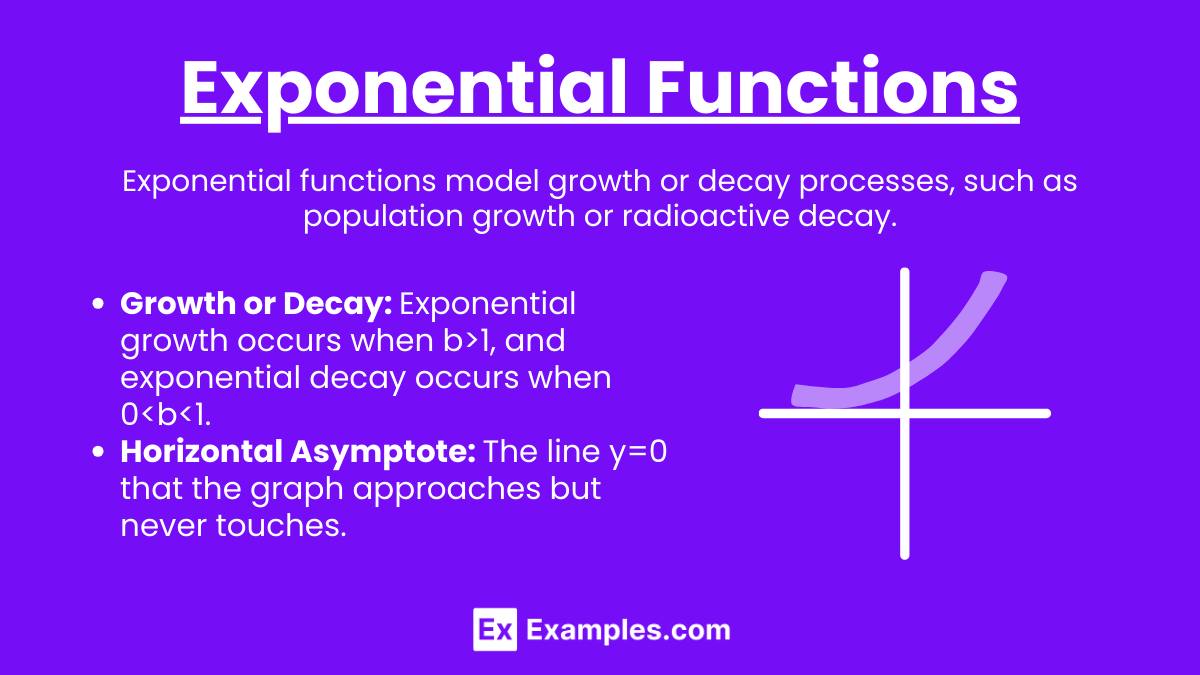
Exponential functions have the form f(x)=abˣ, where a is a constant, b is the base of the exponential (a positive real number), and x is the exponent. Exponential functions model growth or decay processes, such as population growth or radioactive decay.
Key Features:
- Growth or Decay: Exponential growth occurs when b>1, and exponential decay occurs when 0<b<1.
- Horizontal Asymptote: The line y=0 that the graph approaches but never touches.
Logarithmic Functions
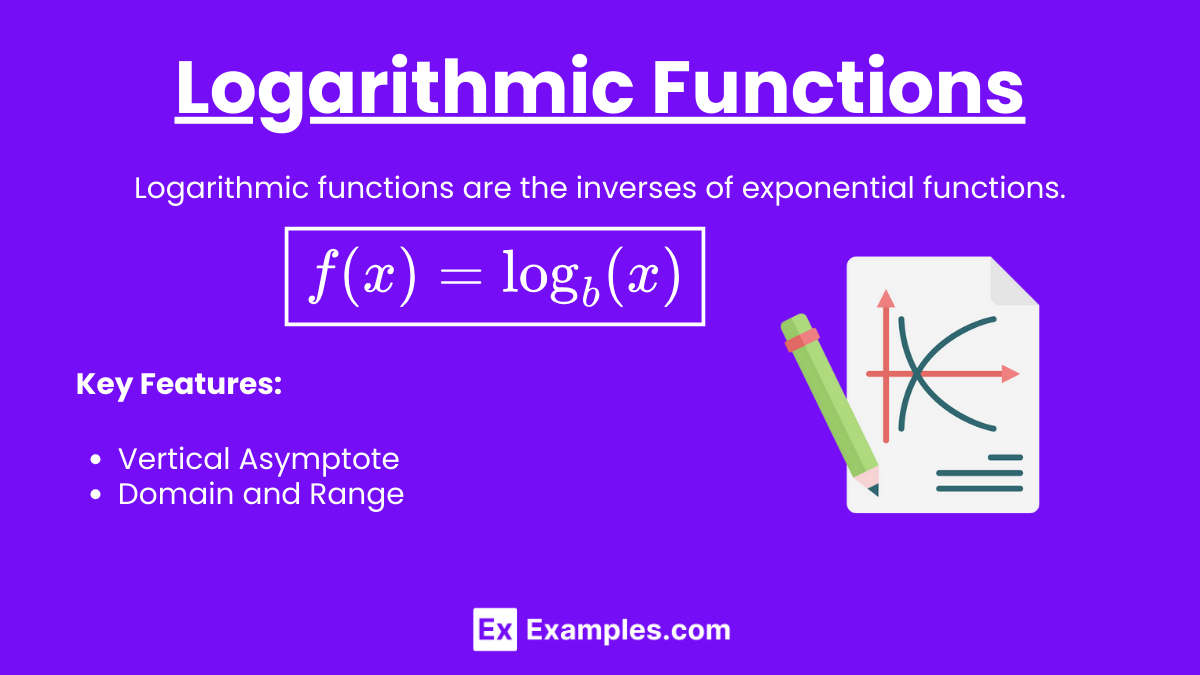
Logarithmic functions are the inverses of exponential functions and are written as
![]()
Key Features:
- Vertical Asymptote: The line x=0 that the graph approaches but never touches.
- Domain and Range: The domain is (0,∞) and the range is (−∞,∞).
Properties of Nonlinear Functions

Domain and Range
The domain of a function is the set of all possible input values (x-values) for which the function is defined. The range is the set of all possible output values (y-values). For nonlinear functions, the domain and range can vary widely and are often determined by the specific type of function.
Asymptotes
An asymptote is a line that a graph approaches but never touches. Nonlinear functions, such as rational, exponential, and logarithmic functions, often have asymptotes that provide important information about the behavior of the graph.
Intercepts
Intercepts are the points where the graph of a function crosses the axes. The x-intercepts (or roots) are the values of x where the function equals zero. The y-intercept is the value of the function when x equals zero.
End Behavior
The end behavior of a function describes how the function behaves as x approaches positive or negative infinity. For example, the end behavior of a quadratic function f(x)=ax²+bx+c depends on the sign of a. If a>0, the function rises to infinity as x approaches positive or negative infinity. If a<0, the function falls to negative infinity as x approaches positive or negative infinity.
Graphing Nonlinear Functions
Quadratic Functions
To graph a quadratic function, identify the vertex, axis of symmetry, and roots. Plot these points and draw a smooth curve through them to form the parabola.
Exponential Functions
To graph an exponential function, plot points by substituting different values of x into the function. Identify the horizontal asymptote and use it as a guide to draw the graph.
Logarithmic Functions
To graph a logarithmic function, identify the vertical asymptote and plot points by substituting different values of x. Use the vertical asymptote as a guide to draw the graph.
Solving Nonlinear Equations
Quadratic Equations
Quadratic equations can be solved using various methods:
- Factoring: Express the quadratic equation in factored form and solve for the roots.
- Quadratic Formula: Use the formula
to find the roots.![Rendered by QuickLaTeX.com \[ x = \frac{-b \pm \sqrt{b^2 - 4ac}}{2a} \]](https://www.examples.com/wp-content/ql-cache/quicklatex.com-87c4851bee53959f6667d1e864e82cc3_l3.png)
- Completing the Square: Rewrite the quadratic equation in the form (x−p)²=q and solve for x.
Exponential Equations
To solve exponential equations, use logarithms to isolate the exponent. For example, to solve abx=c, take the logarithm of both sides and use properties of logarithms to solve for x.
Logarithmic Equations
To solve logarithmic equations, use exponentiation to eliminate the logarithm. For example, to solve logb(x)=c, rewrite the equation as bc=x.
Real-World Applications
Nonlinear functions are used in various real-world applications, such as:
- Physics: Describing the motion of objects under the influence of gravity (quadratic functions).
- Biology: Modeling population growth (exponential functions).
- Economics: Analyzing compound interest (exponential functions).
- Engineering: Designing structures with parabolic arches (quadratic functions).
By mastering nonlinear functions, you will be better prepared to tackle a wide range of problems on the Digital SAT Exam and in real-world scenarios.
Examples of Nonlinear Functions
Example 1: Quadratic Function
Given the quadratic function f(x)=2x²−4x+1, identify the vertex, axis of symmetry, and roots.
- Vertex: Use the vertex formula
. Here,![Rendered by QuickLaTeX.com \[ x = -\frac{b}{2a} \]](https://www.examples.com/wp-content/ql-cache/quicklatex.com-997be25afa1f19b74e668199cd5a7b12_l3.png)
 and
and  .
.
Substitute x=1 back into the function to find y: f(1)=2(1)²−4(1)+1=−1.
So, the vertex is (1,−1). - Axis of Symmetry: The vertical line x=1.
- Roots: Solve the equation
using the quadratic formula![Rendered by QuickLaTeX.com \[ 2x^2 - 4x + 1 = 0 \]](https://www.examples.com/wp-content/ql-cache/quicklatex.com-8d6a983f6f8e648c85b7b1f0ec8eea2d_l3.png)
.![Rendered by QuickLaTeX.com \[ x = \frac{-b \pm \sqrt{b^2 - 4ac}}{2a} \]](https://www.examples.com/wp-content/ql-cache/quicklatex.com-87c4851bee53959f6667d1e864e82cc3_l3.png)
Here, ,
,  , and
, and  .
.
![]()
Example 2: Exponential Function
Given the exponential function f(x)=3⋅2ˣ, determine its growth rate and horizontal asymptote.
- Growth Rate: Since the base of the exponent is 2 (greater than 1), this is an exponential growth function.
- Horizontal Asymptote: The line y=0 is the horizontal asymptote.
Example 3: Logarithmic Function
Given the logarithmic function f(x)=log₃(x), identify the vertical asymptote and domain.
- Vertical Asymptote: The line x=0 is the vertical asymptote.
- Domain: The domain of f(x)=log₃(x) is (0,∞).
Example 4: Rational Function
Given the rational function
![]()
- Vertical Asymptote: Set the denominator equal to zero: x−2=0, so x=2.
- Horizontal Asymptote: As x approaches infinity, the function approaches zero, so the horizontal asymptote is y=0.
Example 5: Cubic Function
Given the cubic function f(x)=x³−3x²+2x, determine the x-intercepts and end behavior.
- X-Intercepts: Solve x³−3x²+2x=0 by factoring:
x(x²−3x+2)=0. x(x−1)(x−2)=0,
so the x-intercepts are x=0, x=1, and x=2. - End Behavior: As x approaches positive or negative infinity, f(x) will also approach positive or negative infinity, respectively, following the behavior of x³.
Practice Questions
Question 1
Which of the following is the vertex form of the quadratic function f(x)=3x²−6x+2?
A) f(x)=3(x−1)²−1
B) f(x)=3(x+1)²−1
C) f(x)=3(x−1)²+2
D) f(x)=3(x+1)²+2
Answer: A
Explanation:
To convert the quadratic function f(x)=3x²−6x+2 to vertex form, we complete the square. f(x)=3(x²−2x)+2.
Add and subtract 1 inside the parentheses:
f(x)=3(x²−2x+1−1)+2.
Factor the perfect square trinomial:
f(x)=3((x−1)²−1)+2.
Distribute and simplify:
f(x)=3(x−1)²−3+2.
f(x)=3(x−1)²−1.
Question 2
What is the horizontal asymptote of the function
![]()
A) y=3
B) y=5
C) y=2
D) y=0
Answer: D
Explanation:
As x approaches infinity, the term 2ˣ grows much faster than the constant 3. Therefore, the fraction
![]()
Question 3
Which of the following functions represents exponential decay?
A) f(x)=4⋅3ˣ
B) f(x)=2⋅(0.5)ˣ
C) f(x)=−2x²+5
D) f(x)=log₂(x)
Answer: B
Explanation:
Exponential decay occurs when the base of the exponent is between 0 and 1. In option B, the base is 0.5, indicating exponential decay. Option A represents exponential growth, option C is a quadratic function, and option D is a logarithmic function.


