20+ Data Analysis Report Examples to Download
A Data Analysis Report is a comprehensive document that presents insights derived from the analysis of raw data. It plays a crucial role in helping businesses, researchers, and decision-makers make informed choices based on data trends, patterns, and findings. By focusing on data analysis, the report highlights key metrics, evaluates outcomes, and supports strategic planning.
Whether you are assessing business performance, tracking customer behavior, or identifying market opportunities, a well-structured data analysis report ensures clarity and accuracy. This type of analysis transforms complex datasets into meaningful information, enabling actionable insights that drive growth and efficiency. Understanding the purpose and process of data analysis is essential for creating impactful reports. By utilizing effective techniques, you can uncover valuable insights that contribute to better decision-making and long-term success.
What Is Data Analysis Report?
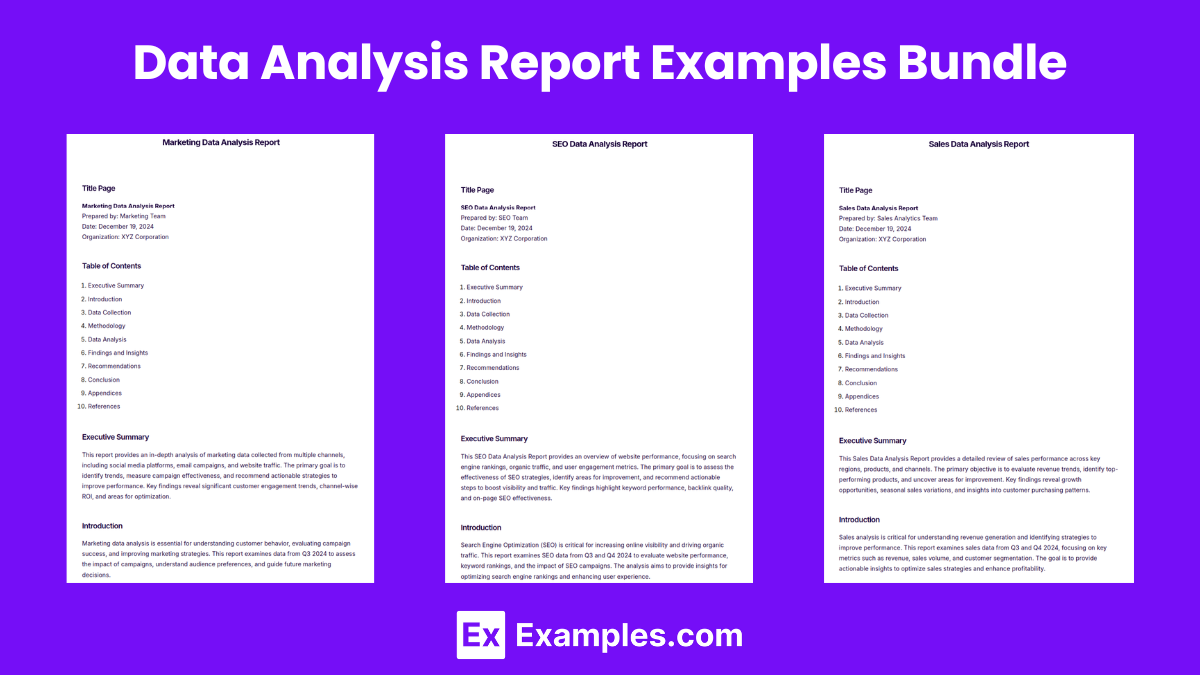
Data Analysis Report Examples Bundle
Data Analysis Report Format
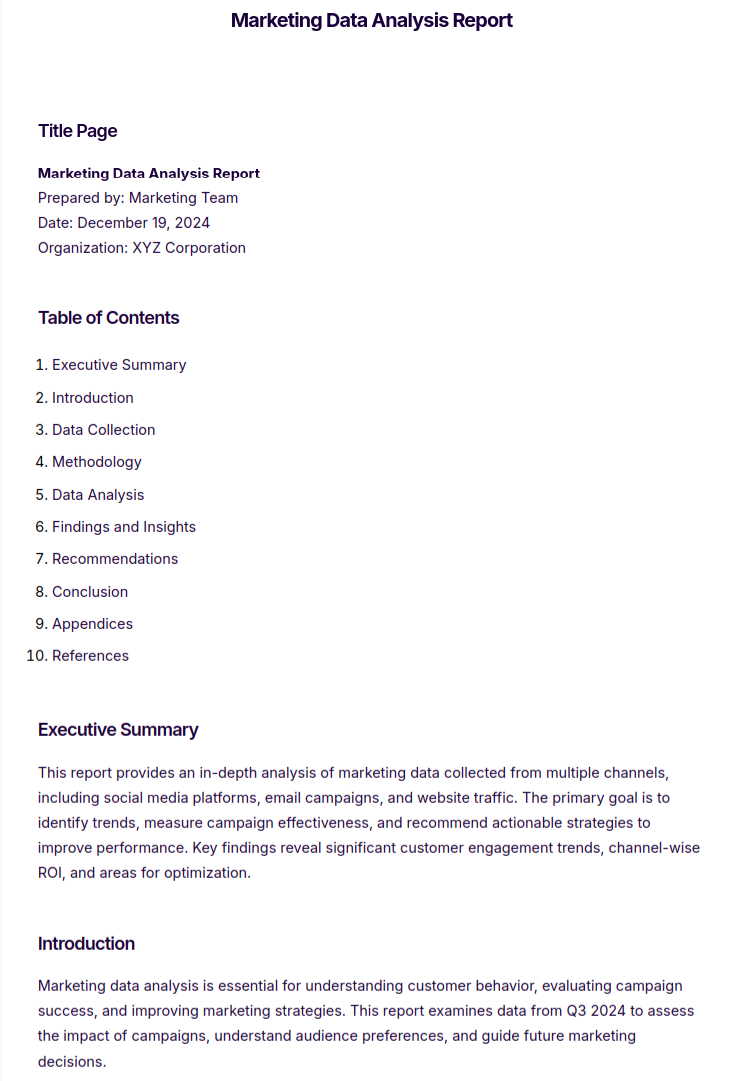
1. Title Page
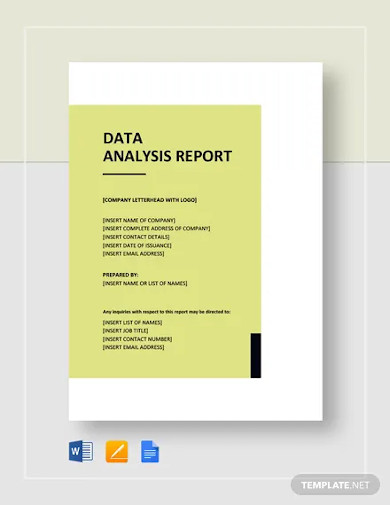
The title page should include the report’s title, the name of the author or team, the submission date, and the name of the client or organization if applicable. This provides a clear and professional introduction to the document.
2. Table of Contents
The table of contents helps readers navigate the report easily by listing all sections and their respective page numbers. It ensures quick access to specific parts of the analysis.
3. Executive Summary
The executive summary provides a brief overview of the report, summarizing the key findings, methodologies, and recommendations. It is designed to give readers a snapshot of the entire report without diving into the details.
4. Introduction
The introduction explains the purpose of the analysis, provides background or context for the data, and outlines the objectives of the report. This section sets the stage for the rest of the document.
5. Data Collection
This section describes where the data came from, how it was gathered, and any limitations or challenges encountered during the collection process. It ensures transparency in the data used for analysis.
6. Methodology
The methodology section outlines the techniques or tools used for data analysis. It includes details about statistical methods, software applications, or specific approaches taken, along with the reasoning behind these choices.
7. Data Analysis
The data analysis section presents the results of the examination, using charts, graphs, or tables to illustrate key trends and patterns. This section provides explanations of the findings and highlights their significance.
8. Findings and Insights
This section delves into the key outcomes of the analysis and interprets the results in the context of the report’s objectives. It focuses on what the data reveals and its implications for decision-making.
9. Recommendations
Based on the analysis, this section provides actionable steps or strategies to address the findings. Recommendations are practical and aligned with the objectives outlined earlier in the report.
10. Conclusion
The conclusion summarizes the report, emphasizing the significance of the findings and the overall impact of the analysis. It serves as a closing reflection on the value of the data analysis.
11. Appendices
If needed, appendices include additional charts, graphs, or raw data that support the analysis but are not included in the main body of the report. This section ensures that all supplementary information is accessible.
12. References
The references section lists all the data sources, citations, or external materials used in the report. It maintains the credibility and reliability of the analysis.
Marketing Data Analysis Report
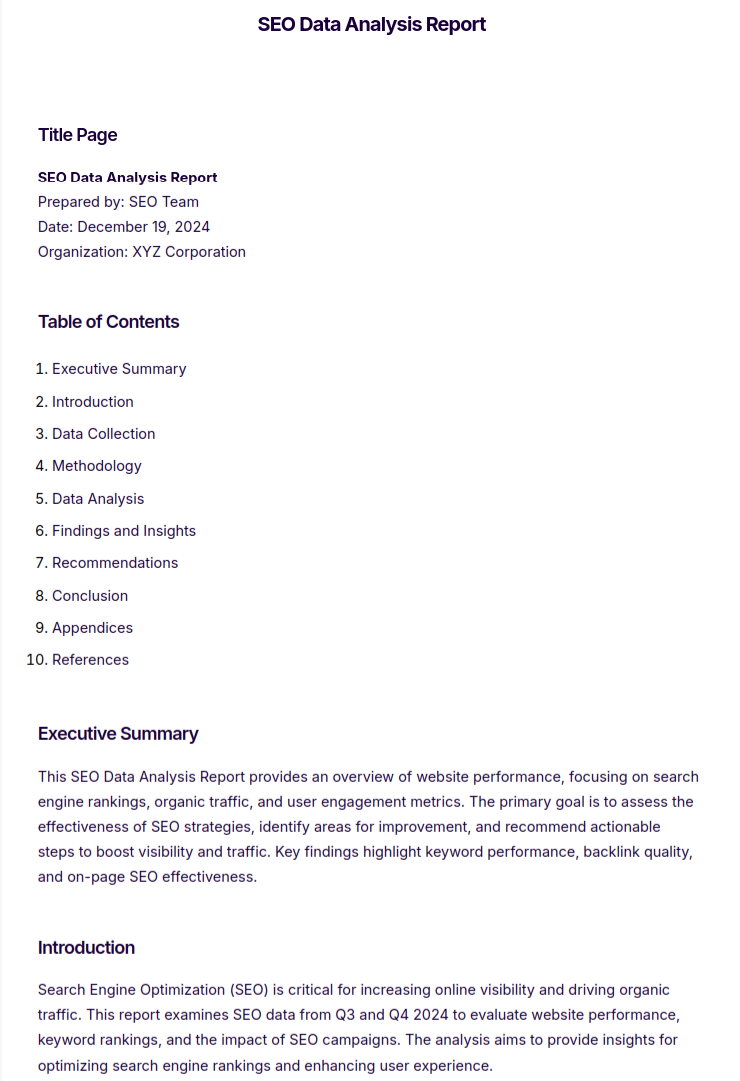
SEO Data Analysis Report
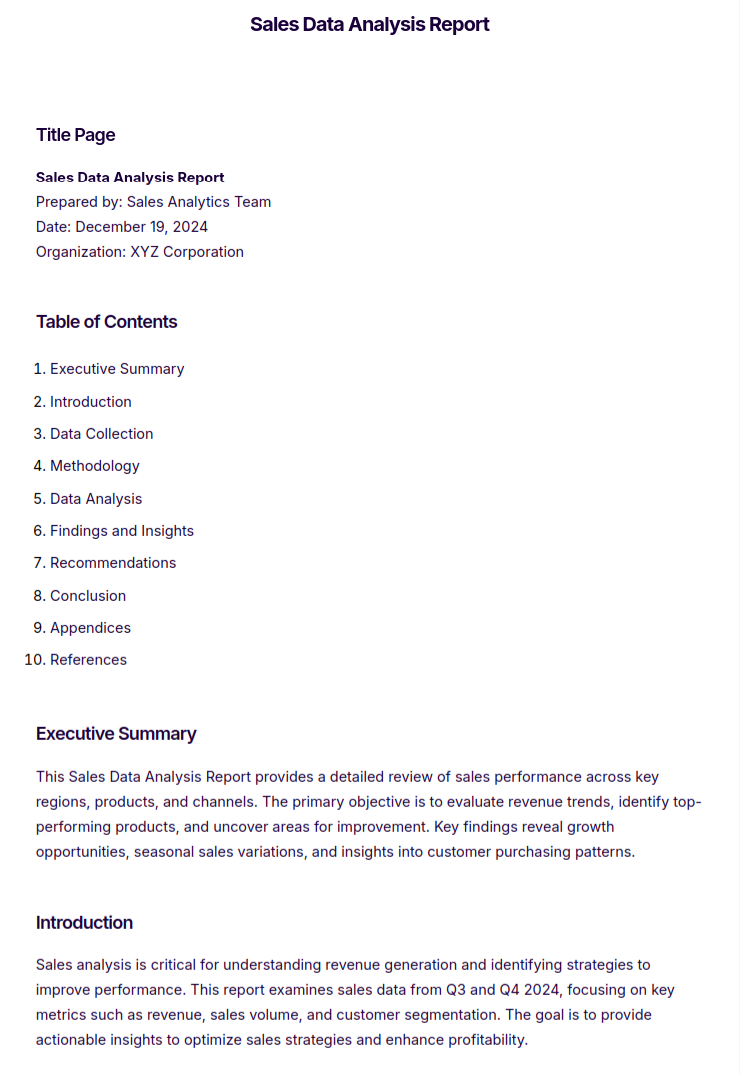
Sales Data Analysis Report
More Examples on Data Analysis Report
- Customer Support Data Analysis Report
Help Desk Data Analysis Report - Ecommerce Data Analysis Report
- Project Management Data Analysis Report
- Social Media Data Analysis Report
- Data Analysis Report of Global Warming
Data Analysis Report Template
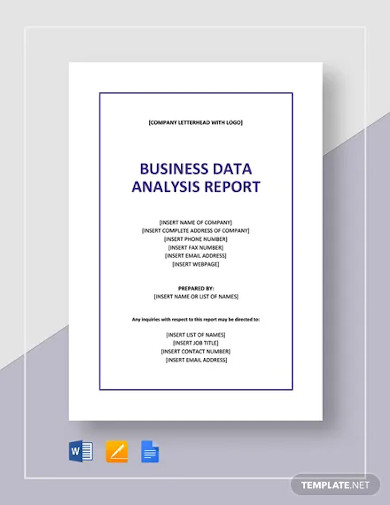
Business Data Analysis Report Template
Data Reporting Analyst Resume Template
Data Analysis Report Structure Example
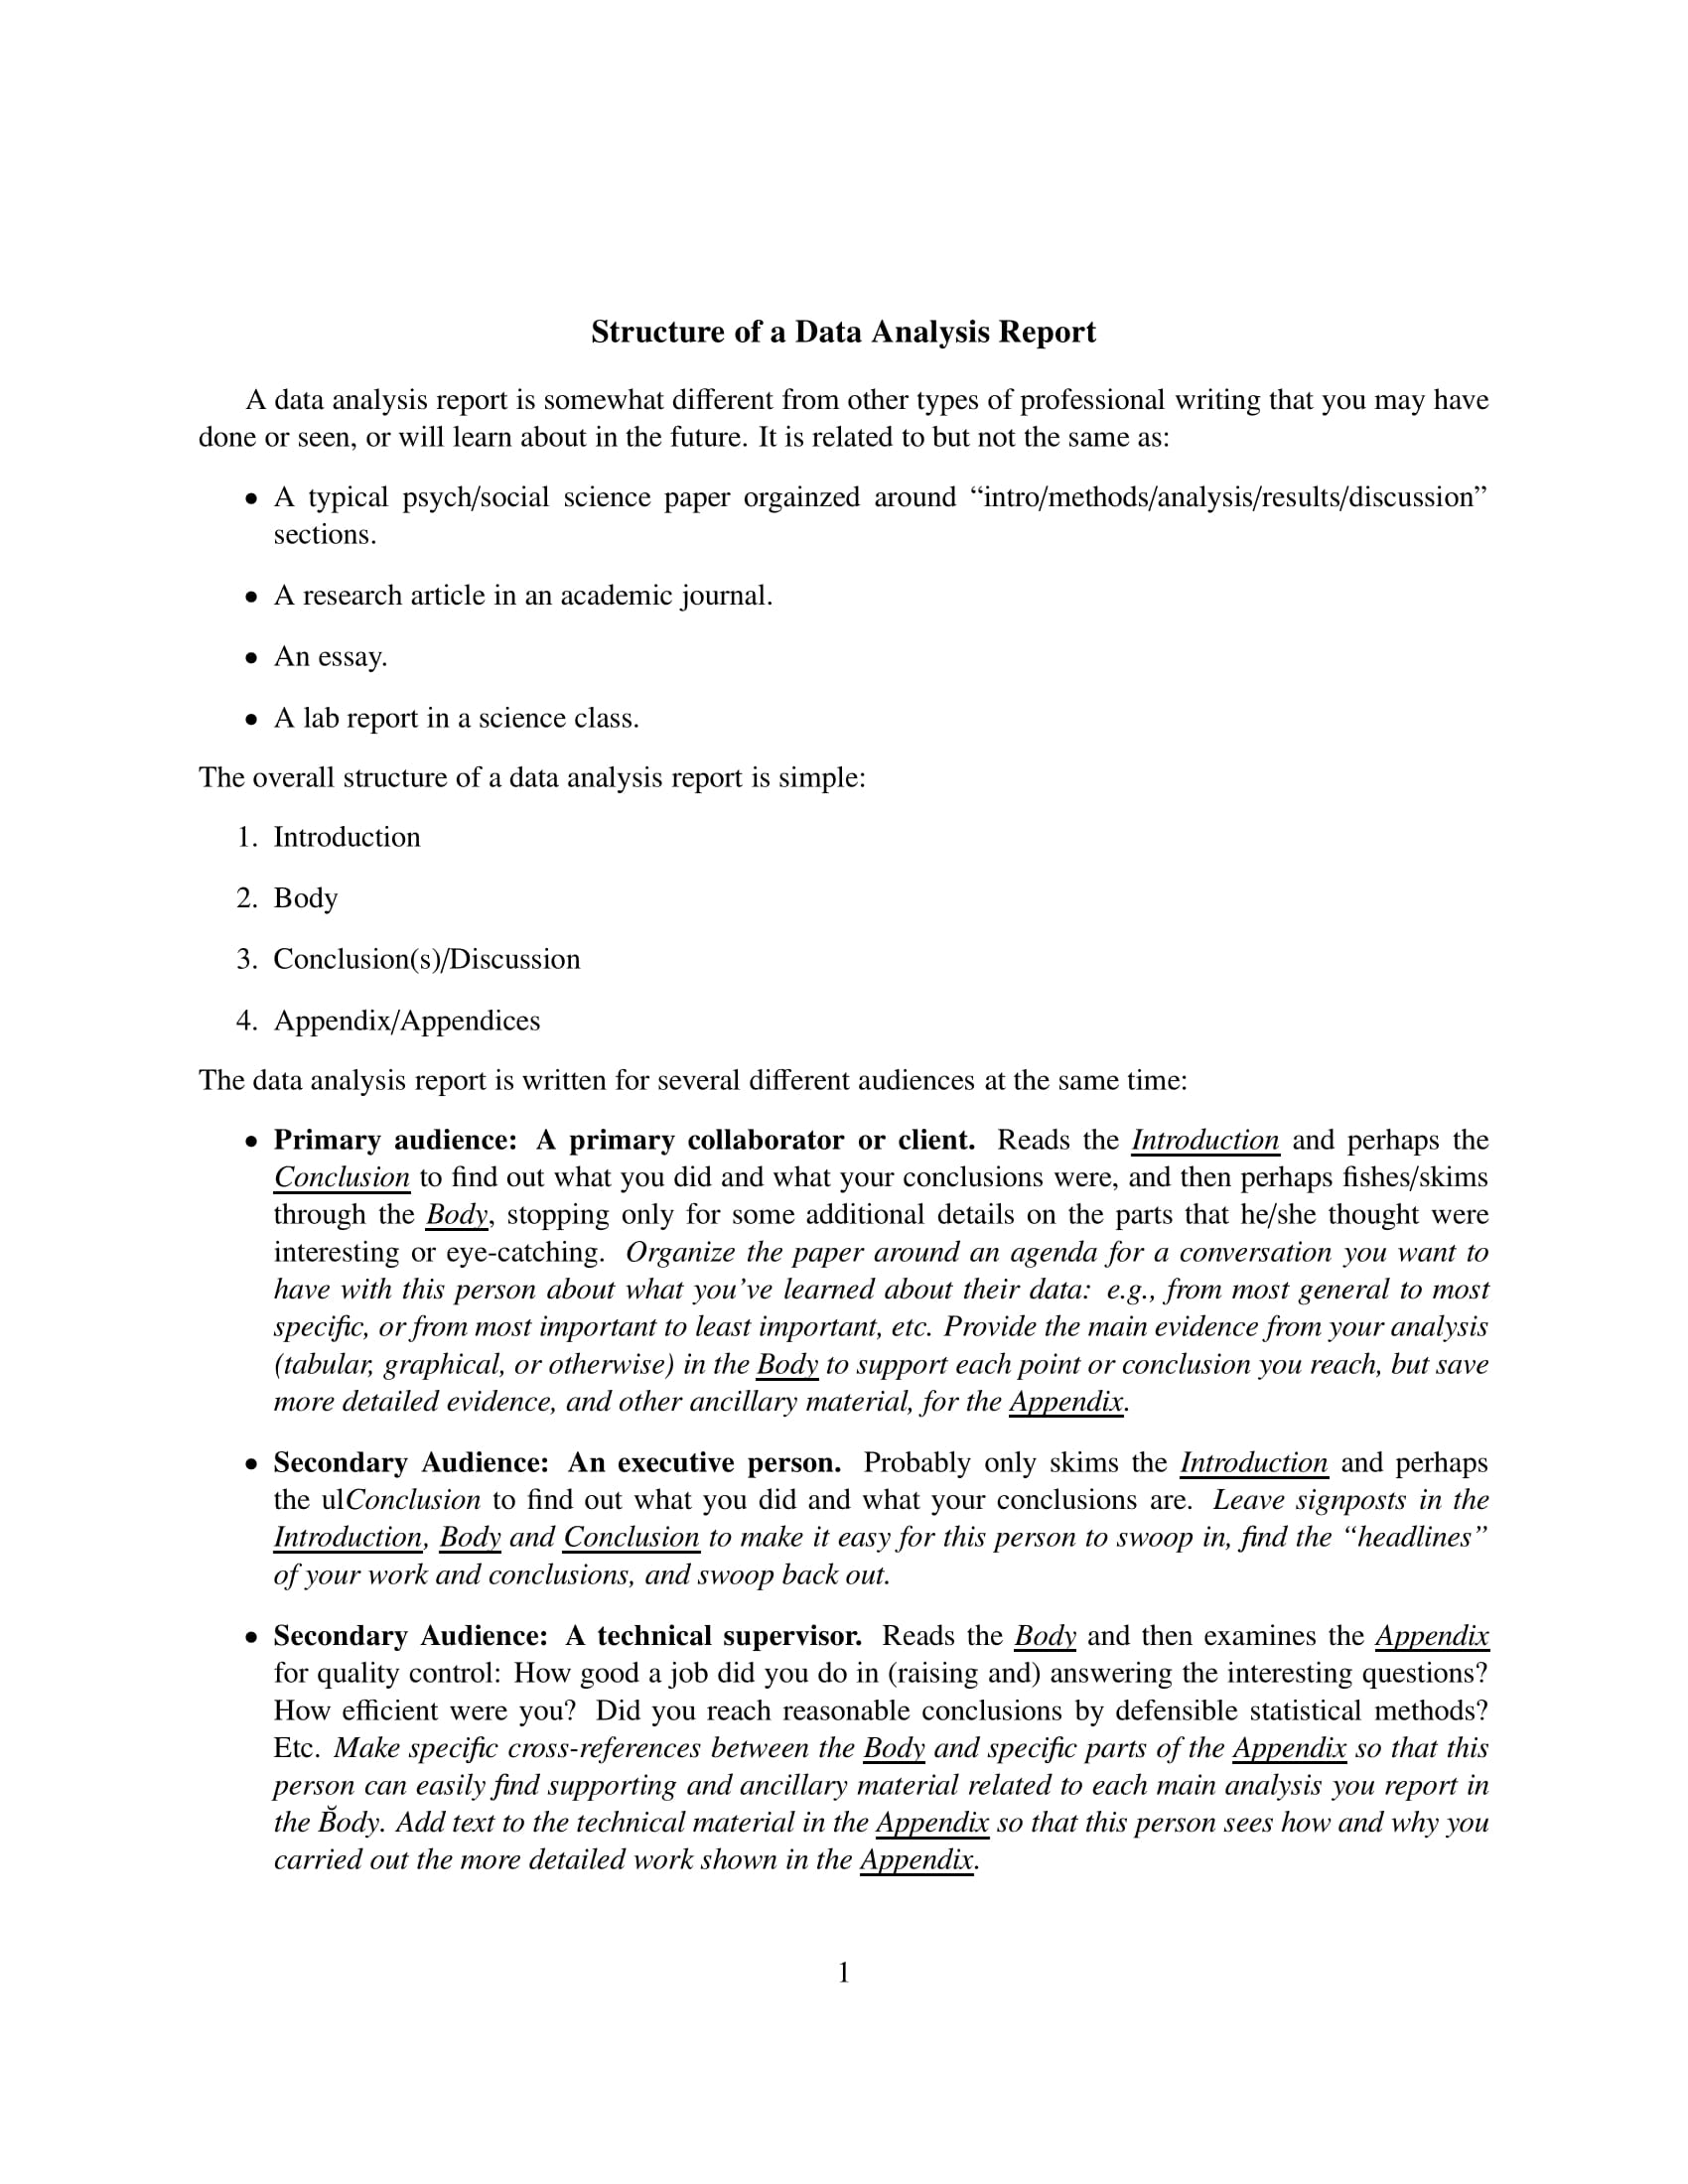
Qualitative Data Analysis Report Example
Data Analysis and Reporting Example
Data Analysis, Interpretation and Presentation Example
Data Analysis Interpretation for Reporting Purposes Example
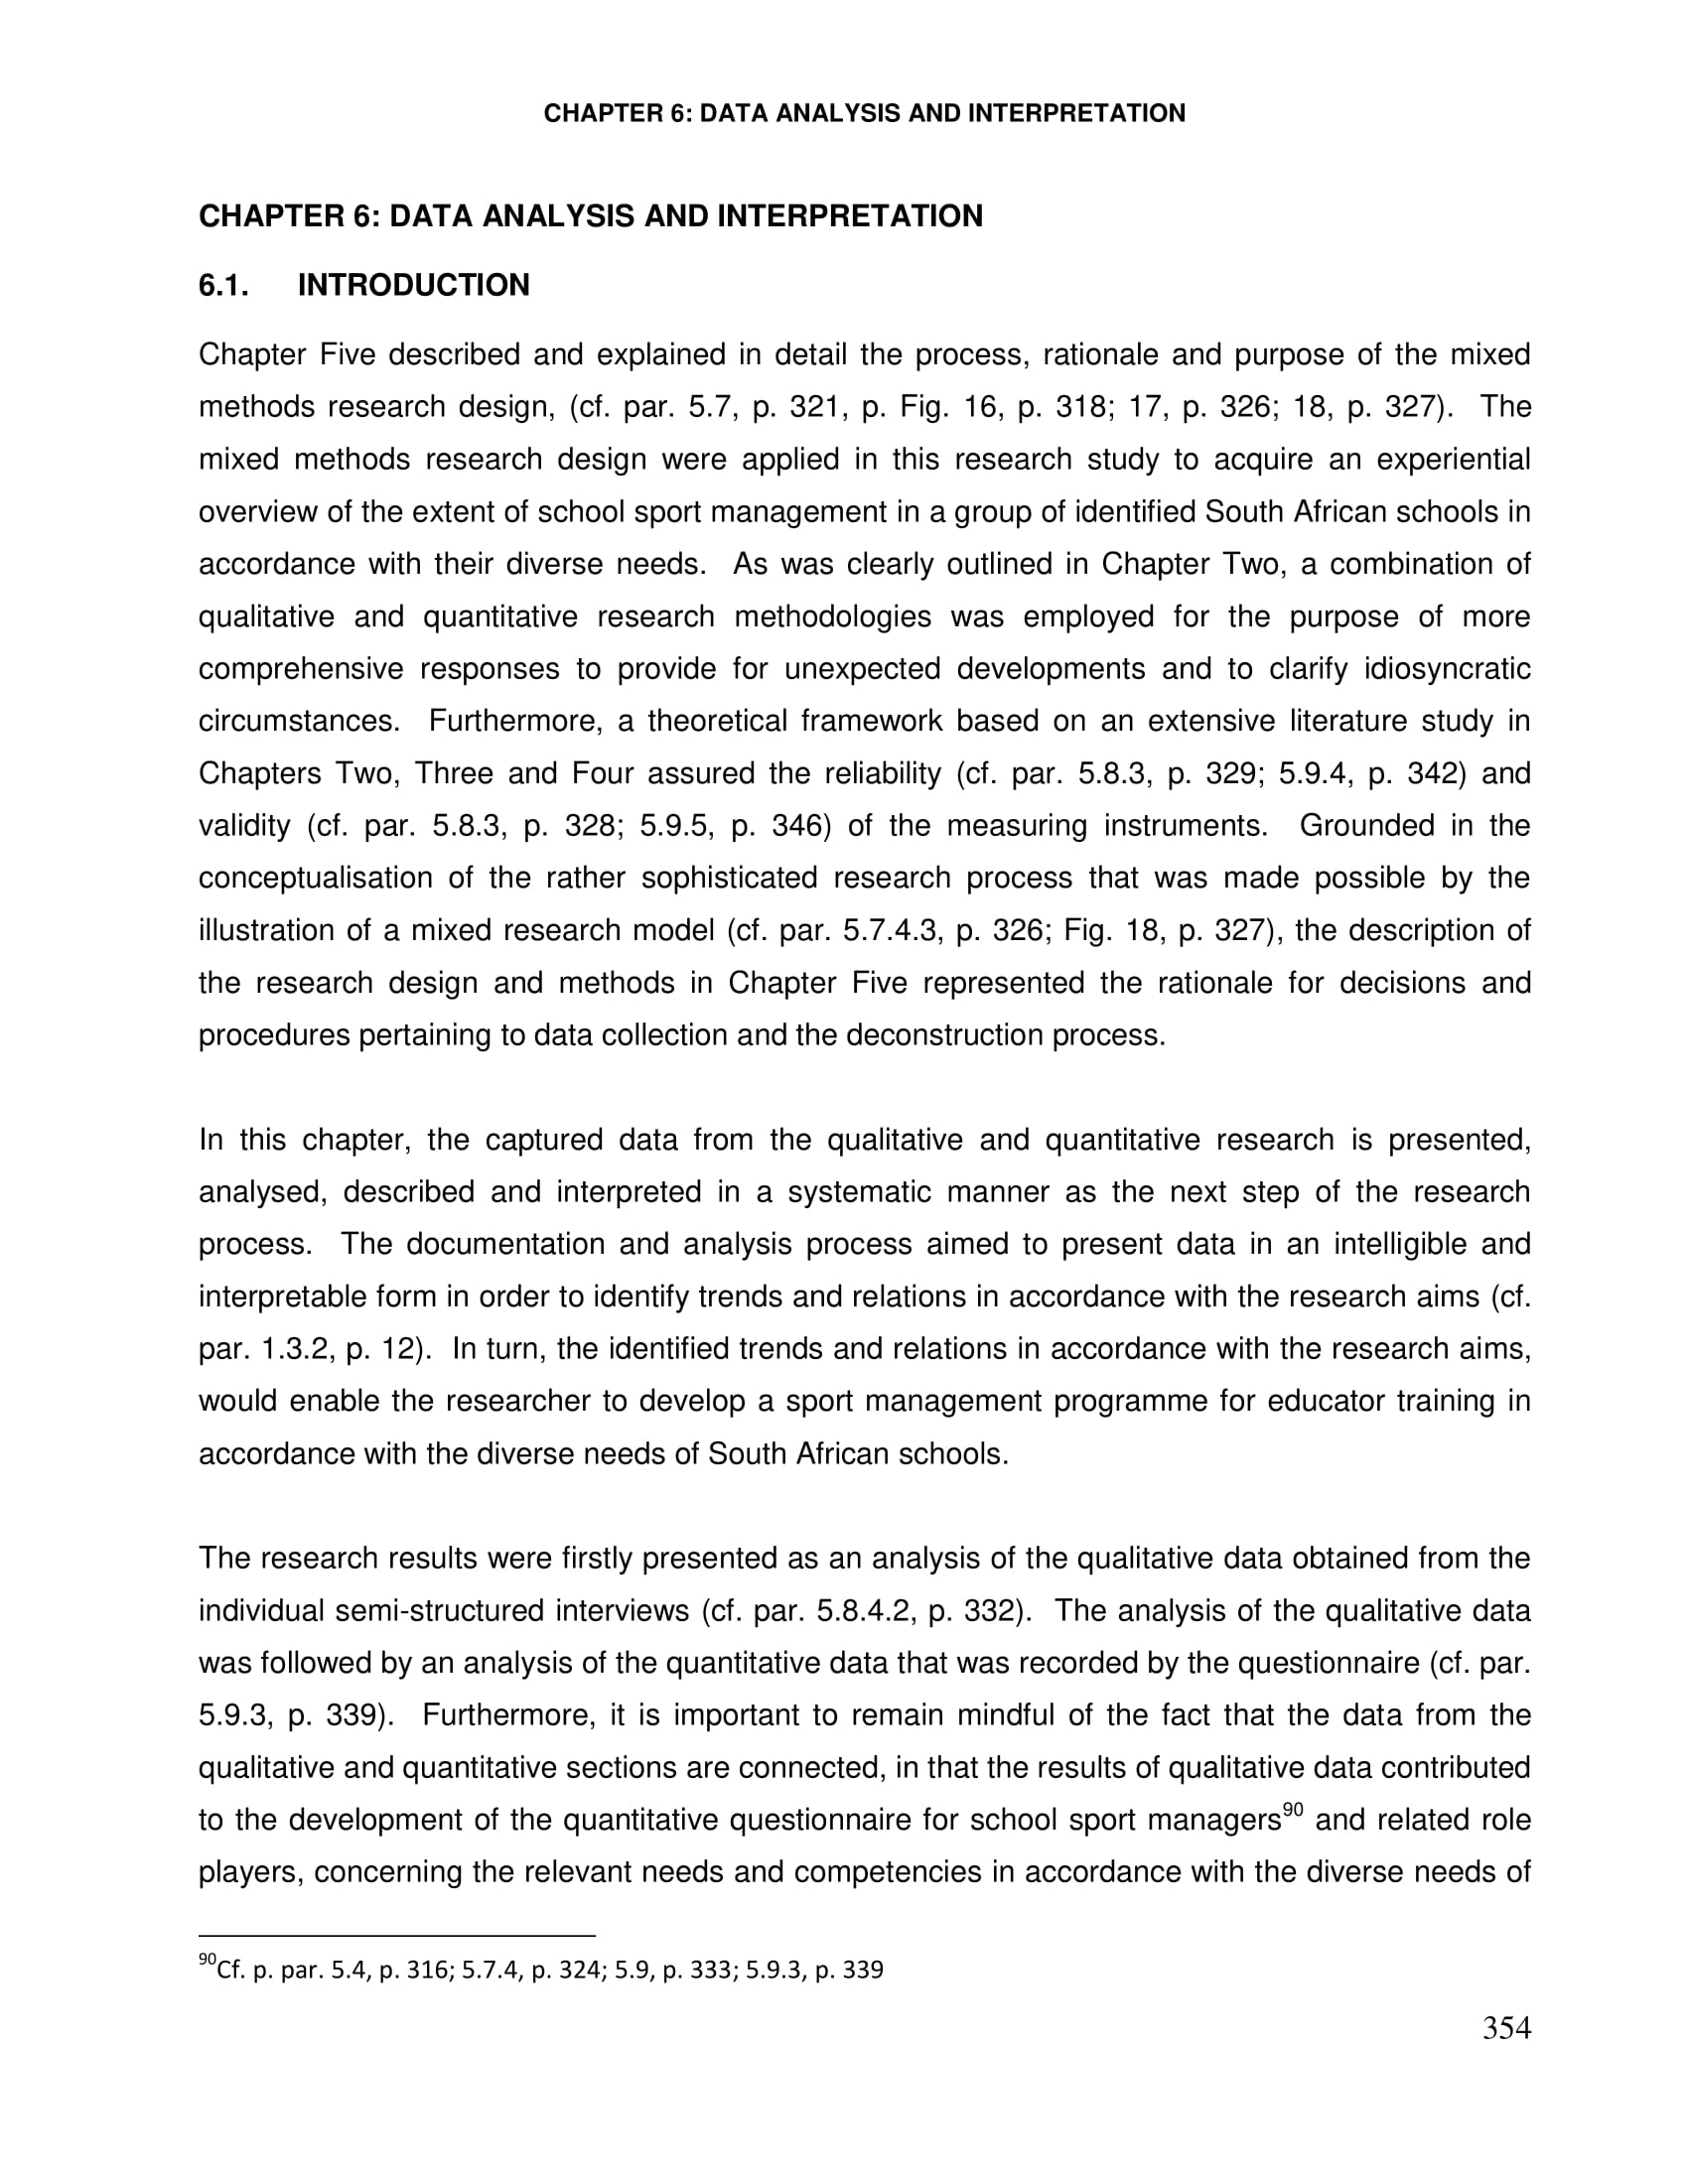
Detailed Data Analysis Report Example

Quantitative Data Analysis Introduction: Report to Program Evaluation and Methodology Example

Data Analysis, Presentation, and Reporting Example
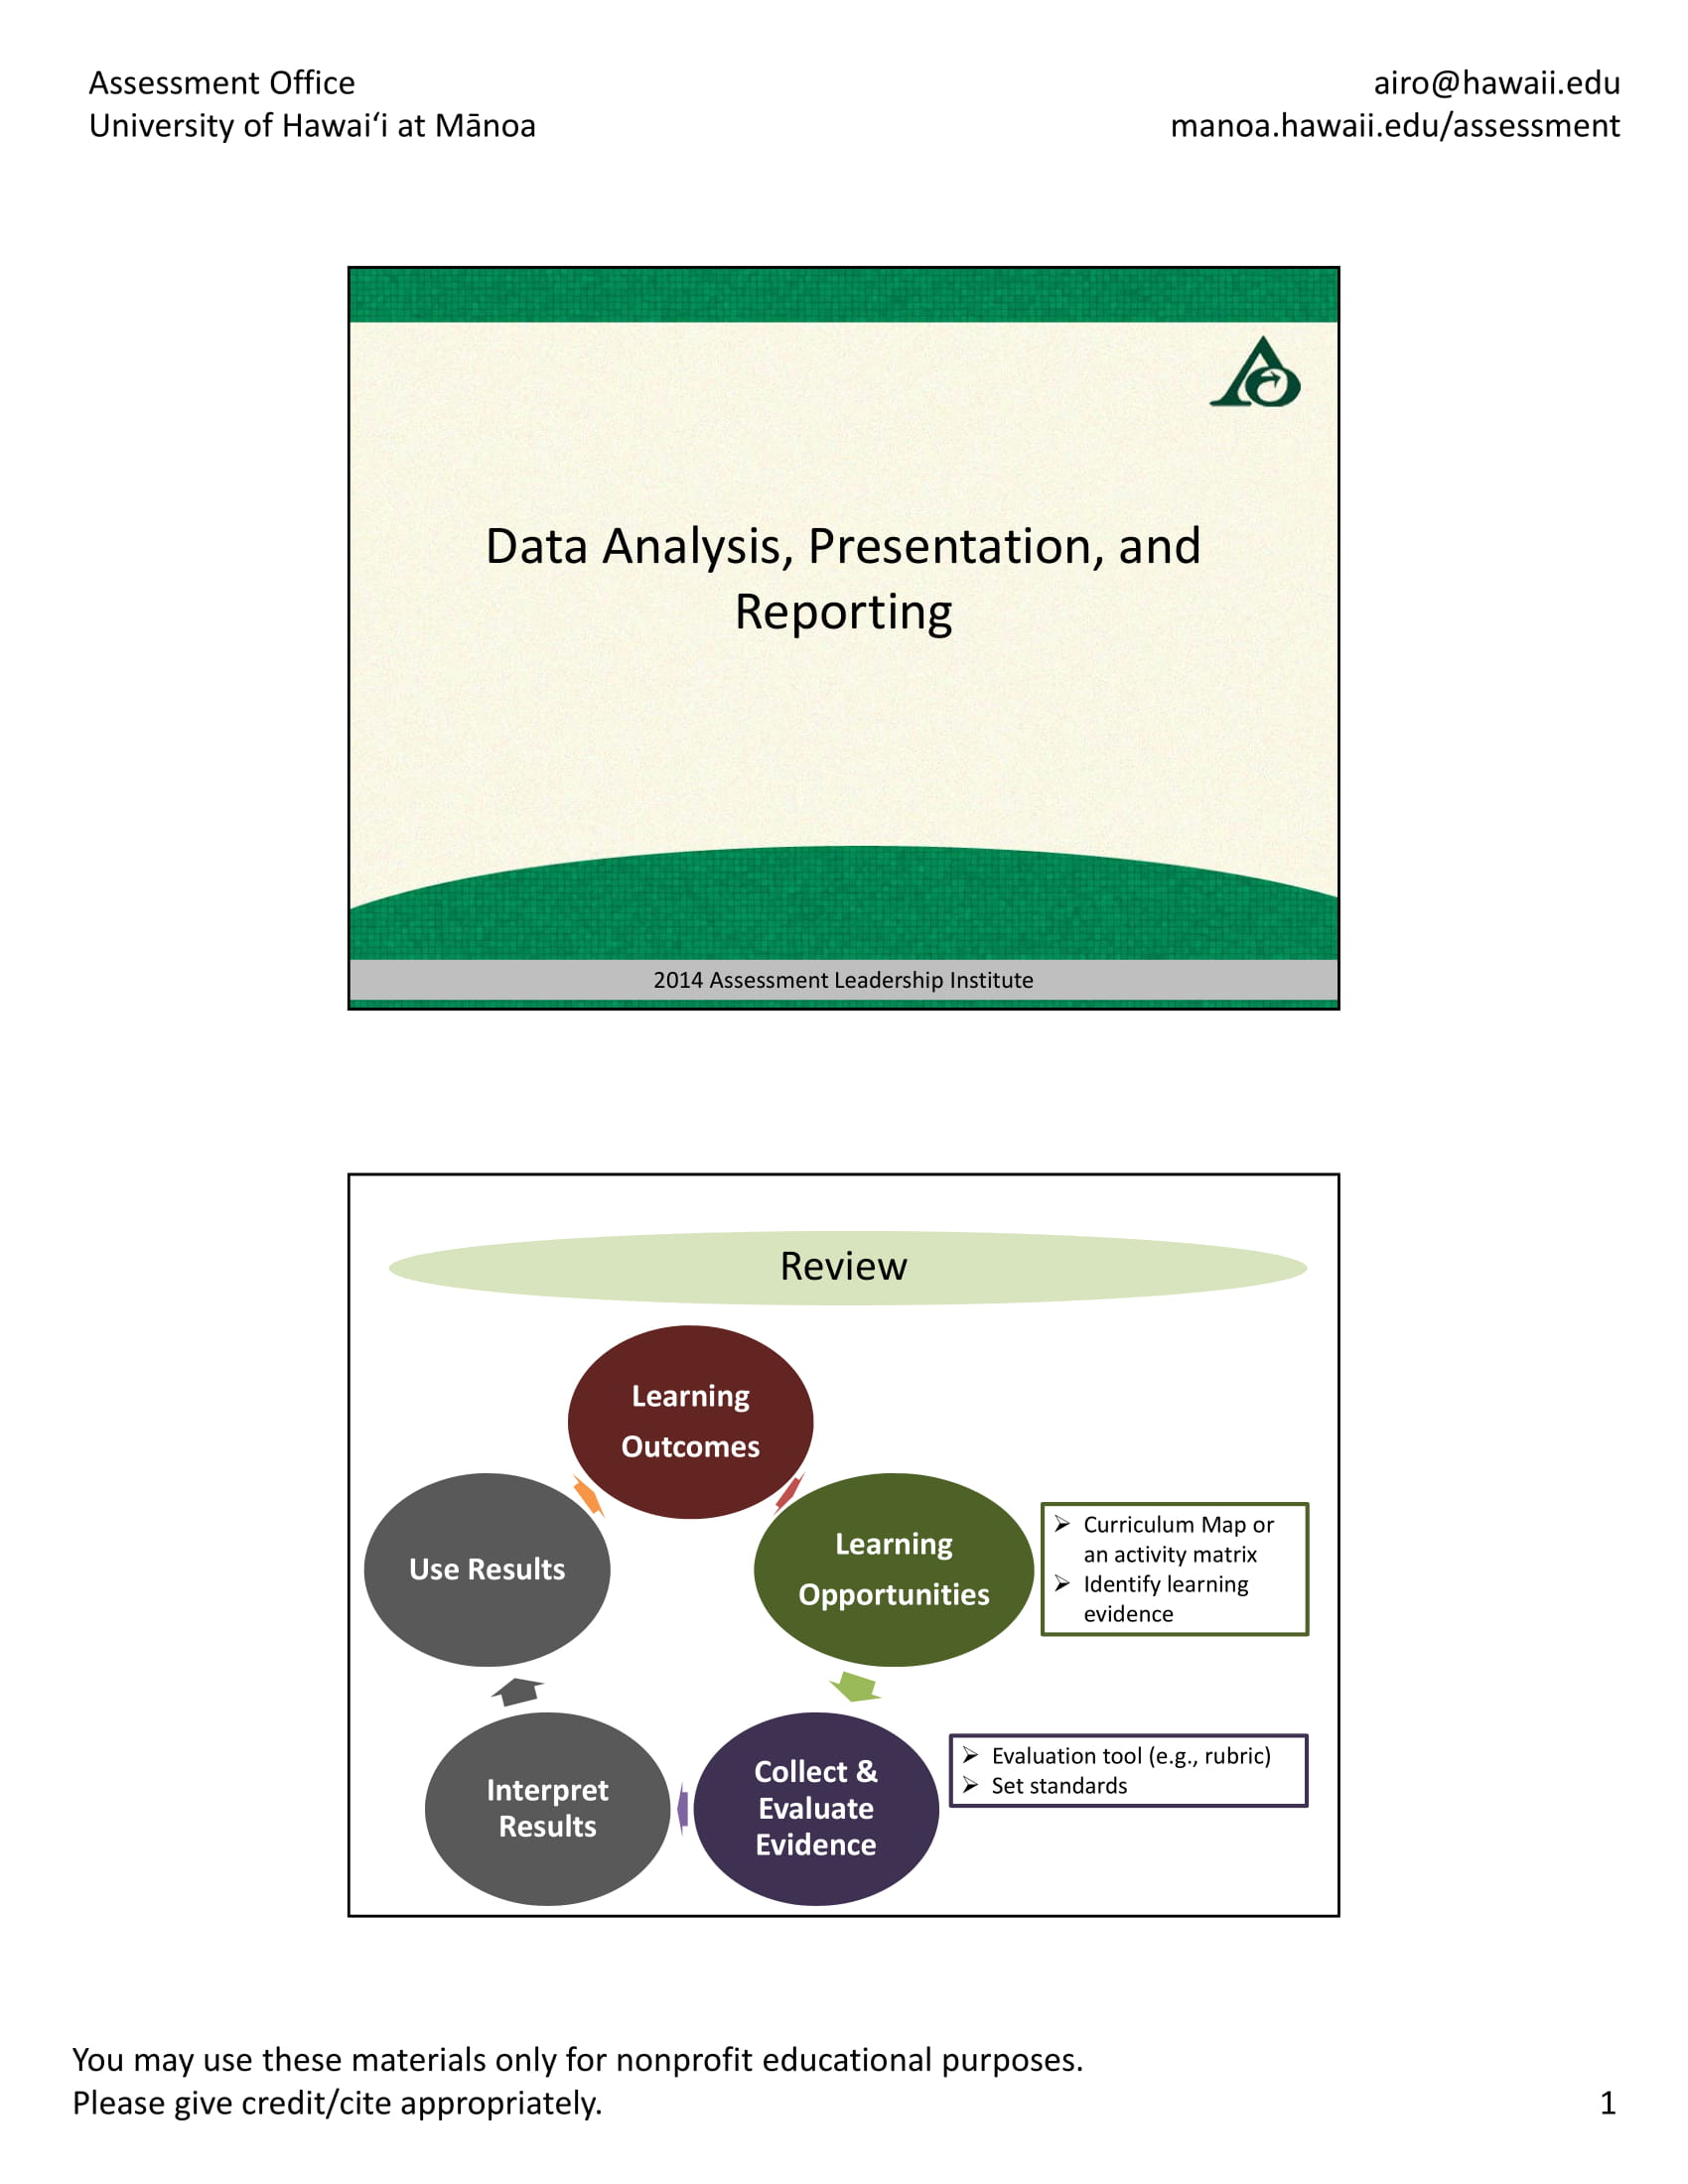
Data Analysis Report Handbook and Guide Example

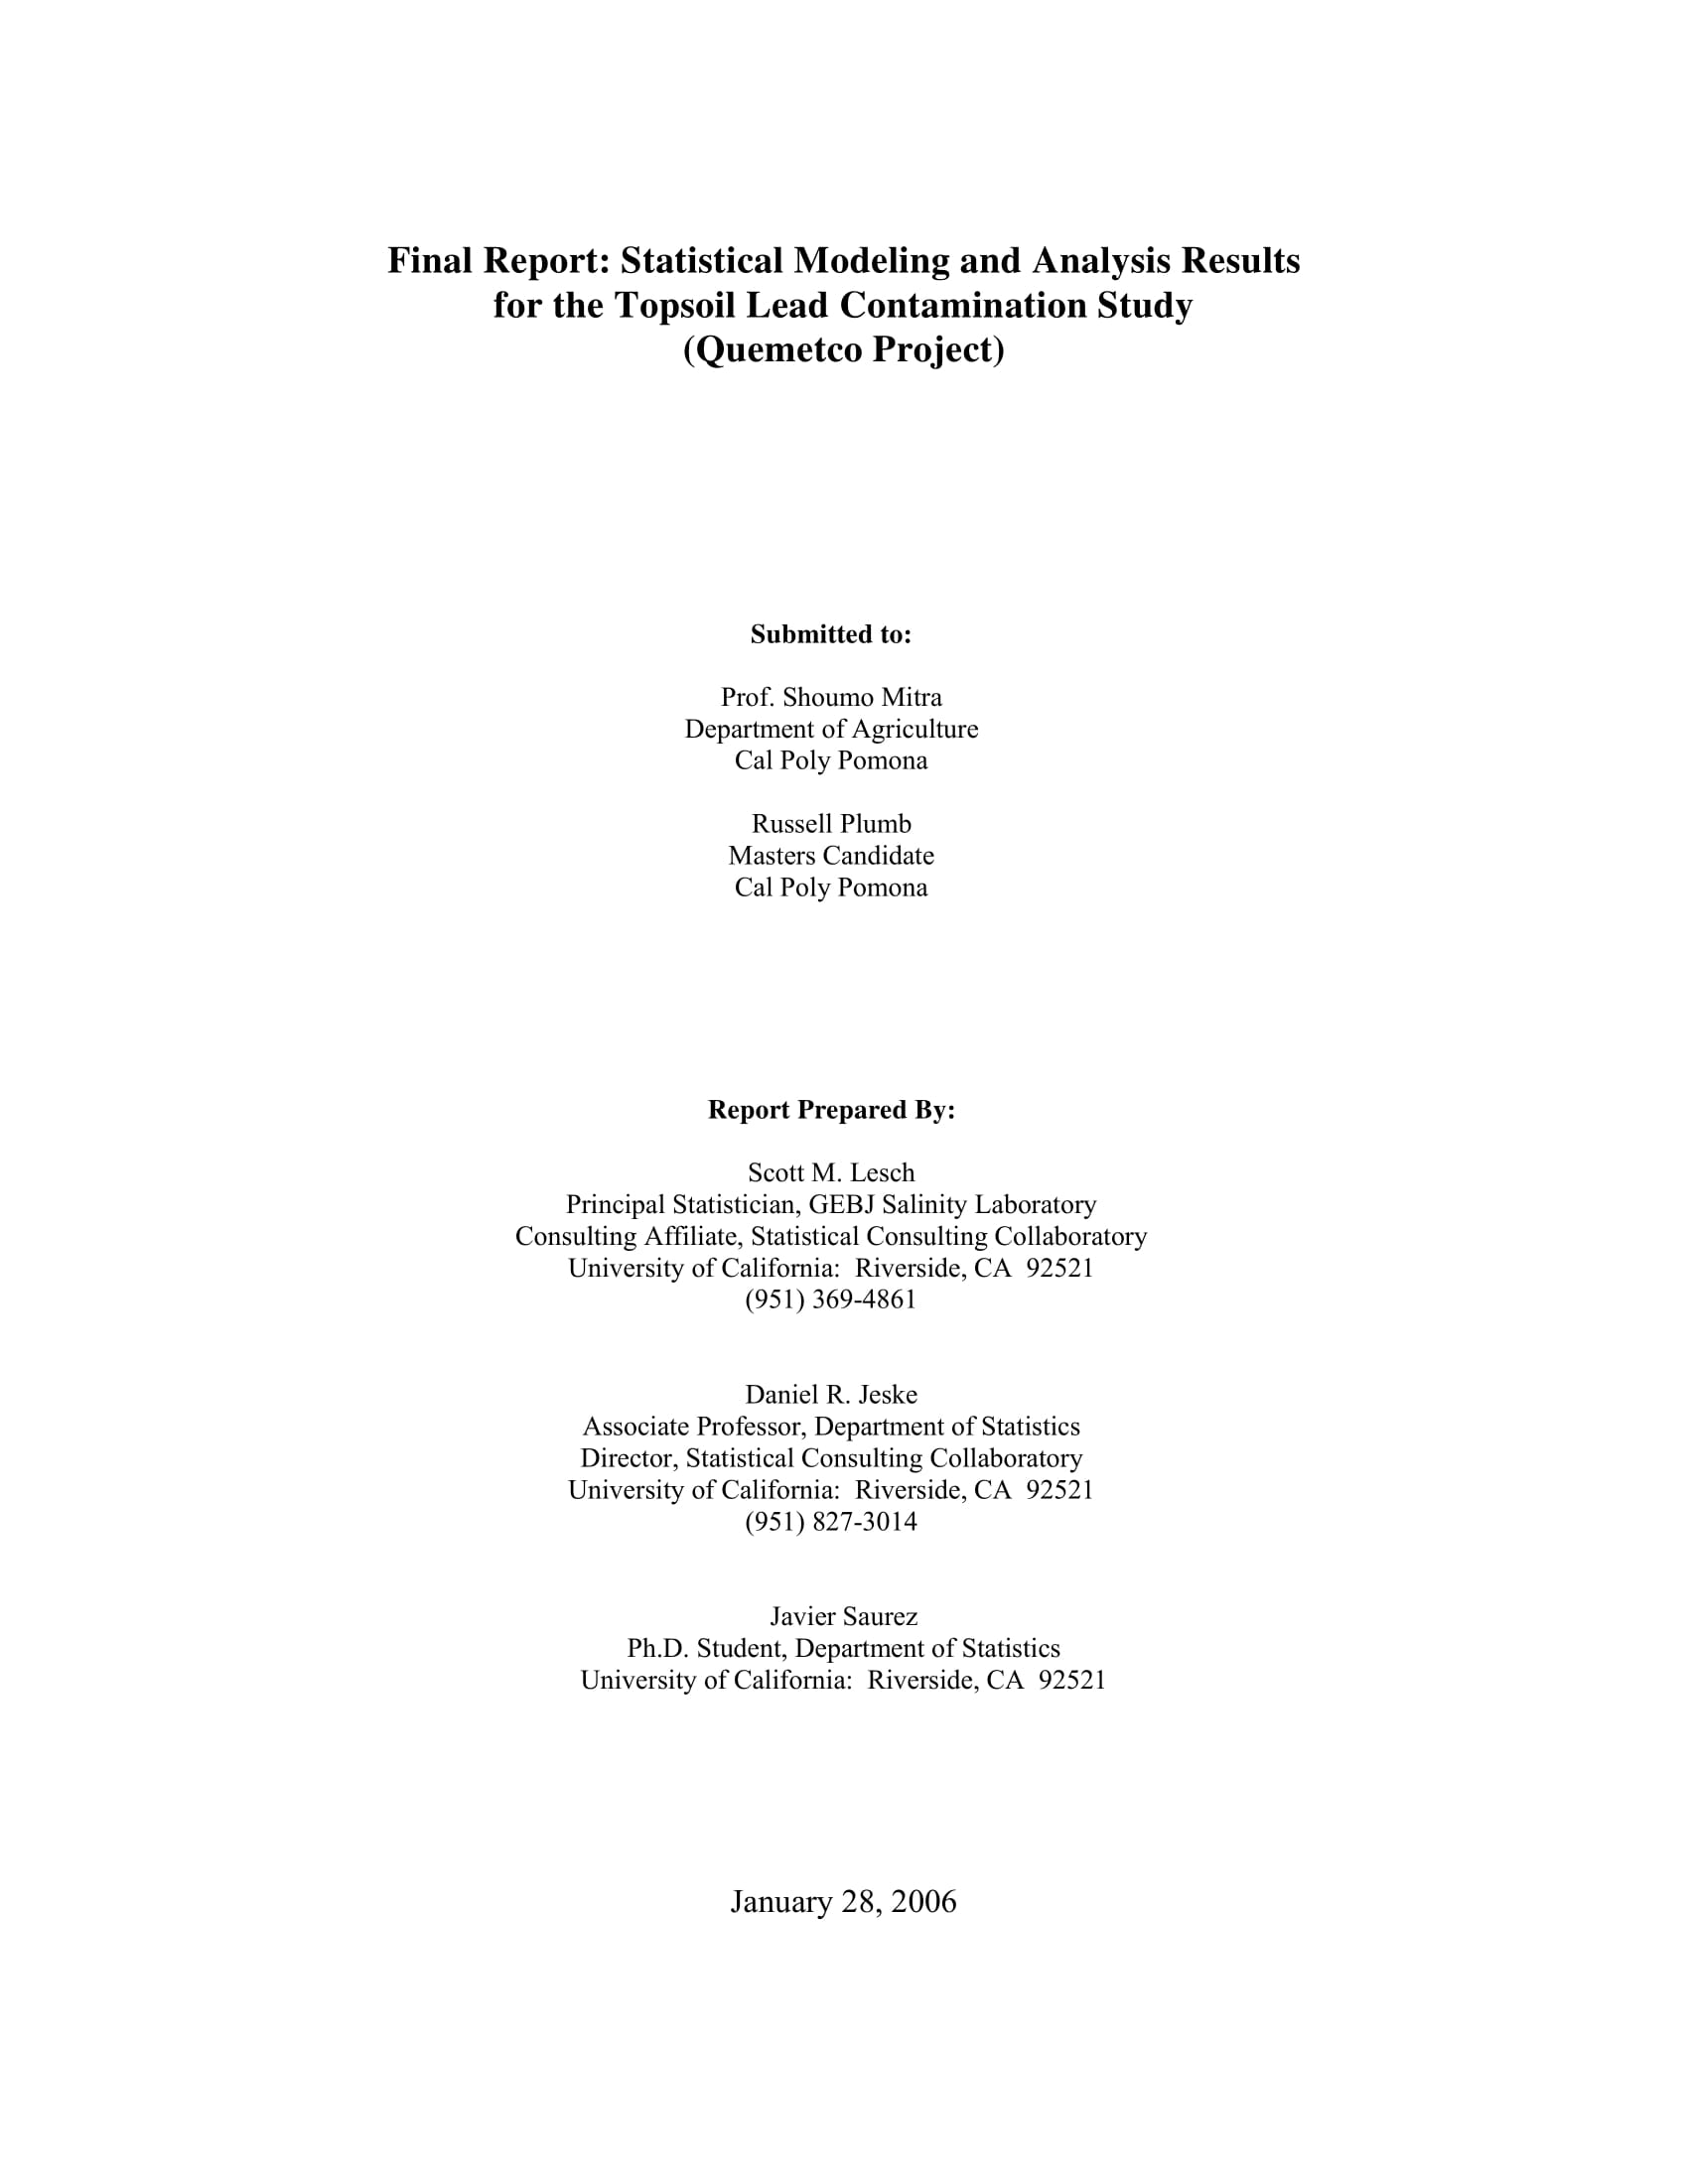
Statistical Modeling and Data Analysis Result Presentation Example
How to Write a Data Analysis Report
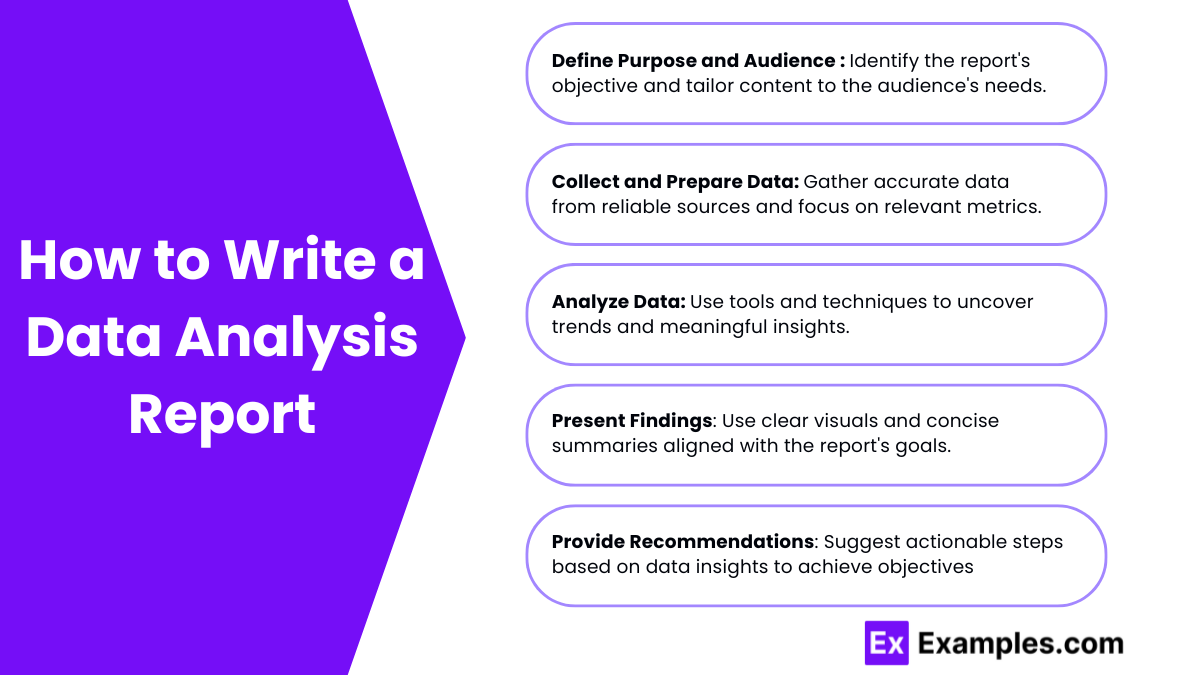
- Define the Purpose and Audience
Clearly outline the objective of the report and understand who will be reading it. Tailor the content and level of detail to meet the needs of the audience. - Collect and Prepare Data
Gather relevant data from reliable sources and clean it to ensure accuracy. Organize the data for analysis and focus on metrics that align with the report’s goals. - Analyze the Data
Use appropriate tools and techniques, such as statistical analysis, trend identification, or visualizations, to extract meaningful insights from the data. - Present Findings Clearly
Summarize key insights using charts, graphs, and tables. Ensure the findings are concise, logical, and aligned with the objectives of the report. - Provide Recommendations
Based on the findings, suggest actionable steps or strategies. Ensure recommendations are practical and supported by the data analysis.
FAQs
What are the 5 steps of data analysis?
Define objectives, collect data, analyze data, interpret results, present findings.
What are the 4 types of data analysis?
Descriptive, diagnostic, predictive, prescriptive.
How can visualizations improve a data analysis report?
They simplify complex data, making insights clearer and more impactful.
What is the significance of using reliable data sources?
It ensures accuracy, credibility, and trustworthy results.
Why is defining objectives important in a data analysis report?
It ensures the analysis aligns with goals and delivers actionable insights.


