25+ Chart of Accounts Examples to Download

25+ Chart of Accounts Examples to Download
A chart of accounts is a systematic listing of all accounts used in a business’s general ledger. It organizes financial data, categorizes expenses, revenues, assets, and liabilities, ensuring accurate financial reporting. Essential for crafting a robust accounting proposal, the chart of accounts provides clarity and structure, aiding in the effective management of financial activities and compliance with accounting standards. It is crucial for both small businesses and large enterprises to maintain a well-organized financial system.
What is a Chart of Accounts?
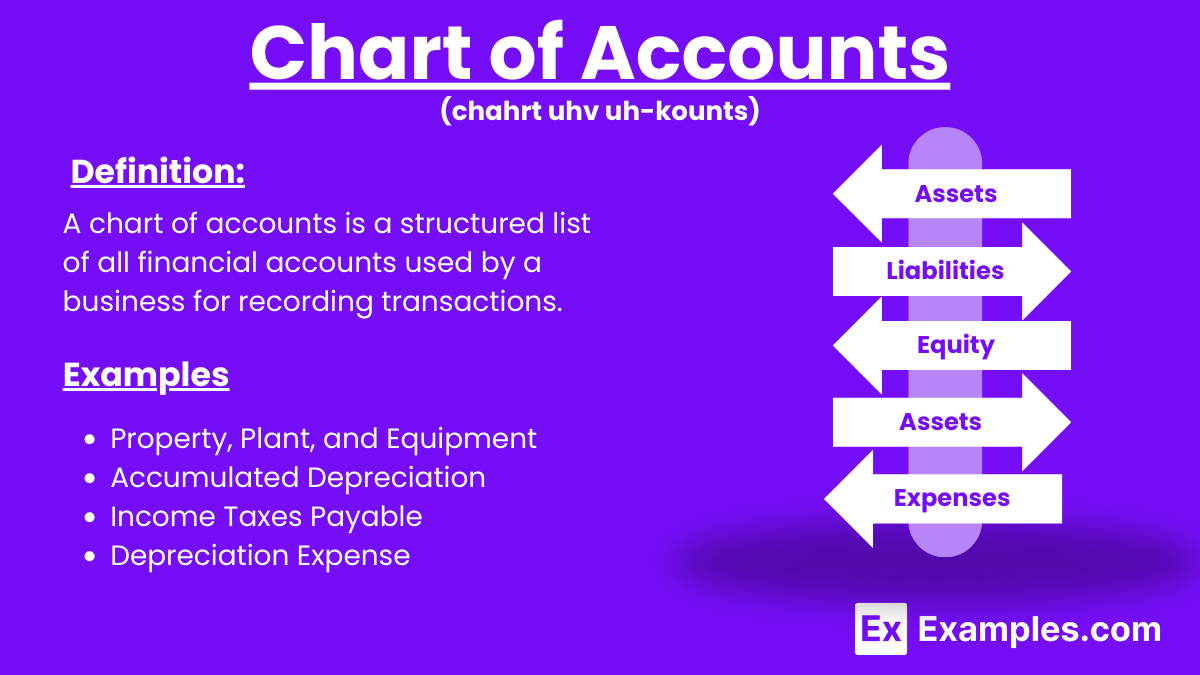
A Chart of Accounts (COA) is an organized list of all financial accounts in a company’s general ledger. It provides a structured overview of the organization’s finances, categorizing assets, liabilities, equity, revenues, and expenses, facilitating accurate financial reporting and analysis.
Chart of Accounts Examples
- 1010 – Cash
- 1020 – Accounts Receivable
- 1030 – Inventory
- 1040 – Prepaid Expenses
- 1050 – Investments
- 1060 – Property, Plant, and Equipment
- 1070 – Accumulated Depreciation
- 2010 – Accounts Payable
- 2020 – Notes Payable
- 2030 – Accrued Liabilities
- 2040 – Income Taxes Payable
- 2050 – Deferred Revenue
- 3010 – Common Stock
- 3020 – Retained Earnings
- 4010 – Sales Revenue
- 4020 – Service Revenue
- 4030 – Interest Income
- 5010 – Cost of Goods Sold
- 5020 – Salaries Expense
- 5030 – Rent Expense
- 5040 – Utilities Expense
- 5050 – Depreciation Expense
- 5060 – Insurance Expense
- 5070 – Advertising Expense
- 5080 – Interest Expense
- 5090 – Miscellaneous Expense
Chart of Accounts: Expenses List
- Salaries Expense
- Rent Expense
- Utilities Expense
- Depreciation Expense
- Insurance Expense
- Advertising Expense
- Office Supplies Expense
- Travel Expense
- Maintenance and Repairs Expense
- Legal and Professional Fees Expense
Structure of Chart of Accounts
The Chart of Accounts (COA) is a systematic listing of all account names and numbers used in an organization’s general ledger. It categorizes all financial transactions and organizes them in a way that provides clarity and consistency for financial reporting. Here is the typical structure of a Chart of Accounts:
1. Assets
- 1000 – 1999
- Current Assets (e.g., Cash, Accounts Receivable, Inventory)
- Fixed Assets (e.g., Property, Plant, Equipment)
- Intangible Assets (e.g., Patents, Goodwill)
2. Liabilities
- 2000 – 2999
- Current Liabilities (e.g., Accounts Payable, Accrued Expenses)
- Long-term Liabilities (e.g., Notes Payable, Bonds Payable)
3. Equity
- 3000 – 3999
- Owner’s Equity (e.g., Common Stock, Retained Earnings)
- Contributed Capital (e.g., Additional Paid-in Capital)
4. Revenue
- 4000 – 4999
- Operating Revenue (e.g., Sales Revenue, Service Revenue)
- Non-operating Revenue (e.g., Interest Income, Gain on Sale of Assets)
5. Expenses
- 5000 – 5999
- Cost of Goods Sold (COGS) (e.g., Direct Materials, Direct Labor)
- Operating Expenses (e.g., Salaries Expense, Rent Expense, Utilities Expense)
- Non-operating Expenses (e.g., Interest Expense, Loss on Sale of Assets)
Example of a Detailed Chart of Accounts
| Account Number | Account Name | Account Type |
|---|---|---|
| Assets | ||
| 1000 | Cash | Current Asset |
| 1010 | Accounts Receivable | Current Asset |
| 1020 | Inventory | Current Asset |
| 1500 | Property, Plant & Equipment | Fixed Asset |
| 1600 | Accumulated Depreciation | Fixed Asset |
| Liabilities | ||
| 2000 | Accounts Payable | Current Liability |
| 2010 | Accrued Expenses | Current Liability |
| 2100 | Notes Payable | Long-term Liability |
| Equity | ||
| 3000 | Common Stock | Equity |
| 3100 | Retained Earnings | Equity |
| Revenue | ||
| 4000 | Sales Revenue | Operating Revenue |
| 4010 | Service Revenue | Operating Revenue |
| Expenses | ||
| 5000 | Cost of Goods Sold (COGS) | Expense |
| 5010 | Salaries Expense | Expense |
| 5020 | Rent Expense | Expense |
| 5030 | Utilities Expense | Expense |
| 5040 | Depreciation Expense | Expense |
| 5050 | Advertising Expense | Expense |
Chart of Accounts Numbering
- Categorize Accounts – Group accounts into assets, liabilities, equity, revenue, and expenses to enhance your basic accounting skills.
- Assign Numbers – Use a unique number range for each category (e.g., 1000-1999 for assets).
- Subcategorize – Further break down categories (e.g., 1100-1199 for cash accounts).
- Maintain Consistency – Ensure consistent numbering across periods for clarity.
- Review Regularly – Periodically review and update numbers to reflect changes in the business.
How to Adjust Your Chart of Accounts
- Review Current Accounts – Assess existing accounts to identify any redundancies or missing categories.
- Consult Stakeholders – Gather input from key financial personnel to understand specific needs and requirements.
- Update Account Categories – Add, remove, or modify account categories to better reflect business activities.
- Renumber Accounts – Reassign numbers logically within the organizational chart to maintain order and consistency.
- Test Changes – Implement changes in a test environment to ensure accuracy and functionality.
- Communicate Updates – Inform all relevant staff about the adjustments and provide training if necessary.
Basic Chart of Account Categories
- Assets – Resources owned by the business, such as cash, inventory, and equipment, play a crucial role in the purchase flow chart.
- Liabilities – Obligations owed by the business (e.g., accounts payable, loans).
- Equity – Owner’s interest in the business (e.g., common stock, retained earnings).
- Revenue – Income generated from business operations (e.g., sales revenue, service revenue).
- Expenses – Costs incurred in the process of earning revenue (e.g., salaries expense, rent expense).
How a Chart of Accounts Benefits Your Small Business
- Organized Financial Data – Provides a clear and structured way to categorize all financial transactions, making it easier to track and manage finances, which is essential for effective accounting firm marketing.
- Improved Financial Reporting – Facilitates the generation of accurate financial statements, which are essential for assessing the business’s financial health.
- Enhanced Decision Making – Offers detailed insights into income and expenses, aiding in informed decision-making and strategic planning.
- Simplified Tax Preparation – Helps streamline the tax filing process by organizing financial information systematically.
- Better Budgeting – Assists in creating more accurate budgets by clearly showing past and present financial performance through consulting profit and loss statements.
- Compliance and Audit Readiness – Ensures that financial records meet regulatory standards and are ready for audits.
Important Of Chart of Accounts
- Organizes Financial Information – Provides a structured framework for categorizing all financial transactions, ensuring clarity and consistency in any accounting proposal.
- Facilitates Accurate Reporting – Enables the creation of precise financial statements, crucial for evaluating business performance.
- Supports Decision-Making – Offers detailed insights into financial data, aiding strategic planning and informed business decisions.
- Simplifies Tax Compliance – Helps in preparing accurate tax returns by organizing financial data systematically.
- Enhances Budgeting and Forecasting – Assists in developing realistic budgets and financial forecasts based on historical data.
- Ensures Regulatory Compliance – Keeps financial records in line with accounting standards and regulations, aiding in audit readiness.
Chart of Accounts Benefits
- Organized Financial Records – Streamlines the categorization of financial transactions, making record-keeping efficient and manageable, much like using flow chart examples for organizing processes..
- Financial Transparency – Promotes transparency by clearly showing all financial activities, including the sales flowchart, crucial for stakeholders and investors.
- Better Expense Tracking – Helps in monitoring expenses accurately, identifying areas for cost control and efficiency.
- Supports Growth – Provides a scalable framework that can adapt as the business grows and diversifies.
- Regulatory Compliance – Keeps financial practices in line with accounting standards and legal requirements.
- Audit Readiness – Ensures financial records meet regulatory standards, making audits smoother and less stressful.
- Financial Transparency – Promotes transparency by clearly showing all financial activities, including the sales flowchart, which is crucial for stakeholders and investors.
- Better Expense Tracking – Helps in monitoring expenses accurately, identifying areas for cost control and efficiency.
- Supports Growth – Provides a scalable framework that can adapt as the business grows and diversifies.
- Regulatory Compliance – Keeps financial practices in line with accounting standards and legal requirements.
How is a Chart of Accounts structured?
It is typically divided into categories like assets, liabilities, equity, revenue, and expenses.
How do I create a Chart of Accounts?
Identify all accounts relevant to your business and categorize them logically.
Can a Chart of Accounts be customized?
Yes, it should be tailored to fit the specific needs of your business.
What are account numbers?
Account numbers are unique identifiers assigned to each account in the chart.
How often should I update my Chart of Accounts?
Review and update it regularly to reflect changes in your business.
What is the difference between assets and liabilities?
Assets are resources owned by the business; liabilities are obligations owed by the business.
How does the Chart of Accounts help in budgeting?
It provides a clear picture of income and expenses, aiding in accurate budget creation.
Can I add new accounts to my Chart of Accounts?
Can I add new accounts to my Chart of Accounts?
How does the Chart of Accounts aid in tax preparation?
It organizes financial information, simplifying the process of preparing tax returns.
What is an example of a revenue account?
Sales revenue is a common example of a revenue account.
Share :
