20+ Infographic For Students Examples

20+ Infographic For Students Examples
Infographics are powerful visual tools that combine graphics and text to present information clearly and engagingly. They help students understand complex concepts quickly, making learning more enjoyable and efficient. Infographics can cover various subjects, from history timelines to scientific processes, enhancing comprehension and retention. By simplifying data into easily digestible visuals, infographics support diverse learning styles and promote active learning, making them invaluable in today’s educational landscape.
What is Infographic For Students?
An infographic for students is a visual representation that combines images, charts, and minimal text to convey educational information. It simplifies complex topics, making learning more engaging and easier to understand, enhancing retention and comprehension across various subjects.
Infographic For Students Examples
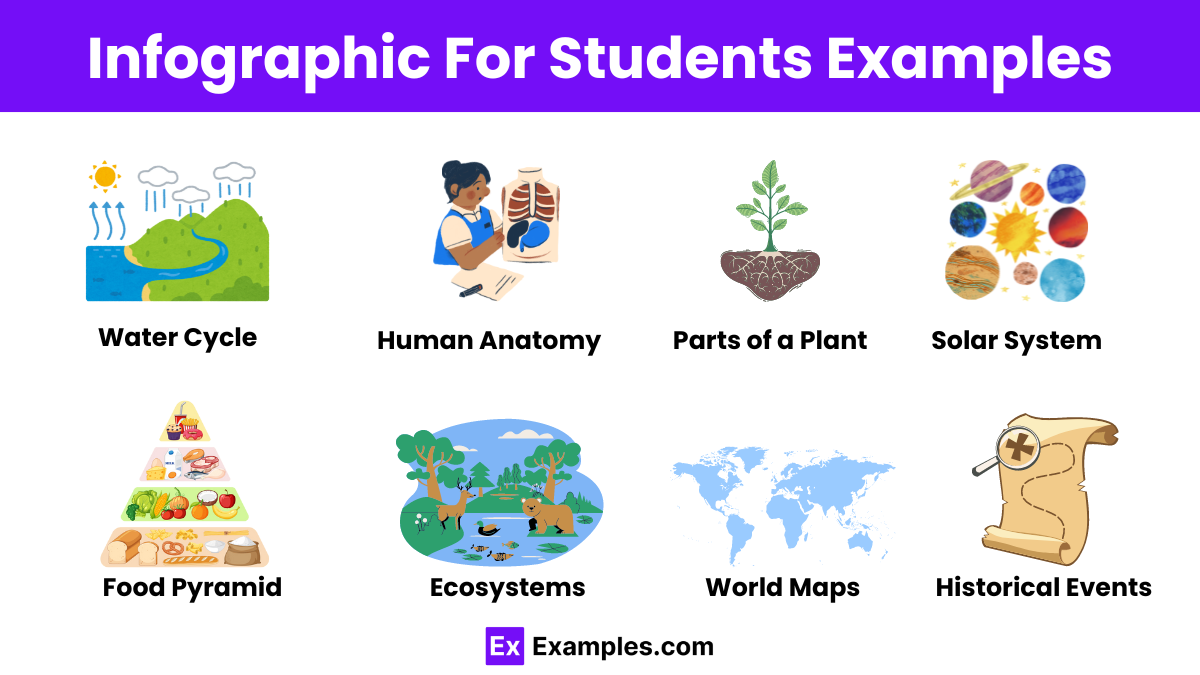
- Water Cycle
- Periodic Table of Elements
- History Timeline
- Human Anatomy
- Parts of a Plant
- Solar System
- Mathematical Formulas
- Food Pyramid
- Literary Genres
- Cell Structure
- Ecosystems
- Grammar Rules
- World Maps
- Famous Inventors
- Historical Events
- Scientific Method
- Types of Energy
Infographic Example about Virtual Learning
- Benefits of Virtual Learning: Illustrates advantages like flexibility, accessibility, personalized pacing, and enhanced visual communication in online education.
- Virtual Classroom Setup: Shows the ideal setup for an effective virtual learning environment, including equipment and software needed.
- Time Management Tips: Provides strategies for managing time efficiently while engaging in virtual learning.
- Online Learning Platforms: Lists and describes popular platforms used for virtual learning, such as Zoom, Google Classroom, and Canvas.
- Student Engagement Techniques: Highlights methods to keep students engaged and motivated during virtual classes.
- Cybersecurity Tips for Students: Offers advice on how to stay safe and secure online while participating in virtual learning.
- Virtual Learning Etiquette: Outlines best practices and behaviors for students to follow during online classes.
- Combating Virtual Learning Fatigue: Provides tips to prevent burnout and maintain mental health while learning online.
Simple Infographic For Students
- Choose a Topic: Select an Infographic Case Study that is interesting and relevant to your studies or personal interests..
- Research Information: Gather accurate and reliable information from trusted sources to ensure your infographic is informative and factual.
- Organize Content: Arrange the information logically, prioritizing key points and structuring it for easy understanding and flow.
- Create Visuals: Design or select images, charts, and icons that visually represent your information effectively and attractively.
- Add Text: Write concise, clear text to accompany visuals, ensuring it complements the images and enhances understanding.
- Review and Edit: Check for accuracy, clarity, and visual appeal, making necessary adjustments to improve overall quality and readability.
Infographic for Elementary Students
- Choose a Fun Topic: Pick a subject that interests young students, like animals, space, or favorite books, to capture their attention.
- Gather Simple Information: Collect easy-to-understand facts and data from child-friendly sources, ensuring content is age-appropriate and suitable for digital communication.
- Organize Content Clearly: Arrange information in a logical sequence, using headings and subheadings to guide students through the content.
- Use Bright Visuals: Incorporate colorful images, cartoons, and icons to make the infographic visually appealing and engaging for young learners.
- Add Short Text: Write brief, simple sentences to explain each point, keeping language clear and accessible for elementary students.
- Review and Edit Together: Check the infographic for accuracy and readability, and involve students in the editing process to enhance their learning.
Infographic about Climate Change For Students
- Define Climate Change: Explain that climate change refers to long-term shifts in temperatures and weather patterns, primarily due to human activities.
- Causes of Climate Change: Illustrate major causes, such as greenhouse gas emissions from burning fossil fuels, deforestation, and industrial activities.
- Effects on the Environment: Show the impact on the environment, including rising sea levels, melting ice caps, extreme weather events, and habitat loss.
- Human Impact: Highlight how climate change affects human health, agriculture, and communities, emphasizing issues like heatwaves, food scarcity, and displacement.
- Practical Steps to Combat Climate Change : Reduce carbon footprint, use renewable energy, recycle, support sustainability policies; explore a business case study for impactful strategies.
How to Make an Infographic For Students
- Choose a Relevant Topic: Select a subject that is both interesting and educational for students, such as a scientific concept, historical event, or grammar rule.
- Research Thoroughly: Gather accurate and comprehensive information from reliable sources. Make sure the content is appropriate for the students’ age and comprehension level.
- Organize Information: Break down the information into key points. Arrange these points logically, using headings and subheadings to create a clear structure.
- Design Visual Elements: Create or find images, icons, charts, and graphs that visually represent your information. Ensure visuals are colorful and engaging to maintain student interest.
- Write Concise Text: Add short, clear text to explain each visual element. Use simple language and keep sentences brief to make the information easy to understand.
- Review and Edit: Check for accuracy, clarity, and visual appeal. Ensure the infographic is free of errors and that the layout is clean and easy to follow. Get feedback from peers or educators if possible.
How infographics promote student learning
- Simplify Complex Information: Infographics break down intricate concepts into digestible pieces, making it easier for students to understand and remember.
- Enhance Visual Learning: Many students are visual learners. Infographics use images, charts, and diagrams to illustrate information, catering to this learning style.
- Improve Retention: The combination of visuals and concise text helps students retain information better than text alone.
- Engage and Motivate: Colorful and attractive designs capture students’ attention and make learning more enjoyable, increasing motivation to learn.
- Support Diverse Learning Styles: Infographics cater to various learning preferences, including visual, spatial, and logical learners, promoting inclusivity.
- Facilitate Quick Comprehension: Visuals can convey information quickly and clearly, helping students grasp concepts at a glance.
- Encourage Critical Thinking: Infographics often present data and comparisons, like a timeline chart, prompting students to analyze and interpret information critically.
- Boost Communication Skills: Creating infographics helps students practice organizing information and presenting it clearly and effectively.
Infographic Topics Ideas
- Water Cycle: Illustrate the stages of evaporation, condensation, precipitation, and collection in the water cycle.
- Periodic Table of Elements: Visualize elements’ organization, grouping by similar properties and atomic structure.
- Human Anatomy: Show key organs and systems, detailing their functions within the human body.
- Solar System: Depict planets, their orbits, and key characteristics within our solar system.
- Historical Timelines: Map out significant events over a specific period or for a historical figure.
- Parts of a Plant: Highlight roots, stems, leaves, and flowers, explaining their roles in plant life.
Infographic for Students Benefits
- Simplify Information: Infographics break down complex topics into easy-to-understand visuals, making learning simpler and more accessible for students.
- Enhance Retention: Visuals combined with text help students remember information better and for longer periods.
- Engage Learners: Colorful and interactive designs capture students’ attention, increasing their interest and motivation to learn.
- Support Diverse Learning Styles: Infographics cater to visual, spatial, and logical learners, promoting inclusivity and effective learning.
- Encourage Critical Thinking: Infographics, such as timeline charts, prompt students to analyze and interpret data, enhancing critical thinking skills.
How do I cite sources?
Use a citation style guide such as APA or MLA to format your references.
What is primary research?
Primary research involves collecting new data directly from sources.
How can I improve my study habits?
Set specific goals, manage time effectively, and stay organized.
What is critical thinking?
Critical thinking involves analyzing information objectively and making reasoned judgments.
How do I prepare for exams?
Review class notes, practice with past exams, and quiz yourself regularly.
What are soft skills?
Soft skills are interpersonal skills like communication, teamwork, and adaptability.
What are academic journals?
Academic journals publish research articles reviewed by experts in the field.
How do I choose a major?
Consider your interests, strengths, career goals, and job market demand.
What is the difference between a bachelor’s and master’s degree?
A bachelor’s degree is undergraduate, while a master’s degree is typically postgraduate and more specialized.
Share :
