20+ Positive Correlation Examples

20+ Positive Correlation Examples
Understanding positive correlation is essential for interpreting relationships between variables in various fields, including economics, psychology, and natural sciences. A positive correlation indicates that as one variable increases, the other variable also increases. This relationship provides valuable insights into how interconnected factors behave and influence each other. Researchers and analysts use Scatter Plots, statistical methods to quantify the strength of these correlations, guiding decision-making and theoretical advancements. In this article, we will explore the concept of positive correlation, negative correlation its significance in data analysis, and its implications in real-world scenarios.
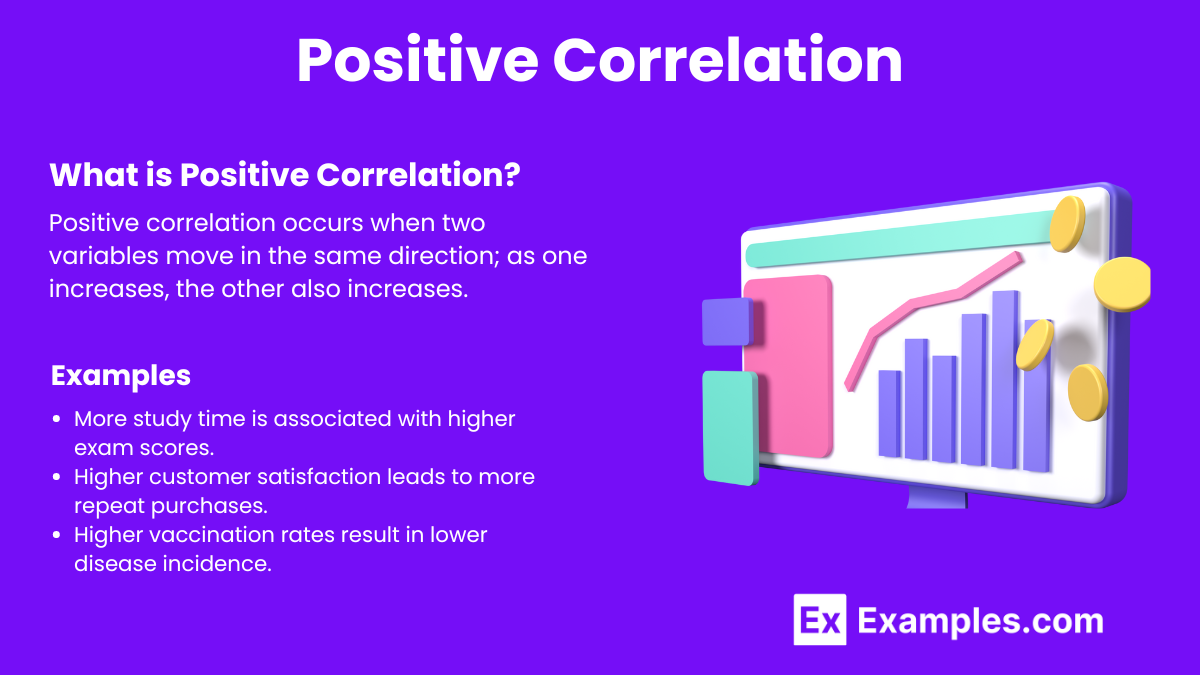
What is Positive Correlation?
A positive correlation exists when two variables move in the same direction, meaning that as one variable increases, the other variable also increases. This relationship is typically represented by a correlation coefficient that ranges from +0.01 to +1.00. A Correlation Hypothesis coefficient close to +1.00 indicates a strong positive correlation, where the variables show a direct and consistent relationship. This type of correlation is often visualized through a scatterplot where the points trend upwards as you move from left to right.
Positive Correlation Examples
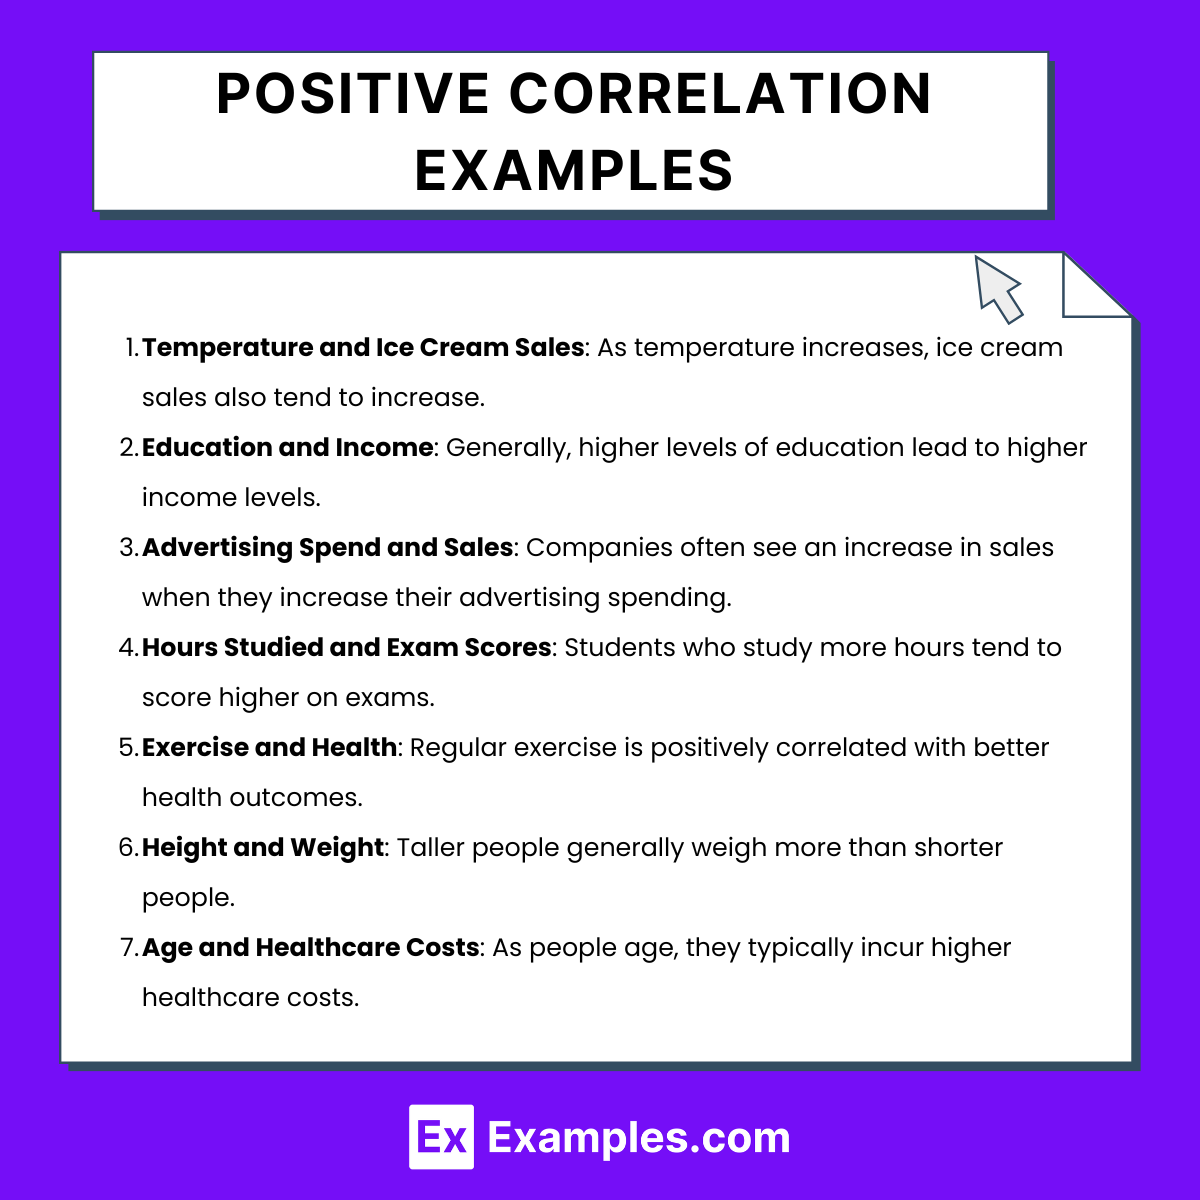
- Temperature and Ice Cream Sales: As temperature increases, ice cream sales also tend to increase.
- Education and Income: Generally, higher levels of education lead to higher income levels.
- Advertising Spend and Sales: Companies often see an increase in sales when they increase their advertising spending.
- Hours Studied and Exam Scores: Students who study more hours tend to score higher on exams.
- Exercise and Health: Regular exercise is positively correlated with better health outcomes.
- Height and Weight: Taller people generally weigh more than shorter people.
- Age and Healthcare Costs: As people age, they typically incur higher healthcare costs.
- Speed and Travel Time: Faster travel speeds usually result in shorter travel times.
- Population Density and Traffic: Areas with higher population density often experience more traffic congestion.
- Social Media Use and Connectivity: More frequent use of social media is associated with higher levels of connectivity with friends and family.
- Practice Time and Musical Ability: Musicians who practice more often tend to have better musical skills.
- Investment in Technology and Productivity: Companies that invest in new technology often see improvements in productivity.
- Savings and Financial Security: Higher savings rates are correlated with greater financial security.
- Rainfall and Agricultural Yield: In many regions, more rainfall leads to higher agricultural yields.
- Sunlight Exposure and Vitamin D Levels: More exposure to sunlight typically increases Vitamin D levels in the body.
- Number of Employees and Output: Larger companies with more employees can often produce more goods or services.
- Internet Speed and Download Times: Faster internet speeds reduce the time it takes to download files.
- Car Engine Size and Fuel Consumption: Larger engines generally consume more fuel.
- Age and Wisdom: Older individuals often have more life experience and wisdom, although this can be subjective.
- Customer Satisfaction and Loyalty: Higher customer satisfaction often leads to greater customer loyalty and repeat business.
Positive Correlation Examples In Table
| Field | Variables | Example |
|---|---|---|
| Education | Study Time & Exam Scores | More study time is associated with higher exam scores. |
| Business | Customer Satisfaction & Repeat Purchases | Higher customer satisfaction leads to more repeat purchases. |
| Public Health | Vaccination Rates & Disease Incidence | Higher vaccination rates result in lower disease incidence. |
| Manufacturing | Machine Maintenance & Production Efficiency | Regular maintenance leads to higher production efficiency. |
| Finance | Stock Market Performance & Economic Growth | Better stock market performance correlates with economic growth. |
| Marketing | Advertising Expenditure & Sales Revenue | Increased advertising expenditure boosts sales revenue. |
| Education | Interactive Teaching & Student Engagement | Interactive teaching methods increase student engagement. |
| Healthcare | Exercise & Blood Pressure | Regular exercise is linked to lower blood pressure. |
| Environment | Industrial Emissions & Air Pollution | Higher industrial emissions are associated with increased air pollution. |
Measuring Positive Correlation
Pearson Correlation Coefficient
The Pearson correlation coefficient, denoted as rrr, quantifies the degree to which two variables are linearly related. It ranges from -1 to +1, where +1 indicates a perfect positive linear relationship, 0 indicates no linear relationship, and -1 indicates a perfect negative linear relationship.
Steps to Compute
- Collect Data: Ensure you have paired data for the two variables.
- Calculate Means: Find the mean of each variable.
- Compute Deviations and Product: For each pair of values, calculate the difference from their respective means, multiply these deviations for pairs, and sum the results.
- Calculate Covariance: Divide the sum of the products by the number of observations minus one.
- Calculate Standard Deviations: Find the standard deviation for each variable.
- Compute Pearson’s rrr: Use the formula provided.
Spearman’s Rank Correlation Coefficient
If your data are ordinal or not normally distributed, you might use Spearman’s rank correlation coefficient. It assesses how well the relationship between two variables can be described using a monotonic function.
Using Software Tools
Most statistical software and spreadsheet programs can compute these correlation coefficients quickly. Common tools include Excel, SPSS, R, and Python, each offering functions or packages that facilitate the computation of Pearson and Spearman correlation coefficients.
Types of Positive Correlation
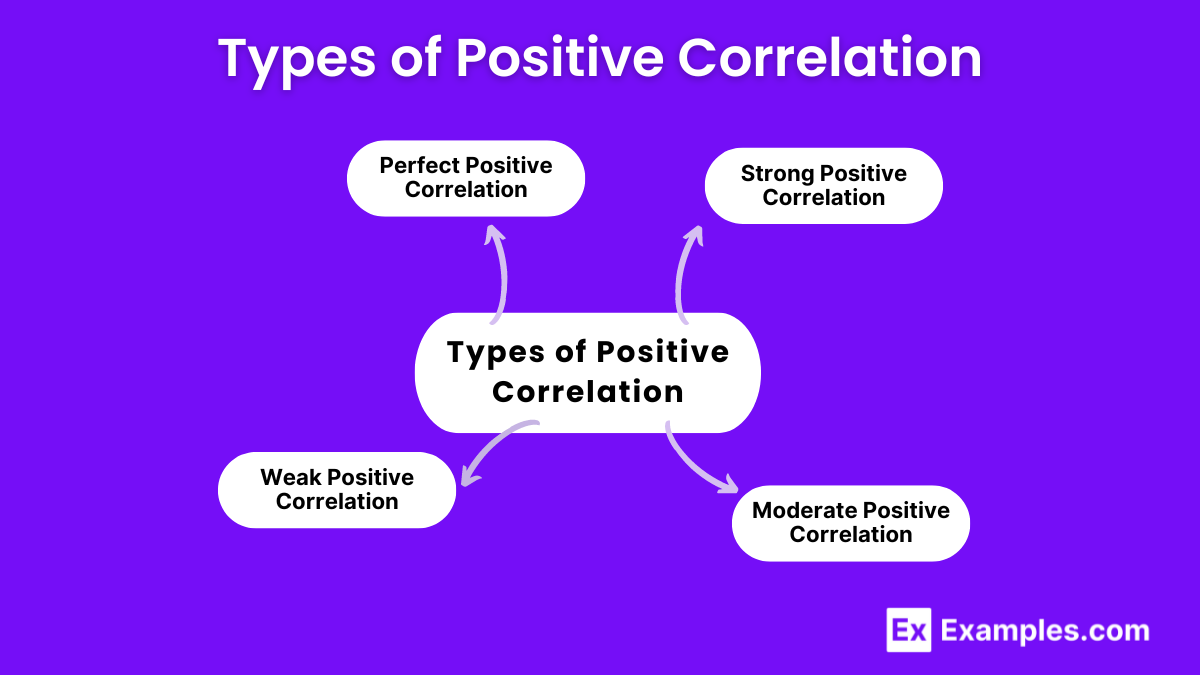
1. Perfect Positive Correlation
A perfect positive correlation occurs when two variables move in exactly the same proportion. If one variable increases by a certain percentage, the other variable also increases by the same percentage.
Example:
- Height and Weight: If a 10% increase in height leads to a 10% increase in weight, there is a perfect positive correlation between height and weight.
2. Strong Positive Correlation
A strong positive correlation means that the two variables have a high degree of association but are not perfectly correlated. Changes in one variable result in significant changes in the other, though not necessarily in the same proportion.
Example:
- Study Hours and Exam Scores: Students who spend more hours studying tend to score higher on exams, but the increase in scores may not be directly proportional to the increase in study hours.
3. Moderate Positive Correlation
In a moderate positive correlation, there is a noticeable, though not strong, relationship between two variables. While there is a positive trend, other factors may influence the variables.
Example:
- Exercise and Happiness Levels: People who exercise regularly tend to report higher levels of happiness, but other factors such as diet and sleep also play a role.
4. Weak Positive Correlation
A weak positive correlation indicates that there is a slight positive relationship between two variables. The variables tend to move in the same direction, but the relationship is not strong and can be easily influenced by other factors.
Example:
- Coffee Consumption and Productivity: Employees who drink coffee might show a slight increase in productivity, but the relationship is weak, In Simple Hypothesis factors can impact productivity.
How does positive correlation work?
Positive correlation occurs when two variables move in the same direction; as one variable increases, the other also increases, and as one decreases, the other decreases as well. This relationship is quantified by a correlation coefficient ranging from 0 to +1, where +1 indicates a perfect positive correlation. For example, in finance, if stock A and stock B have a positive correlation, an increase in the price of stock A is likely accompanied by an increase in the price of stock B. Positive correlation helps investors and analysts predict behavior, manage risk, and make more informed decisions by understanding how different assets or metrics are likely to interact.
Positive Correlation vs. Negative Correlation
| Feature | Positive Correlation | Negative Correlation |
|---|---|---|
| Definition | As one variable increases, the other also increases. | As one variable increases, the other decreases. |
| Coefficient Sign | The correlation coefficient (rrr) is positive (r>0r > 0r>0). | The correlation coefficient (rrr) is negative (r<0r < 0r<0). |
| Graphical Representation | The slope of the line of best fit is upward. | The slope of the line of best fit is downward. |
| Examples | Height and weight (typically, as height increases, weight increases). | Temperature and heating cost (as temperature increases, heating cost decreases). |
| Strength of Relationship | Strength increases as rrr approaches +1. | Strength increases as rrr approaches -1. |
Limitations of Positive Correlation Analysis
1. Correlation Does Not Imply Causation: Correlation analysis can show that two variables move together, but it cannot determine whether one variable causes the other to change. This can lead to incorrect assumptions about cause-and-effect relationships.
2. Sensitivity to Outliers: Outliers, or extreme values, can skew correlation results, making the relationship appear stronger or weaker than it actually is. This can lead to misleading interpretations.
3. Assumes Linear Relationship: Correlation measures the strength of a linear relationship between two variables. If the relationship is non-linear, correlation analysis may not provide an accurate representation of the relationship.
4. Ignores the Influence of Other Variables: Correlation analysis looks at the relationship between only two variables, neglecting the potential impact of other factors. This can result in an incomplete understanding of the relationships within the data.
5. Spurious Correlation: Sometimes, two variables may show a correlation by chance or due to the influence of a third, unmeasured variable. This can create a false impression of a meaningful relationship.
6. Static Snapshot: Correlation analysis provides a static view of the relationship between variables, not accounting for changes over time. This limitation makes it less useful for understanding dynamic relationships.
Zero Correlation
In statistics, zero correlation describes a relationship between two variables where no association exists. When two variables have a zero correlation, changes in one variable do not predict changes in the other.
Zero correlation means that there is no linear relationship between two variables. The correlation coefficient, represented by rrr, is used to quantify this relationship. When r=0r = 0r=0, it indicates that there is no linear association between the variables.
Characteristics of Zero Correlation
- No Predictive Power: Changes in one variable provide no information about changes in the other.
- Scatter Plot: A scatter plot of two variables with zero correlation will show points randomly dispersed, with no discernible pattern.
- Linearity: Zero correlation specifically refers to the absence of a linear relationship. Non-linear relationships might still exist even if the linear correlation is zero.
Examples of Zero Correlation
To better understand zero correlation, consider the following examples:
- Height and Favorite Color: There is no relationship between a person’s height and their favorite color. Knowing someone’s height doesn’t help predict their favorite color.
- Shoe Size and Intelligence: A person’s shoe size does not predict their intelligence. There is no association between these two variables.
Why Zero Correlation Matters
- Research: Helps researchers understand whether variables influence each other.
- Business: Informs decisions by identifying unrelated factors.
- Education: Assists in developing teaching methods by identifying non-related factors.
Positive Correlations in Psychology Research
Positive correlations are a fundamental concept in psychology research, helping researchers understand the relationships between different variables. In Correlational Study, When two variables exhibit a positive correlation, it means that as one variable increases, the other also increases. This relationship is pivotal in various psychological studies and applications.
Importance of Positive Correlations in Psychology
- Identifying Relationships: Positive correlations help psychologists identify and understand the relationships between different psychological phenomena.
- Predicting Outcomes: By understanding these relationships, psychologists can predict outcomes based on the presence of certain variables.
- Formulating Hypotheses: Positive correlations provide a basis for forming hypotheses about how different factors influence behavior and mental processes.
When to Use Positive Correlations
Positive correlations are used in various fields to identify and understand the relationship between two variables. Here are some key instances when positive correlations are beneficial:
1. Predicting Outcomes
Positive correlations help predict the outcome of one variable based on another. For example, in education, if there’s a positive correlation between study time and exam scores, educators can predict that students who study more tend to score higher.
2. Identifying Trends
Businesses and researchers use positive correlations to identify trends and patterns. For instance, companies might find a positive correlation between customer satisfaction and repeat purchases, indicating that happier customers are more likely to return.
3. Making Data-Driven Decisions
Positive correlations provide evidence for making informed decisions. For example, public health officials might observe a positive correlation between vaccination rates and reduced disease incidence, guiding them to promote vaccinations more vigorously.
4. Improving Processes
In manufacturing, positive correlations between machine maintenance and production efficiency can help identify practices that enhance productivity. Regular maintenance can be linked to fewer breakdowns and higher output.
5. Understanding Relationships
Researchers in social sciences use positive correlations to understand relationships between variables. For example, a positive correlation between physical activity and mental health suggests that increased exercise is associated with better mental well-being.
6. Financial Analysis
In finance, positive correlations are crucial for portfolio management. For instance, a positive correlation between stock market performance and economic growth helps investors make strategic investment choices.
7. Marketing Strategies
Marketers analyze positive correlations to refine their strategies. For example, a positive correlation between advertising expenditure and sales revenue can justify increased spending on advertising campaigns.
8. Educational Research
Educational researchers use positive correlations to study the impact of various teaching methods on student performance. For example, a positive correlation between interactive teaching techniques and student engagement can lead to the adoption of more interactive methods in classrooms.
9. Healthcare Studies
In healthcare, positive correlations between lifestyle factors and health outcomes guide interventions. For instance, a positive correlation between regular exercise and lower blood pressure can promote exercise programs for hypertension patients.
10. Environmental Studies
Environmental scientists use positive correlations to study the impact of human activities on the environment. For example, a positive correlation between industrial emissions and air pollution levels can drive policies to reduce emissions.
Applications of Positive Correlation
1. Economics and Finance
Positive correlation plays a significant role in economics and finance by helping analysts and investors understand the relationships between different economic indicators and financial assets.
Examples:
- Stock Prices and Economic Growth: When the economy grows, stock prices generally increase. Investors use this correlation to make investment decisions.
- Consumer Spending and Income: As household income rises, consumer spending typically increases. This correlation helps businesses forecast sales and manage inventory.
2. Education
In education, positive correlation can be used to understand the relationship between different educational variables and outcomes.
Examples:
- Study Time and Academic Performance: Students who spend more time studying tend to have higher academic performance. Educators can use this information to encourage effective study habits.
- Teacher Experience and Student Achievement: More experienced teachers often lead to better student achievement. This correlation can guide hiring practices and professional development programs.
3. Healthcare
Healthcare professionals use positive correlation to identify relationships between lifestyle factors and health outcomes, which aids in preventive measures and treatment planning.
Examples:
- Exercise and Physical Health: Regular physical activity is positively correlated with better physical health. Public health campaigns often promote exercise to improve community health.
- Diet and Chronic Diseases: Healthy diets are associated with lower rates of chronic diseases such as diabetes and heart disease. Nutritionists use this correlation to advise patients on dietary choices.
4. Marketing
Marketers utilize positive correlation to understand consumer behavior and optimize marketing strategies.
Examples:
- Advertising and Sales: Increased advertising expenditure is often correlated with higher sales. Companies allocate budgets to advertising campaigns based on this relationship.
- Customer Satisfaction and Loyalty: Higher customer satisfaction is positively correlated with customer loyalty. Businesses focus on improving satisfaction to retain customers.
5. Environmental Studies
In environmental science, positive correlation helps in understanding the impact of human activities on the environment and developing sustainable practices.
Examples:
- Carbon Emissions and Global Warming: Higher carbon emissions are correlated with global warming. Policymakers use this correlation to implement regulations aimed at reducing emissions.
- Deforestation and Biodiversity Loss: Increased deforestation leads to a loss of biodiversity. Conservation efforts are guided by this relationship to protect endangered species.
6. Social Sciences
Social scientists use positive correlation to study human behavior and social phenomena.
Examples:
- Education Level and Income: Higher levels of education are generally associated with higher income levels. This correlation informs policies aimed at improving educational access and reducing poverty.
- Social Media Usage and Social Connectivity: Increased use of social media is correlated with higher levels of social connectivity. Researchers study this relationship to understand the impact of social media on society.
What is positive correlation?
Positive correlation occurs when two variables move in the same direction; as one increases, the other also increases.
How is positive correlation measured?
Positive correlation is measured using the correlation coefficient, ranging from 0 to +1, where +1 indicates a perfect positive correlation.
What is an example of positive correlation?
An example of positive correlation is the relationship between hours studied and test scores; more study hours usually lead to higher scores.
Why is positive correlation important?
Positive correlation helps identify relationships between variables, aiding in predictions and decision-making processes in various fields.
What does a correlation coefficient of +0.8 indicate?
A correlation coefficient of +0.8 indicates a strong positive correlation between two variables.
Can positive correlation be causal?
Positive correlation does not imply causation; it only indicates a relationship between variables, not that one causes the other.
What are some fields that use positive correlation?
Fields such as finance, economics, psychology, and medicine use positive correlation to analyze data and predict trends.
How does positive correlation differ from negative correlation?
Positive correlation means variables move in the same direction, while negative correlation means they move in opposite directions.
What is a weak positive correlation?
A weak positive correlation is when the correlation coefficient is close to 0, indicating a slight relationship between variables.
How can you visualize positive correlation?
Positive correlation can be visualized using scatter plots, where points form an upward sloping pattern from left to right.
Share :
