10+ Data Analysis in Research Examples

10+ Data Analysis in Research Examples
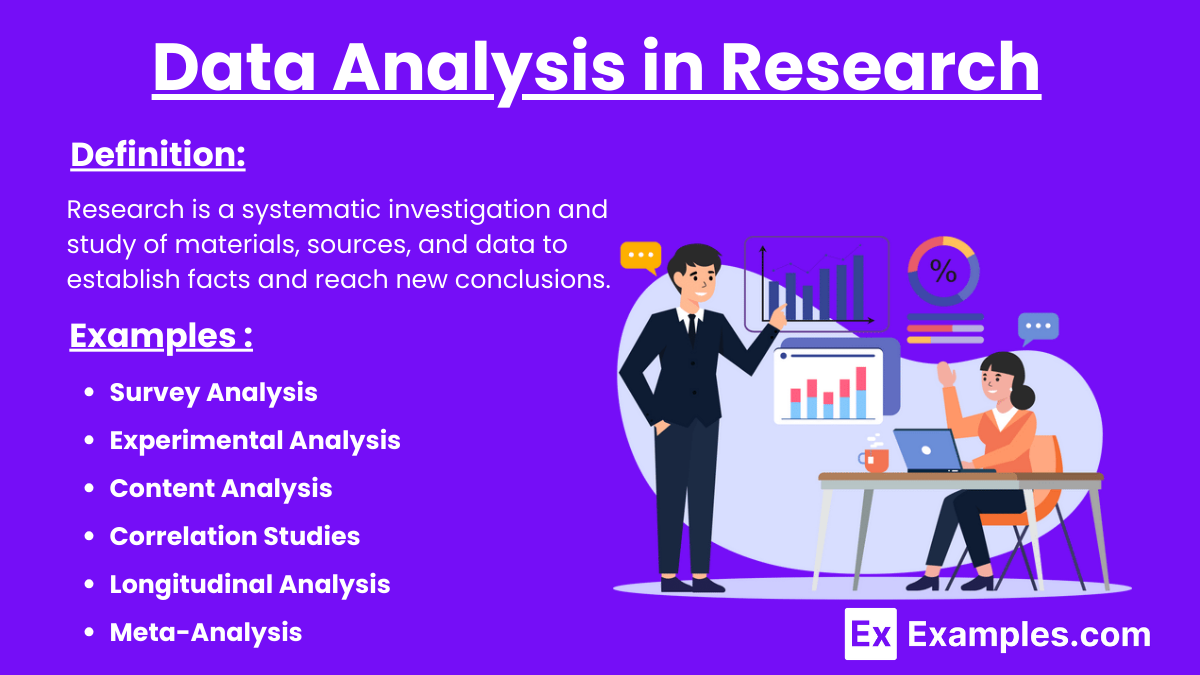
Data analysis in research involves systematically applying statistical and logical techniques to describe, illustrate, condense, and evaluate data. It is a crucial step that enables researchers to identify patterns, relationships, and trends within the data, transforming raw information into valuable insights. Through methods such as descriptive statistics, inferential statistics, and qualitative analysis, researchers can interpret their findings, draw conclusions, and support decision-making processes. An effective data analysis plan and robust methodology ensure the accuracy and reliability of research outcomes, ultimately contributing to the advancement of knowledge across various fields.
What is Data Analysis in Research?
Data analysis in research involves using statistical and logical techniques to describe, summarize, and compare collected data. This includes inspecting, cleaning, transforming, and modeling data to find useful information and support decision-making. Quantitative data provides measurable insights, and a solid research design ensures accuracy and reliability. This process helps validate hypotheses, identify patterns, and make informed conclusions, making it a crucial step in the scientific method.
Examples of Data analysis in Research
- Survey Analysis: Researchers collect survey responses from a sample population to gauge opinions, behaviors, or characteristics. Using descriptive statistics, they summarize the data through means, medians, and modes, and then inferential statistics to generalize findings to a larger population.
- Experimental Analysis: In scientific experiments, researchers manipulate one or more variables to observe the effect on a dependent variable. Data is analyzed using methods such as ANOVA or regression analysis to determine if changes in the independent variable(s) significantly affect the dependent variable.
- Content Analysis: Qualitative research often involves analyzing textual data, such as interview transcripts or open-ended survey responses. Researchers code the data to identify recurring themes, patterns, and categories, providing a deeper understanding of the subject matter.
- Correlation Studies: Researchers explore the relationship between two or more variables using correlation coefficients. For example, a study might examine the correlation between hours of study and academic performance to identify if there is a significant positive relationship.
- Longitudinal Analysis: This type of analysis involves collecting data from the same subjects over a period of time. Researchers analyze this data to observe changes and developments, such as studying the long-term effects of a specific educational intervention on student achievement.
- Meta-Analysis: By combining data from multiple studies, researchers perform a meta-analysis to increase the overall sample size and enhance the reliability of findings. This method helps in synthesizing research results to draw broader conclusions about a particular topic or intervention.
Data analysis in Qualitative Research
Data analysis in qualitative research involves systematically examining non-numeric data, such as interviews, observations, and textual materials, to identify patterns, themes, and meanings. Here are some key steps and methods used in qualitative data analysis:
- Coding: Researchers categorize the data by assigning labels or codes to specific segments of the text. These codes represent themes or concepts relevant to the research question.
- Thematic Analysis: This method involves identifying and analyzing patterns or themes within the data. Researchers review coded data to find recurring topics and construct a coherent narrative around these themes.
- Content Analysis: A systematic approach to categorize verbal or behavioral data to classify, summarize, and tabulate the data. This method often involves counting the frequency of specific words or phrases.
- Narrative Analysis: Researchers focus on the stories and experiences shared by participants, analyzing the structure, content, and context of the narratives to understand how individuals make sense of their experiences.
- Grounded Theory: This method involves generating a theory based on the data collected. Researchers collect and analyze data simultaneously, continually refining and adjusting their theoretical framework as new data emerges.
- Discourse Analysis: Examining language use and communication patterns within the data, researchers analyze how language constructs social realities and power relationships.
- Case Study Analysis: An in-depth analysis of a single case or multiple cases, exploring the complexities and unique aspects of each case to gain a deeper understanding of the phenomenon under study.
Data analysis in Quantitative Research
Data analysis in quantitative research involves the systematic application of statistical techniques to numerical data to identify patterns, relationships, and trends. Here are some common methods used in quantitative data analysis:
- Descriptive Statistics: This includes measures such as mean, median, mode, standard deviation, and range, which summarize and describe the main features of a data set.
- Inferential Statistics: Techniques like t-tests, chi-square tests, and ANOVA (Analysis of Variance) are used to make inferences or generalizations about a population based on a sample.
- Regression Analysis: This method examines the relationship between dependent and independent variables. Simple linear regression analyzes the relationship between two variables, while multiple regression examines the relationship between one dependent variable and several independent variables.
- Correlation Analysis: Researchers use correlation coefficients to measure the strength and direction of the relationship between two variables.
- Factor Analysis: This technique is used to identify underlying relationships between variables by grouping them into factors based on their correlations.
- Cluster Analysis: A method used to group a set of objects or cases into clusters, where objects in the same cluster are more similar to each other than to those in other clusters.
- Hypothesis Testing: This involves testing an assumption or hypothesis about a population parameter. Common tests include z-tests, t-tests, and chi-square tests, which help determine if there is enough evidence to reject the null hypothesis.
- Time Series Analysis: This method analyzes data points collected or recorded at specific time intervals to identify trends, cycles, and seasonal variations.
- Multivariate Analysis: Techniques like MANOVA (Multivariate Analysis of Variance) and PCA (Principal Component Analysis) are used to analyze data that involves multiple variables to understand their effect and relationships.
- Structural Equation Modeling (SEM): A multivariate statistical analysis technique that is used to analyze structural relationships. This method is a combination of factor analysis and multiple regression analysis and is used to analyze the structural relationship between measured variables and latent constructs.
Data analysis in Research Methodology
Data analysis in research methodology involves the process of systematically applying statistical and logical techniques to describe, condense, recap, and evaluate data. Here are the key components and methods involved:
- Data Preparation: This step includes collecting, cleaning, and organizing raw data. Researchers ensure data quality by handling missing values, removing duplicates, and correcting errors.
- Descriptive Analysis: Researchers use descriptive statistics to summarize the basic features of the data. This includes measures such as mean, median, mode, standard deviation, and graphical representations like histograms and pie charts.
- Inferential Analysis: This involves using statistical tests to make inferences about the population from which the sample was drawn. Common techniques include t-tests, chi-square tests, ANOVA, and regression analysis.
- Qualitative Data Analysis: For non-numeric data, researchers employ methods like coding, thematic analysis, content analysis, narrative analysis, and discourse analysis to identify patterns and themes.
- Quantitative Data Analysis: For numeric data, researchers apply statistical methods such as correlation, regression, factor analysis, cluster analysis, and time series analysis to identify relationships and trends.
- Hypothesis Testing: Researchers test hypotheses using statistical methods to determine whether there is enough evidence to reject the null hypothesis. This involves calculating p-values and confidence intervals.
- Data Interpretation: This step involves interpreting the results of the data analysis. Researchers draw conclusions based on the statistical findings and relate them back to the research questions and objectives.
- Validation and Reliability: Ensuring the validity and reliability of the analysis is crucial. Researchers check for consistency in the results and use methods like cross-validation and reliability testing to confirm their findings.
- Visualization: Effective data visualization techniques, such as charts, graphs, and plots, are used to present the data in a clear and understandable manner, aiding in the interpretation and communication of results.
- Reporting: The final step involves reporting the results in a structured format, often including an introduction, methodology, results, discussion, and conclusion. This report should clearly convey the findings and their implications for the research question.
Types of Data analysis in Research
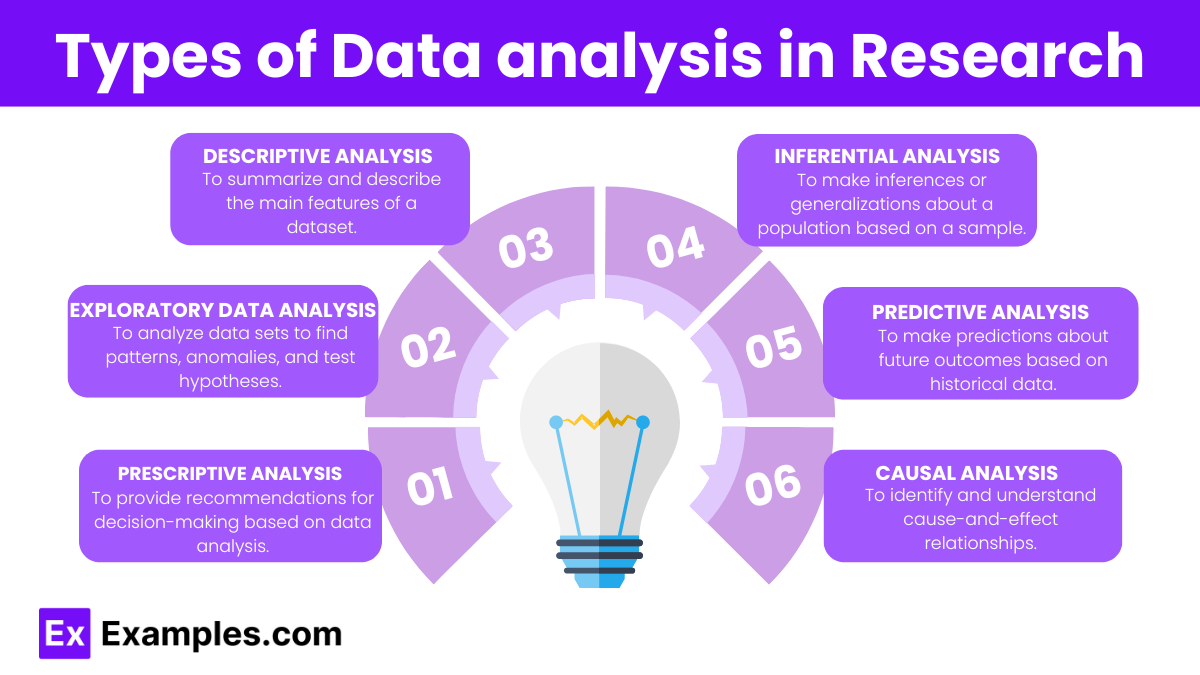
- Descriptive Analysis:
- Purpose: To summarize and describe the main features of a dataset.
- Methods: Mean, median, mode, standard deviation, frequency distributions, and graphical representations like histograms and pie charts.
- Example: Calculating the average test scores of students in a class.
- Inferential Analysis:
- Purpose: To make inferences or generalizations about a population based on a sample.
- Methods: T-tests, chi-square tests, ANOVA (Analysis of Variance), regression analysis, and confidence intervals.
- Example: Testing whether a new teaching method significantly affects student performance compared to a traditional method.
- Exploratory Data Analysis (EDA):
- Purpose: To analyze data sets to find patterns, anomalies, and test hypotheses.
- Methods: Visualization techniques like box plots, scatter plots, and heat maps; summary statistics.
- Example: Visualizing the relationship between hours of study and exam scores using a scatter plot.
- Predictive Analysis:
- Purpose: To make predictions about future outcomes based on historical data.
- Methods: Regression analysis, machine learning algorithms (e.g., decision trees, neural networks), and time series analysis.
- Example: Predicting student graduation rates based on their academic performance and demographic data.
- Prescriptive Analysis:
- Purpose: To provide recommendations for decision-making based on data analysis.
- Methods: Optimization algorithms, simulation, and decision analysis.
- Example: Suggesting the best course of action for improving student retention rates based on various predictive factors.
- Causal Analysis:
- Purpose: To identify and understand cause-and-effect relationships.
- Methods: Controlled experiments, regression analysis, path analysis, and structural equation modeling (SEM).
- Example: Determining the impact of a specific intervention, like a new curriculum, on student learning outcomes.
- Mechanistic Analysis:
- Purpose: To understand the specific mechanisms through which variables affect one another.
- Methods: Detailed modeling and simulation, often used in scientific research to understand biological or physical processes.
- Example: Studying how a specific drug interacts with biological pathways to affect patient health.
How to write Data analysis in Research
Data analysis is crucial for interpreting collected data and drawing meaningful conclusions. Follow these steps to write an effective data analysis section in your research.
1. Prepare Your Data
Ensure your data is clean and organized:
- Remove duplicates and irrelevant data.
- Check for errors and correct them.
- Categorize data if necessary.
2. Choose the Right Analysis Method
Select a method that fits your data type and research question:
- Quantitative Data: Use statistical analysis such as t-tests, ANOVA, regression analysis.
- Qualitative Data: Use thematic analysis, content analysis, or narrative analysis.
3. Describe Your Analytical Techniques
Clearly explain the methods you used:
- Software and Tools: Mention any software (e.g., SPSS, NVivo) used.
- Statistical Tests: Detail the statistical tests applied, such as chi-square tests or correlation analysis.
- Qualitative Techniques: Describe coding and theme identification processes.
4. Present Your Findings
Organize your findings logically:
- Use Tables and Figures: Display data in tables, graphs, and charts for clarity.
- Summarize Key Results: Highlight the most significant findings.
- Include Relevant Statistics: Report p-values, confidence intervals, means, and standard deviations.
5. Interpret the Results
Explain what your findings mean in the context of your research:
- Compare with Hypotheses: State whether the results support your hypotheses.
- Relate to Literature: Compare your results with previous studies.
- Discuss Implications: Explain the significance of your findings.
6. Discuss Limitations
Acknowledge any limitations in your data or analysis:
- Sample Size: Note if the sample size was small.
- Biases: Mention any potential biases in data collection.
- External Factors: Discuss any factors that might have influenced the results.
7. Conclude with a Summary
Wrap up your data analysis section:
- Restate Key Findings: Briefly summarize the main results.
- Future Research: Suggest areas for further investigation.
Importance of Data analysis in Research
Data analysis is a fundamental component of the research process. Here are five key points highlighting its importance:
- Enhances Accuracy and Reliability
Data analysis ensures that research findings are accurate and reliable. By using statistical techniques, researchers can minimize errors and biases, ensuring that the results are dependable. - Facilitates Informed Decision-Making
Through data analysis, researchers can make informed decisions based on empirical evidence. This is crucial in fields like healthcare, business, and social sciences, where decisions impact policies, strategies, and outcomes. - Identifies Trends and Patterns
Analyzing data helps researchers uncover trends and patterns that might not be immediately visible. These insights can lead to new hypotheses and areas of study, advancing knowledge in the field. - Supports Hypothesis Testing
Data analysis is vital for testing hypotheses. Researchers can use statistical methods to determine whether their hypotheses are supported or refuted, which is essential for validating theories and advancing scientific understanding. - Provides a Basis for Predictions
By analyzing current and historical data, researchers can develop models that predict future outcomes. This predictive capability is valuable in numerous fields, including economics, climate science, and public health.
FAQ’s
What is the difference between qualitative and quantitative data analysis?
Qualitative analysis focuses on non-numerical data to understand concepts, while quantitative analysis deals with numerical data to identify patterns and relationships.
What is descriptive statistics?
Descriptive statistics summarize and describe the features of a data set, including measures like mean, median, mode, and standard deviation.
What is inferential statistics?
Inferential statistics use sample data to make generalizations about a larger population, often through hypothesis testing and confidence intervals.
What is regression analysis?
Regression analysis examines the relationship between dependent and independent variables, helping to predict outcomes and understand variable impacts.
What is the role of software in data analysis?
Software like SPSS, R, and Excel facilitate data analysis by providing tools for statistical calculations, visualization, and data management.
What are data visualization techniques?
Data visualization techniques include charts, graphs, and maps, which help in presenting data insights clearly and effectively.
What is data cleaning?
Data cleaning involves removing errors, inconsistencies, and missing values from a data set to ensure accuracy and reliability in analysis.
What is the significance of sample size in data analysis?
Sample size affects the accuracy and generalizability of results; larger samples generally provide more reliable insights.
How does correlation differ from causation?
Correlation indicates a relationship between variables, while causation implies one variable directly affects the other.
What are the ethical considerations in data analysis?
Ethical considerations include ensuring data privacy, obtaining informed consent, and avoiding data manipulation or misrepresentation.
Share :
