In a Chi-Square test for independence, what does the Chi-Square statistic measure?
The correlation between two variables
The variance within groups
The difference between observed and expected frequencies
The mean of a sample
of 10

The chi-square test, a cornerstone of statistical analysis, is utilized to examine the independence of two categorical variables, offering a method to assess observed versus expected frequencies in categorical data. This test extends beyond basic algebra and rational numbers, involving computations with square and square roots, which are integral in determining the chi-square statistic. Unlike dealing with integers or continuous rational and irrational numbers directly, this test quantifies how much observed counts deviate from expected counts in categorical data, rooted in the realm of probability and discrete mathematics. Additionally, while it diverges from the least squares method used for continuous data regression, both share a common goal of minimizing deviation to optimize fit between observed and expected models. In statistics, understanding and applying the chi-square test provides crucial insights into data relationships, crucial for robust analytical conclusions in research and real-world applications.
The chi-square distribution is a fundamental probability distribution in statistics, widely used in hypothesis testing and confidence interval estimation for variance. It arises primarily when summing the squares of independent, standard normal variables, and is characterized by its degrees of freedom, which influence its shape. As the degrees of freedom increase, the distribution becomes more symmetric and approaches a normal distribution. This distribution is crucial in constructing the chi-square test for independence and goodness-of-fit tests, helping to determine whether observed frequencies significantly deviate from expected frequencies under a given hypothesis. It is also integral to the analysis of variance (ANOVA) and other statistical procedures that assess the variability among group means.
The p-value represents the probability of observing a test statistic as extreme as, or more extreme than, the value calculated from the sample data, under the null hypothesis. A low p-value (typically less than 0.05) suggests that the observed data is inconsistent with the null hypothesis, leading to its rejection.
Depending on the statistical test being used (like t-test, chi-square test, ANOVA, etc.), first calculate the appropriate test statistic based on your data. This involves different formulas depending on the test and the data structure.
Identify the distribution that the test statistic follows under the null hypothesis. For example, the test statistic in a chi-square test follows a chi-square distribution, while a t-test statistic follows a t-distribution.
Use the distribution identified in Step 3 to find the probability of obtaining a test statistic as extreme as the one you calculated. This can be done using statistical software, tables, or online calculators. You will compare your test statistic to the critical values from the distribution, calculating the area under the curve that lies beyond the test statistic.
For a simpler illustration, suppose you’re conducting a two-tailed t-test with a t-statistic of 2.3, and you’re using a significance level of 0.05. You would:
The Chi-Square Test of Independence assesses whether two categorical variables are independent, meaning whether the distribution of one variable differs depending on the value of the other variable.
Before conducting the test, certain assumptions must be met:
| Pet Ownership | Prefers Organic Pet Food | Prefers Non-Organic Pet Food | Total |
|---|---|---|---|
| Owns a Pet | 120 | 80 | 200 |
| Does Not Own a Pet | 60 | 140 | 200 |
| Total | 180 | 220 | 400 |
Below is the representation of a chi-square distribution table with three probability levels (commonly used significance levels: 0.05, 0.01, and 0.001) for degrees of freedom up to 50. The degrees of freedom (DF) for a chi-square test in a contingency table are calculated as (r-1)(c-1), where r is the number of rows and c is the number of columns. This table is vital for determining critical values when testing hypotheses involving categorical data.
| Degrees of Freedom (DF) | χ² at p=0.05 | χ² at p=0.01 | χ² at p=0.001 |
|---|---|---|---|
| 1 | 3.84 | 6.63 | 10.83 |
| 2 | 5.99 | 9.21 | 13.82 |
| 3 | 7.81 | 11.34 | 16.27 |
| 4 | 9.49 | 13.28 | 18.47 |
| 5 | 11.07 | 15.09 | 20.52 |
| 6 | 12.59 | 16.81 | 22.46 |
| 7 | 14.07 | 18.48 | 24.32 |
| 8 | 15.51 | 20.09 | 26.12 |
| 9 | 16.92 | 21.67 | 27.88 |
| 10 | 18.31 | 23.21 | 29.59 |
| 11 | 19.68 | 24.72 | 31.26 |
| 12 | 21.03 | 26.22 | 32.91 |
| 13 | 22.36 | 27.69 | 34.53 |
| 14 | 23.68 | 29.14 | 36.12 |
| 15 | 24.99 | 30.58 | 37.70 |
| 16 | 26.30 | 32.00 | 39.25 |
| 17 | 27.59 | 33.41 | 40.79 |
| 18 | 28.87 | 34.81 | 42.31 |
| 19 | 30.14 | 36.19 | 43.82 |
| 20 | 31.41 | 37.57 | 45.32 |
| 21 | 32.67 | 38.93 | 46.80 |
| 22 | 33.92 | 40.29 | 48.27 |
| 23 | 35.17 | 41.64 | 49.73 |
| 24 | 36.42 | 42.98 | 51.18 |
| 25 | 37.65 | 44.31 | 52.62 |
| 26 | 38.89 | 45.64 | 54.05 |
| 27 | 40.11 | 46.96 | 55.48 |
| 28 | 41.34 | 48.28 | 56.89 |
| 29 | 42.56 | 49.59 | 58.30 |
| 30 | 43.77 | 50.89 | 59.70 |
| 31 | 44.99 | 52.19 | 61.09 |
| 32 | 46.19 | 53.49 | 62.48 |
| 33 | 47.40 | 54.78 | 63.87 |
| 34 | 48.60 | 56.06 | 65.25 |
| 35 | 49.80 | 57.34 | 66.62 |
| 36 | 51.00 | 58.62 | 67.99 |
| 37 | 52.19 | 59.89 | 69.36 |
| 38 | 53.38 | 61.16 | 70.72 |
| 39 | 54.57 | 62.43 | 72.07 |
| 40 | 55.76 | 63.69 | 73.42 |
| 41 | 56.94 | 64.95 | 74.77 |
| 42 | 58.12 | 66.21 | 76.11 |
| 43 | 59.30 | 67.46 | 77.45 |
| 44 | 60.48 | 68.71 | 78.79 |
| 45 | 61.66 | 69.96 | 80.12 |
| 46 | 62.83 | 71.20 | 81.45 |
| 47 | 64.00 | 72.44 | 82.78 |
| 48 | 65.17 | 73.68 | 84.10 |
| 49 | 66.34 | 74.92 | 85.42 |
| 50 | 67.50 | 76.15 | 86.74 |
This table provides critical values for various degrees of freedom and significance levels, which can be used to determine the likelihood of observing a chi-square statistic at least as extreme as the test statistic calculated from your data, under the assumption that the null hypothesis is true.
The Chi-square test for independence is a statistical test commonly used to determine if there is a significant relationship between two categorical variables in a population. Let’s go through a detailed example to understand how to apply this test.
Imagine a researcher wants to investigate whether gender (male or female) affects the choice of a major (science or humanities) among university students.
The researcher surveys a sample of 300 students and compiles the data into the following contingency table:
| Major | Male | Female | Total |
|---|---|---|---|
| Science | 70 | 80 | 150 |
| Humanities | 60 | 90 | 150 |
| Total | 130 | 170 | 300 |
Eᵢⱼ = (Row Total×Column Total)/Total Observations
For the ‘Male & Science’ cell:
𝐸ₘₐₗₑ, ₛ꜀ᵢₑₙ꜀ₑ = (150×130)/300 = 65
Repeat this for each cell.
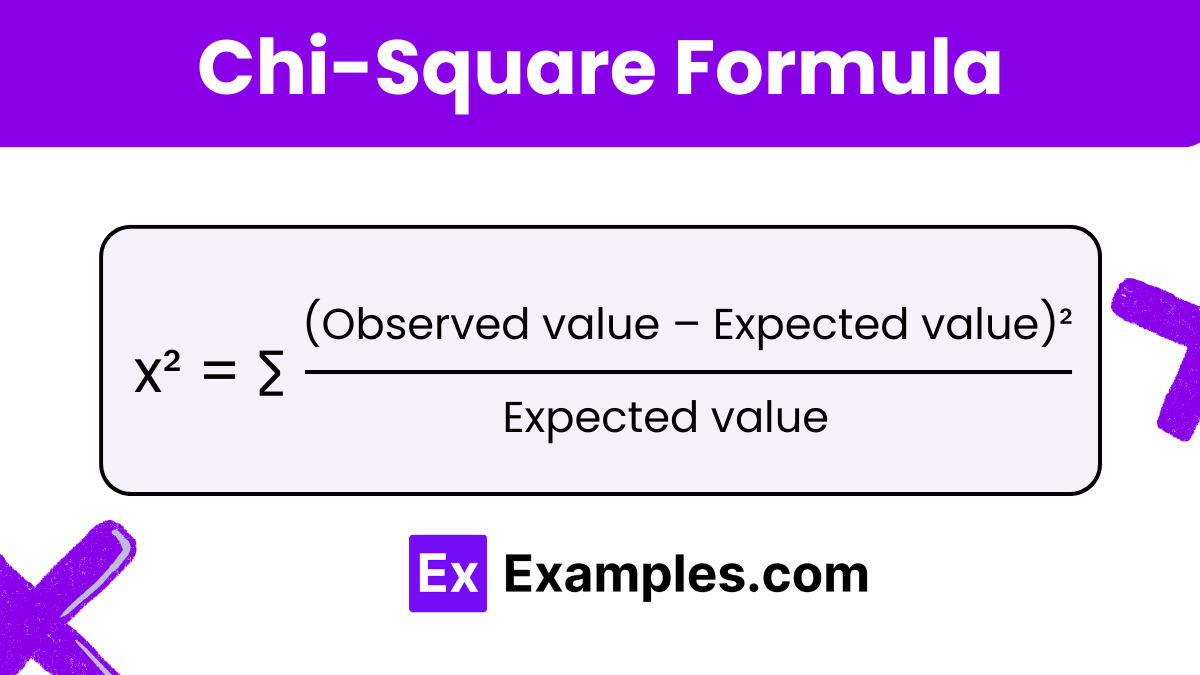
The chi-square statistic is calculated using:
χ² = ∑(O−E)²/E
Where 𝑂 is the observed frequency, and 𝐸 is the expected frequency. For each cell:
χ² = 65(70−65)²+85(80−85)²+65(60−65)²+85(90−85) = 1.615
With 1 degree of freedom (df = (rows – 1)/ times (columns – 1)), check the critical value from the chi-square distribution table at the desired significance level (e.g., 0.05). If 𝜒² calculated is greater than the critical value from the table, reject the null hypothesis.
The Chi-Square value indicates how much the observed frequencies deviate from the expected frequencies under the null hypothesis of independence. A higher Chi-Square value suggests a greater deviation, which may lead to the rejection of the null hypothesis if the value exceeds the critical value from the Chi-Square distribution table for the given degrees of freedom and significance level.
To interpret the results of a Chi-Square Test, compare the calculated Chi-Square statistic to the critical value from the Chi-Square distribution table at your chosen significance level (commonly 0.05 or 0.01). If the calculated value is greater than the critical value, reject the null hypothesis, suggesting a significant association between the variables. If it is less, fail to reject the null hypothesis, indicating no significant association.
The Chi-Square Test assumes that the data are from a random sample, observations are independent, and expected frequencies are sufficiently large, typically at least 5 in each cell of the table. When these conditions are not met, the test results may not be valid. Additionally, the test does not provide information about the direction or strength of the association, only its existence.

In a Chi-Square test for independence, what does the Chi-Square statistic measure?
The correlation between two variables
The variance within groups
The difference between observed and expected frequencies
The mean of a sample
What is the purpose of the Chi-Square test of goodness of fit?
To test if there is a significant relationship between two categorical variables
To compare means across different groups
To determine if the observed frequencies fit a specific distribution
To test the variance within a sample
What type of data is appropriate for the Chi-Square test?
Quantitative data
Ordinal data
Categorical data
Continuous data
If a Chi-Square test yields a p-value of 0.03, what does this indicate if the significance level is set at 0.05?
The result is not significant
The result is significant
There is no evidence of a relationship
The test needs to be repeated
How do you determine the degrees of freedom in a Chi-Square test for independence?
Number of categories minus one
(Number of rows - 1) × (Number of columns - 1)
Total number of observations
Number of rows plus number of columns
What does a high Chi-Square value typically indicate?
A close match between observed and expected frequencies
A significant difference between observed and expected frequencies
No relationship between variables
Equal variances among groups
What is the null hypothesis in a Chi-Square test for independence?
There is no association between the variables
The means of the variables are equal
The variance of the groups is equal
The frequencies are uniformly distributed
Which of the following is NOT a requirement for conducting a Chi-Square test?
Expected frequency in each cell should be at least 5
Observations should be independent
Data should be in categorical form
Data should be normally distributed
What is the primary assumption of the Chi-Square test?
Data is normally distributed
Observations are dependent
Observations are independent
Data is measured on an interval scale
In a Chi-Square test of goodness of fit, what would you conclude if the Chi-Square statistic is very small?
The observed and expected frequencies are very different
The observed and expected frequencies are very similar
The test results are inconclusive
The sample size is too large