In a dataset of 5, 7, 8, 10, and 12, what is the median?
7
8
9
10
of 10

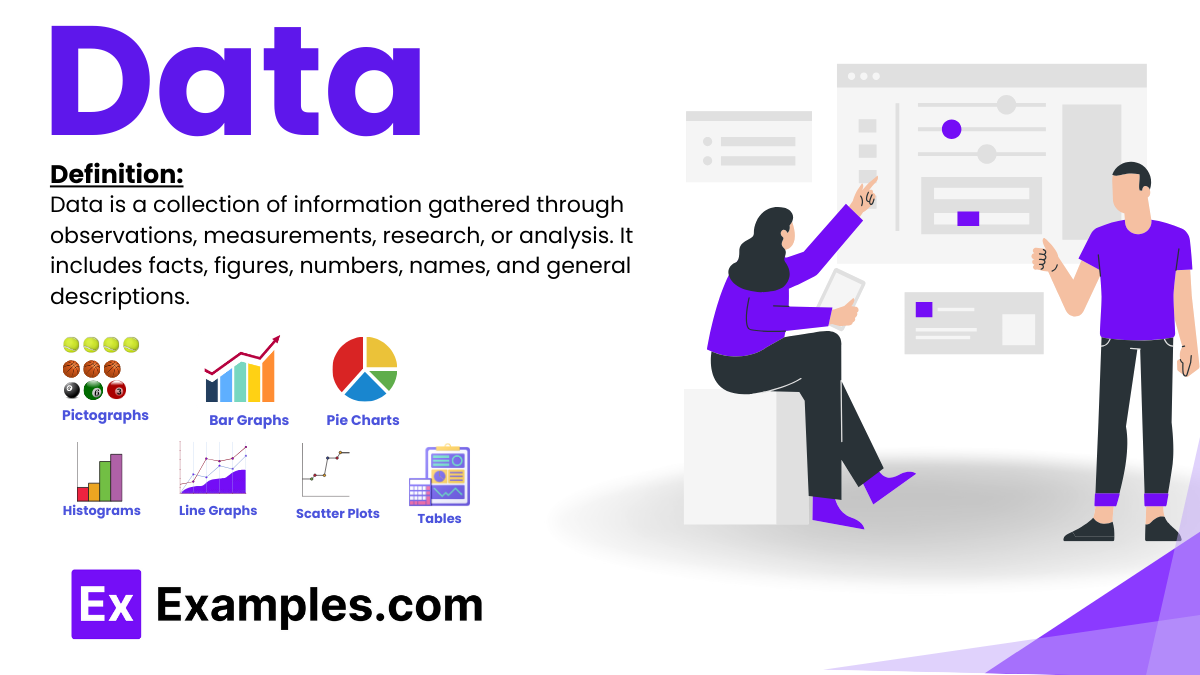
Data is a collection of information gathered through observations, measurements, research, or analysis. It includes facts, figures, numbers, names, and general descriptions. Organizing data in the form of graphs, charts, or tables enhances its readability and ease of study. Data scientists play a crucial role in analyzing this data through data mining techniques.
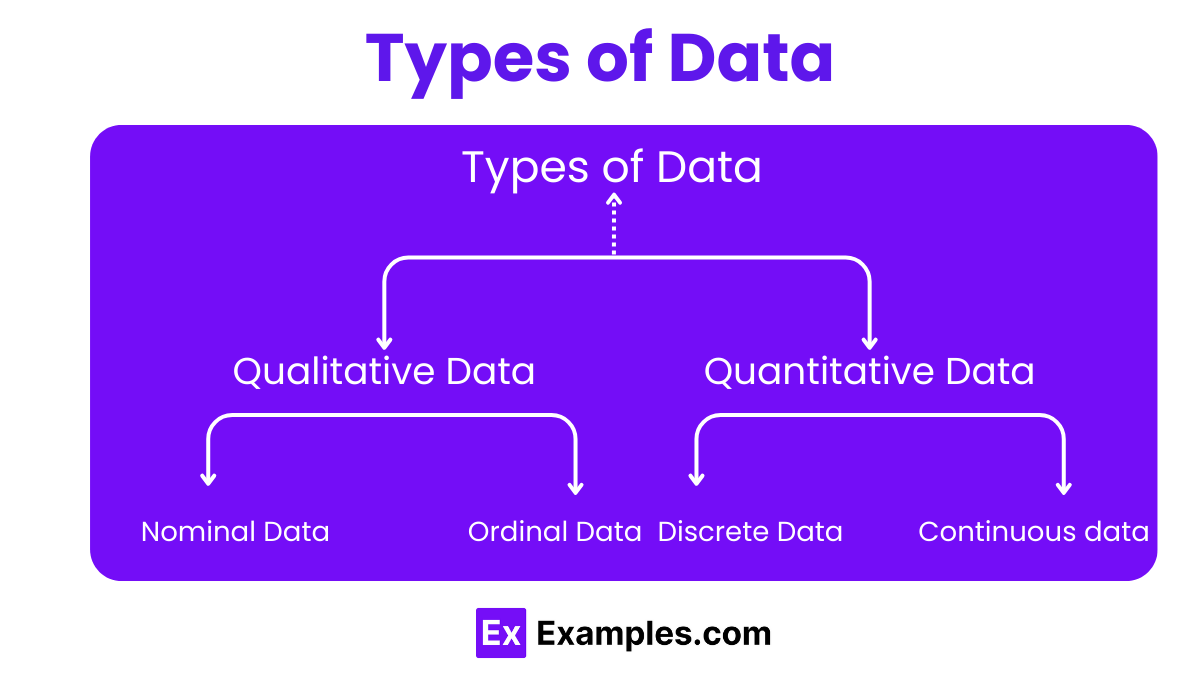
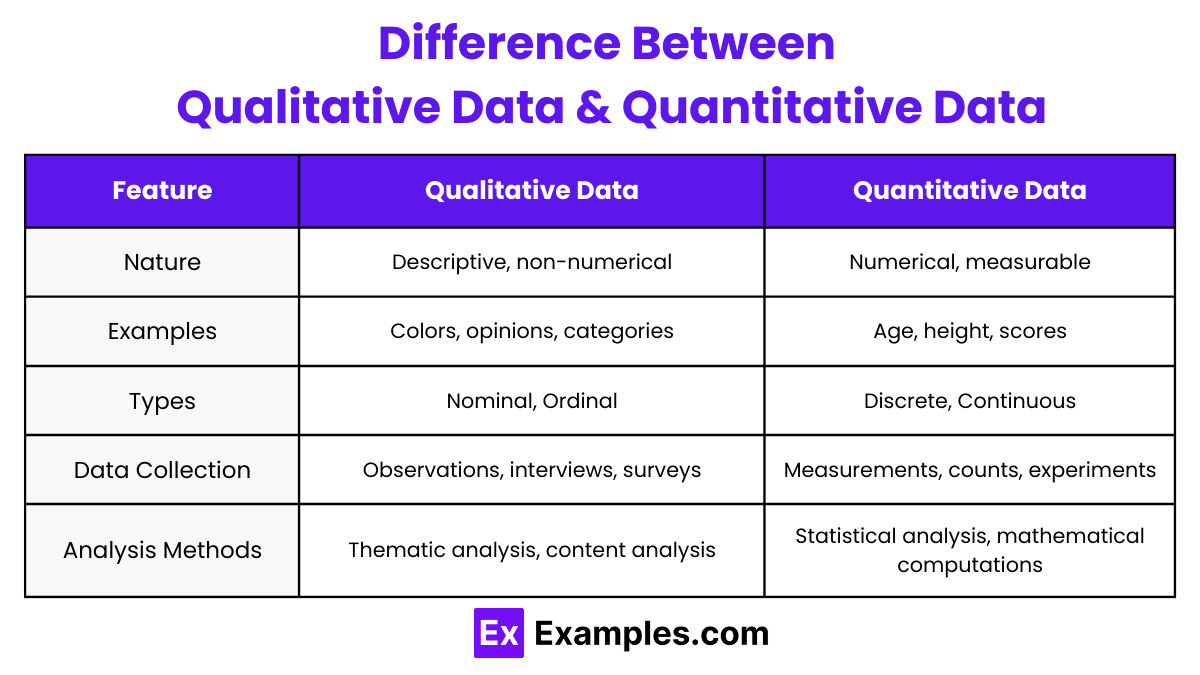
Definition: Qualitative data is descriptive and non-numerical. It provides information about qualities and characteristics and is often collected through observations, interviews, or surveys.
Examples:
Types of Qualitative Data:
Definition: Quantitative data is numerical and can be measured or counted. It often represents quantities or amounts and is used for statistical analysis.
Examples:
Types of Quantitative Data:
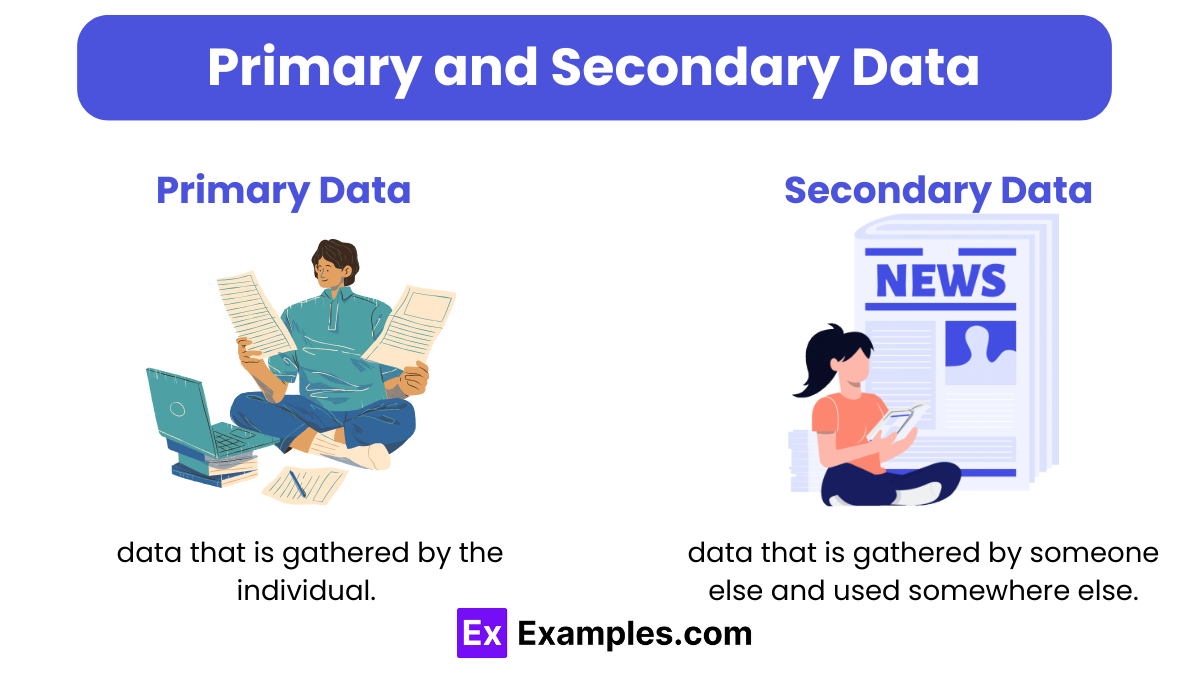
Definition: Primary data is original and collected firsthand by the researcher for a specific purpose or study. It is data that has not been previously collected or published.
Characteristics:
Methods of Collection:
Examples:
Definition: Secondary data is information that has already been collected, compiled, and published by others. It is not original and is used for purposes other than those for which it was originally collected.
Characteristics:
Sources:
Examples:
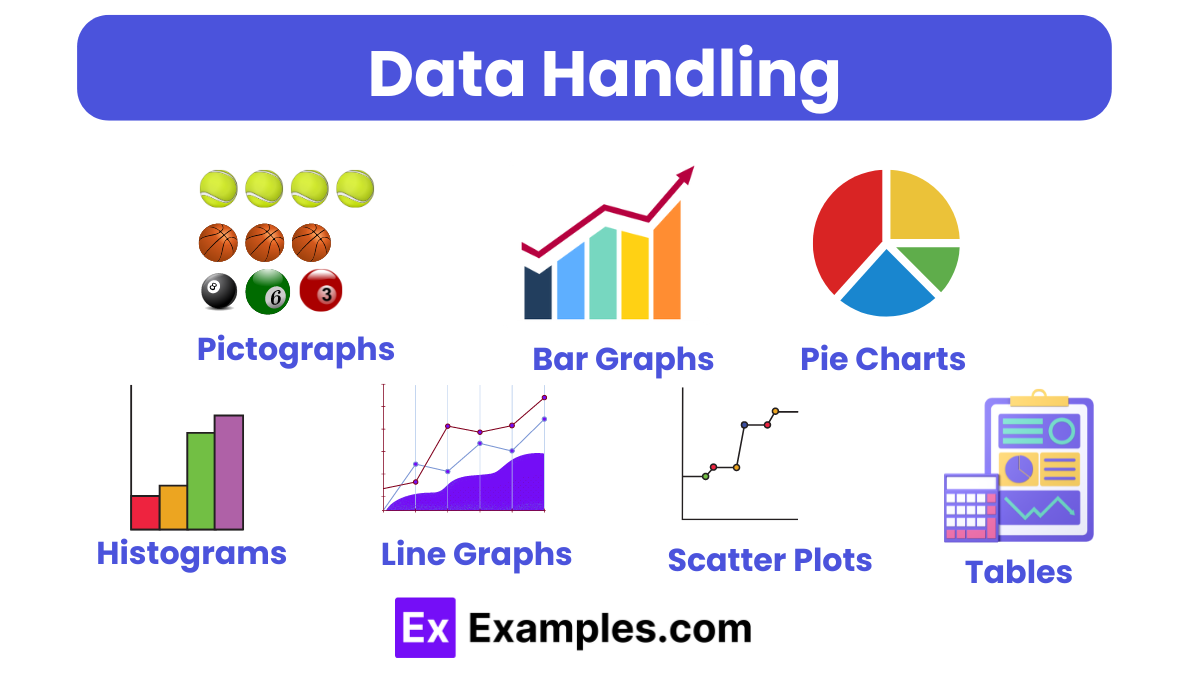
Data handling refers to the process of gathering, recording, organizing, and presenting information in a way that is useful and meaningful. It ensures that data is accurately and effectively used for analysis and decision-making. Data is typically represented visually to enhance understanding and interpretation. Here are different ways to represent data:
| Data Representation | Description | Use Case | Example |
|---|---|---|---|
| Pictographs | Uses pictures or symbols to represent data | Simple data for easy understanding | Number of apples sold each day |
| Bar Graphs | Uses rectangular bars to show quantities | Comparing quantities across categories | Sales of different products |
| Pie Charts | Represents data as slices of a pie | Showing relative proportions or percentages | Market share of smartphone brands |
| Histograms | Displays frequency distribution of continuous data | Showing distribution over a range | Distribution of students’ test scores |
| Line Graphs | Uses points connected by lines to show trends | Displaying changes over time | Monthly temperature changes |
| Scatter Plots | Uses dots to show the relationship between variables | Showing correlations between variables | Relationship between study time and test scores |
| Tables | Organizes data into rows and columns | Displaying detailed data for comparison | Population of different countries over the past decade |
Data is information collected through observations, measurements, or research. It includes facts, figures, and descriptions that can be analyzed to gain insights.
In mathematics, data refers to numerical or categorical information collected for analysis, computation, or reference.
A data type in math specifies the kind of data, such as integers, real numbers, or categorical data, that can be used in calculations and analysis.
Age of individuals
Test scores
Product prices
Survey responses
Monthly rainfall amounts
In statistics, data are values collected from observations, experiments, or surveys that are used for analysis and drawing conclusions.
An example of data in statistics is the daily temperature readings of a city over a month, used to analyze weather patterns.
Data in numbers is called numerical data or quantitative data, which can be measured and quantified.
Data is information collected about things, like numbers or names, that helps us learn more about them.
Data is factual information used as a basis for reasoning, discussion, or calculation, collected from various sources and formats.
Data in a study refers to the collected information and measurements used to analyze and draw conclusions about a research question.
The two types of data in statistics are qualitative (descriptive data) and quantitative (numerical data).

In a dataset of 5, 7, 8, 10, and 12, what is the median?
7
8
9
10
What is the mode of the dataset: 3, 5, 3, 8, 9, 3?
3
4
5
6
If the mean of a dataset is 15 and there are 5 data points, what is the total sum of the data points?
70
75
85
80
What is the range of the dataset: 14, 19, 22, 30, 25?
12
14
16
18
If the variance of a dataset is 25, what is the standard deviation?
5
10
15
20
In a dataset with values 4, 8, 12, 16, and 20, what is the average deviation?
2
4
6
8
What is the quartile range if Q1 = 10 and Q3 = 20?
5
10
15
20
If a dataset has values 9, 11, 14, 18, and 21, what is the mean absolute deviation?
3
4
5
6
What is the median of the dataset: 2, 4, 6, 8, 10, 12?
6
7
8
9
In a dataset where the mean is 50 and the median is 48, if the dataset is skewed right, what can be said about the distribution?
The mean is greater than the median.
The mean is less than the median.
The mean equals the median.
The mean and median cannot be compared.