Given the data points (1, 2), (2, 3), and (3, 5), what is the slope of the best-fit line using least squares?
0.5
5.5
1.2
2
of 10

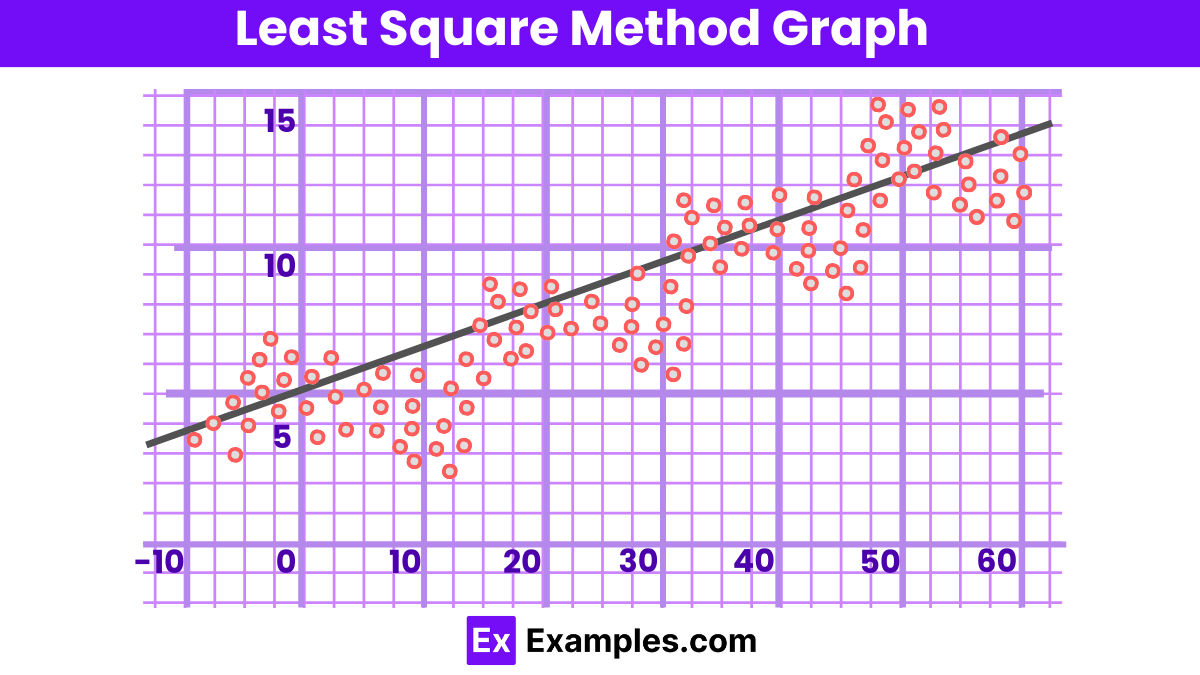
The Least Square Method is a statistical technique used to determine the best fit line for a set of data points by minimizing the sum of the squares of the vertical deviations (residuals) from each data point to the line. This approach is widely used in regression analysis to estimate the parameters of a linear model, aiming to reduce the difference between the observed values and the values predicted by the model. It is applicable in various fields for fitting a model to data, thereby enabling predictions and inferences about the relationships between variables
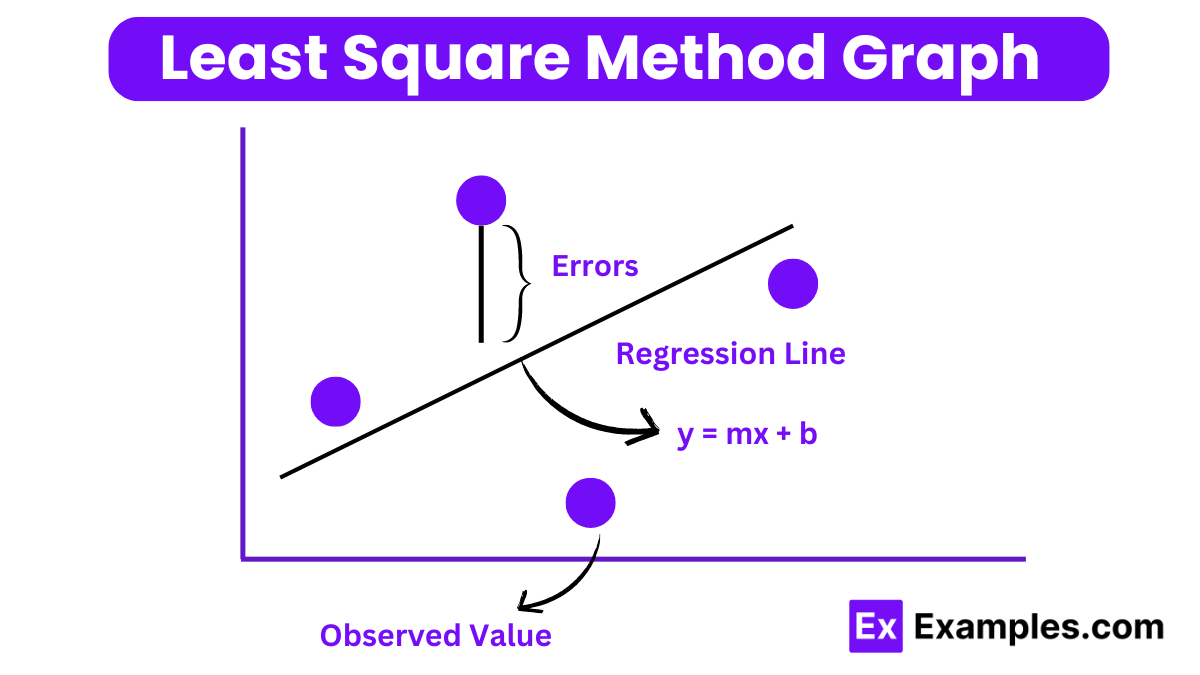
The formula for the Least Square Method, particularly in the context of fitting a linear regression line y=mx+b to a set of data points, involves calculating the slope (m) and the y-intercept (b) of the line that minimizes the sum of squared differences between the observed values and the values predicted by the line. The formulas are as follows:
Slope(m):
m=[n(∑xy)−(∑x)(∑y)]/[n(∑x²)−(∑x)²]
Y-intercept:
b=[(∑y)−m(∑x)]/n
Where:
In linear regression, the line of best fit is depicted as a straight line in the diagram below:
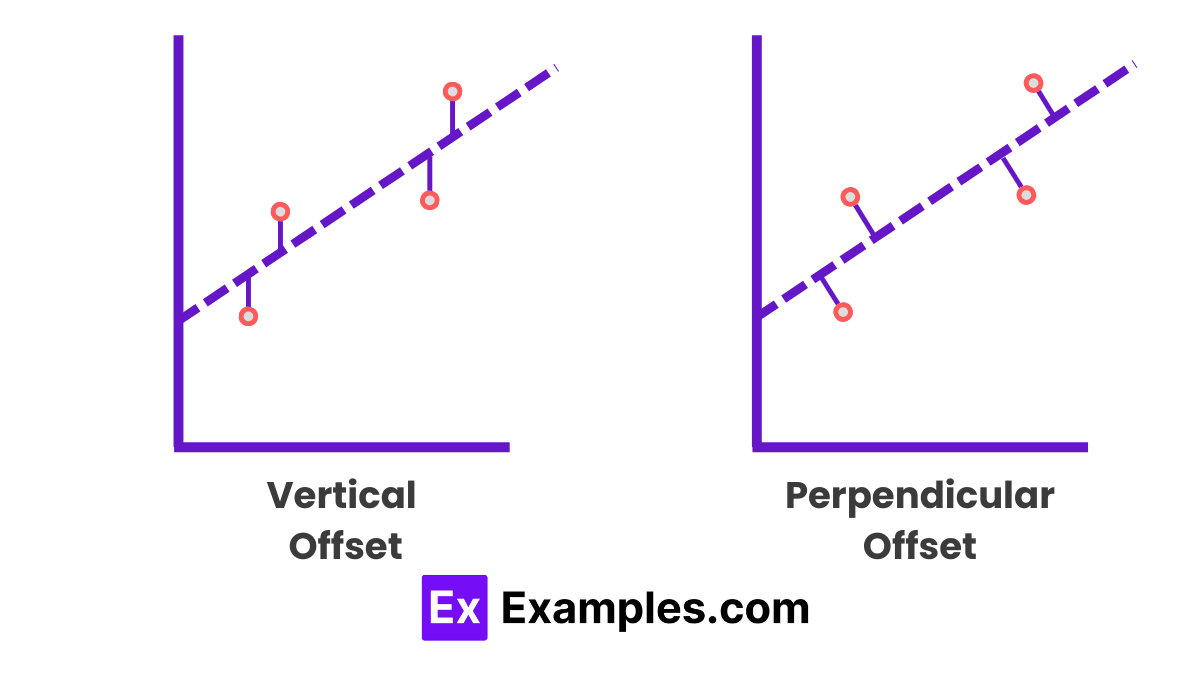
To minimize the given data points, the method involves reducing the residuals or offsets of each point from the line, typically using vertical offsets for surface, polynomial, and hyperplane problems, and perpendicular offsets in standard practice.
The least-square method, while widely used for data analysis and prediction, comes with its set of limitations:
Question 1: Given a set of data points (xi,yi) for i=1,2,…,n, find the equation of the line y=mx+b that best fits these points using the least squares method.
Answer 1: To find the best fitting line y=mx+b, we use the least squares method formulas to calculate the slope m and y-intercept b:
Calculate the mean of the x-values (xˉ) and the mean of the y-values (yˉ).
The slope m is given by:
m=[∑ⁿᵢ₌₁(xᵢ−xˉ)(yᵢ−yˉ)] / [∑ⁿᵢ₌₁(xᵢ−xˉ)²]
The y-intercept b is calculated using: b=yˉ−mxˉ
Thus, the equation of the line is y=mx+b.
Question 2: Assuming the data points (1,2),(2,3), and (3,5) are to be fitted with a straight line using the least squares method, calculate the slope and y-intercept of this line.
Answer 2:
Calculate the mean of the x-values (xˉ=2) and the mean of the y-values (yˉ=3.33).
Using the formula for the slope:
m=[(1−2)(2−3.33)+(2−2)(3−3.33)+(3−2)(5−3.33)] / [(1−2)²+(2−2)²+(3−2)²]
m=1.5
Calculate the y-intercept:
b=3.33−(1.5×2)=0.33
Therefore, the equation of the line is y=1.5x+0.33y=1.5x+0.33.
Question 3: Explain why the least squares method is preferred for fitting a line to a set of data points in comparison to other methods.
Answer 3: The least squares method is preferred because it minimizes the sum of the squares of the vertical distances (residuals) between the observed values and the values predicted by the model. This approach is statistically justified, as it produces the best possible estimates of the slope and intercept for linear regression, assuming the residuals are normally distributed and homoscedastic. It is efficient, minimizing prediction errors, and widely applicable, making it a standard method in linear regression analysis.
1. What is the formula for the slope (m) in the least squares method for a linear fit?
2. How do you calculate the y-intercept (b) in the least squares regression line equation?
3. What is the least squares criterion for a best-fit line?
4. How is the coefficient of determination (R²) calculated in the context of the least squares method?
5. Write the equation for a least squares regression line.
Least squares is a statistical method used to determine the best-fit line through a set of points by minimizing the sum of the squares of the vertical distances (residuals) between the points and the line. This technique is widely used in data fitting.
The primary rule of least squares is to find the parameters of the line (slope and intercept) that minimize the sum of the squared differences between the observed values and the values predicted by the line. This ensures the best possible accuracy of the model.
To use the least square method, first calculate the slope and intercept of the best-fit line using the formulas derived from the data points. Then, apply these parameters to predict values or analyze the relationship between variables, ensuring the residuals are minimized.
Least squares is an approach to fitting a mathematical model to data by minimizing the differences between observed values and the values predicted by the model. It’s ideal for finding the line of best fit in linear regression.
The fundamental rule in least squares involves adjusting the model parameters to minimize the sum of squared residuals, ensuring that the fitted line represents the best approximation of the observed data.
Employing the least square method involves identifying the linear equation that best models the data by minimizing the square of the difference between observed and predicted values, typically used for predicting outcomes or understanding relationships.

Given the data points (1, 2), (2, 3), and (3, 5), what is the slope of the best-fit line using least squares?
0.5
5.5
1.2
2
What is the y-intercept of the best-fit line if the slope is 2 and the line passes through the point (1, 4)?
2
3
4
5
If the least squares line is \( y = 3x + 1 \), what is the value of \( y \) when \( x = 2 \)?
5
7
8
10
For the data points (1, 2), (2, 4), (3, 5), what is the sum of squared residuals if the best-fit line is \( y = 1.5x + 0.5 \)?
1.25
0
1
1.5
What is the least squares regression equation for the data points (1, 1), (2, 2), (3, 2), and (4, 3)?
\( y = 0.5x + 0.5 \)
\( y = 1x + 0 \)
\( y = 0.75x + 0.5 \)
\( y = 1.25x - 0.5 \)
What is the standard error of estimate if the sum of squared residuals is 12 and there are 5 data points?
1
1.5
2
2.5
For the data set where the least squares line is \( y = 2x + 3 \), what is the predicted \( y \) value for \( x = 4 \)?
8
9
10
11
What is the total variance explained by the least squares regression line if the total sum of squares is 20 and the sum of squares of residuals is 5?
10
15
20
25
Given the data points (1, 2), (2, 2.5), and (3, 3), if the y-intercept is 1.5, what is the slope of the best-fit line?
0
1
2
3
For the data points (2, 3), (3, 5), and (5, 8), what is the correlation coefficient if the slope of the least squares line is 1.5?
0.3
0.9
0.12
0.18