

What is the primary purpose of a schematic diagram in electronics?
To provide detailed physical dimensions of components
To show the layout of an entire circuit board
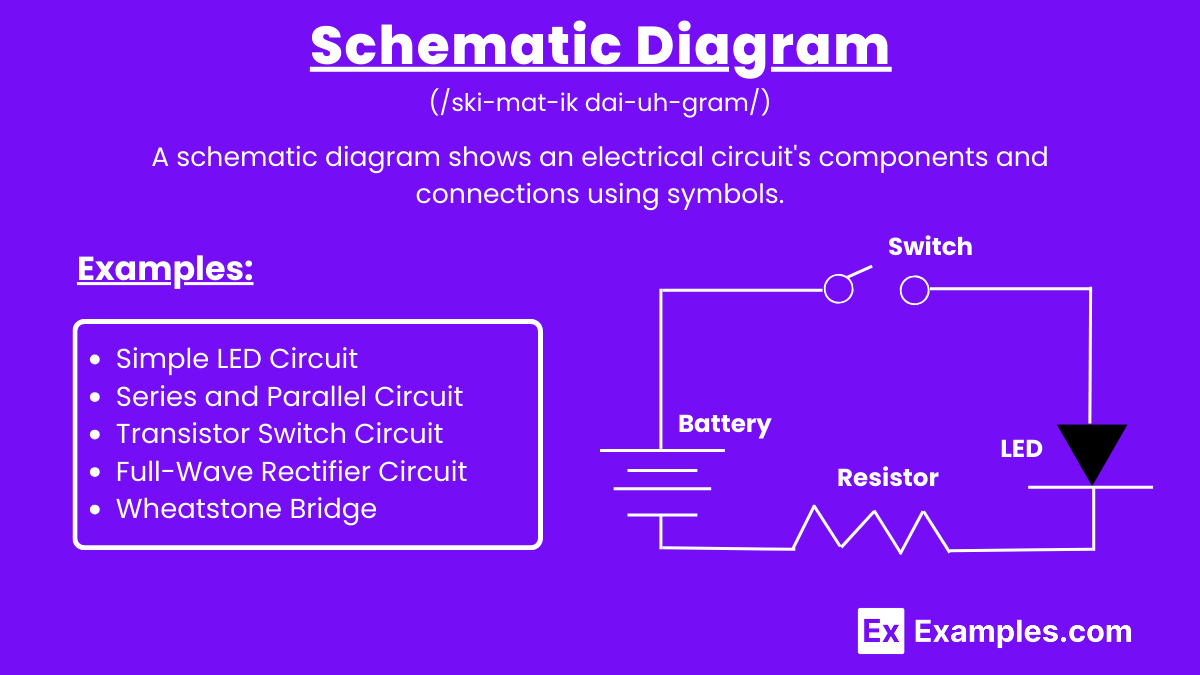
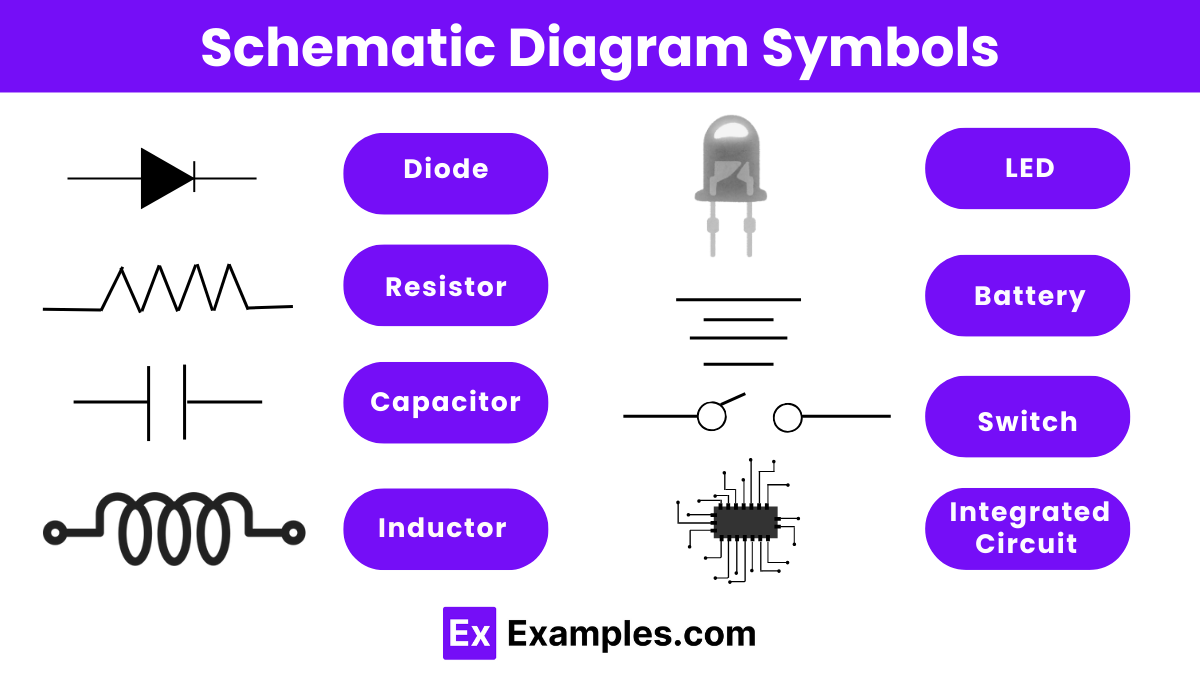
To illustrate the electrical connections and components in a circuit
To describe the materials used in a circuit
of 10